


Chapter VI
CLO Investment Strategies for Banks, Insurers and Total Return
A CLO rarely works in isolation, so its broader role in an investment portfolio matters. The role depends on the return, risk and diversification the CLO brings to the portfolio. It also depends on particular portfolio needs, which differ across banks, insurers, mutual funds and hedge funds.
Starting with leveraged loans: a distinct risk profile
The underlying exposure in a CLO is leveraged loans, so assessing CLO exposure starts there. Leveraged loans have a distinct risk profile, offering exposure to highly leveraged corporate balance sheets and offering coupons that reset to a floating market index. Exposure to leveraged corporate balance sheets make loans very sensitive to the ups and downs of economic growth and their implications for corporate earnings, and floating coupons nearly eliminate price sensitivity to changing interest rates. No other asset offers this combination. High yield debt comes close through its exposure to leveraged corporate balance sheets, but most high yield debt has fixed coupons and consequently more interest rate sensitivity. Other sectors of fixed income differ from leveraged loans in the underlying credit exposure, the interest rate sensitivity or both (Exhibit 6.1). Because leveraged loans are distinct, they stand to play a classic diversifying role. But before considering diversification, it is important to consider the quality of returns.
Exhibit 6.1: Leveraged loans offer a distinct combination of credit and rate exposure

Source: Santander US Capital Markets
Starting with leveraged loans: efficient trailing returns
From mid-2017 to mid-2022, leveraged loans delivered one of the more efficient performances in fixed income, at least measured by the rate of return on risk. Loans produced an average annual return of 3.05% with an annual standard deviation of 4.65%, or 0.66% return for each unit of risk (Exhibit 6.2). Returns in leveraged loans came in materially higher, and risk materially lower, than in high yield or investment grade corporate debt. And even though leveraged loans showed more return and more risk than private or agency CMBS, US Treasury debt, the aggregate US fixed income index and agency MBS, return for each unit of risk in leveraged loans still came in higher than any of these other sectors. Only ABS, which returned 1.51% with an annual standard deviation of 1.63%, produced a more efficient 0.93% return for each unit of risk.
Exhibit 6.2: Leveraged loans from 2017-2022 delivered efficient fixed income returns

Note: Annualized daily returns based on Bloomberg/Barclay’s indices for each asset classes except leveraged loans, which is based on the Morningstar/LSTA Total Return Index 7/5/17 to 7/1/22. Source: Bloomberg, Santander US Capital Markets.
Starting with leveraged loans: clear signs of diversification
Leveraged loans also provided valuable diversification. Low correlation of returns to other assets allows a small amount of exposure to make a portfolio much more efficient. Periodic returns in loans from mid-2017 to mid-2022 showed low correlation to almost every other major sector of fixed income. For example, daily returns on loans correlated -0.14 with returns on Treasury debt and -0.01 with returns on agency MBS (Exhibit 6.3). Leveraged loans showed small negative correlations with Treasury debt and MBS likely because of different responses in those sectors to economic growth: signs of weak growth driving up credit risk and driving down leveraged loan prices while Treasury and MBS prices rise, and signs of strong growth driving the opposite. Returns on loans showed a high correlation only with returns on high yield, the 0.79 correlation reflecting the sectors’ shared exposure to highly leveraged corporate balance sheets. The low correlation of loan returns stands in contrast to the much higher correlation of other asset classes with each other, reflecting common underlying interest rate risk. Returns on Treasury debt, for example, showed a 0.78 correlation with returns on investment grade credit. A little leveraged loan exposure would have gone a long way over this period to making a fixed income portfolio more diversified and more efficient.
Exhibit 6.3: Leveraged loans from 2017-2022 showed low correlation with other debt sectors
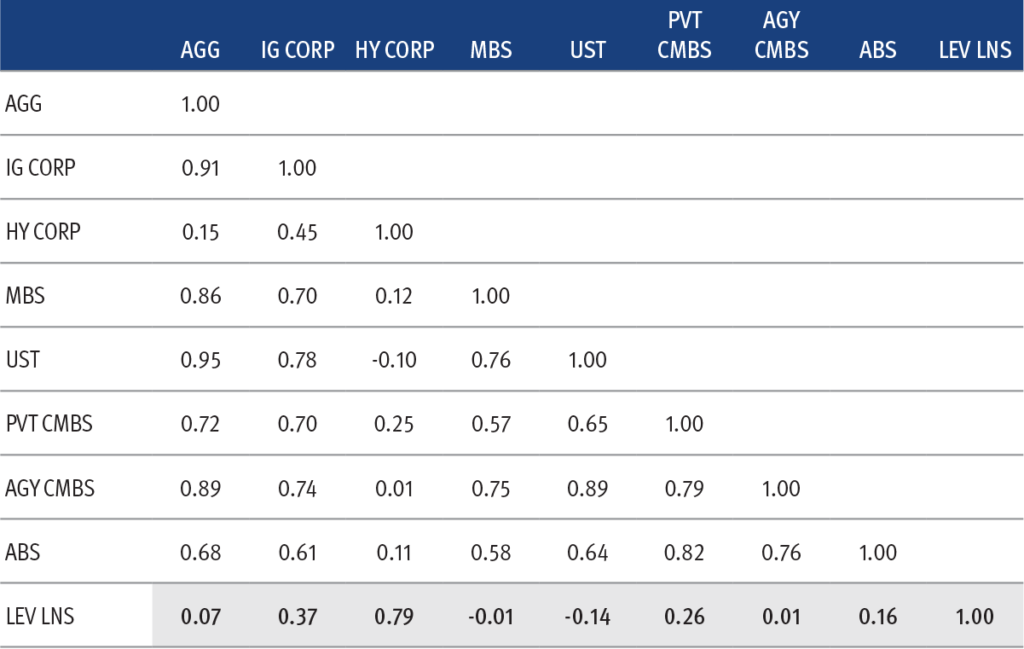
Note: Correlation of daily returns based on Bloomberg/Barclay’s indices for each asset classes except leveraged loans, which is based on the Morningstar/LSTA Total Return Index 7/5/17 to 7/1/22. Source: Bloomberg, Santander US Capital Markets.
Return, risk and diversification in CLOs
CLO structure takes the underlying exposure to leveraged loans and either magnifies or minimizes it. CLO equity holds a highly leveraged position in the portfolio of leveraged loans, financing roughly 90% of the portfolio by issuing CLO debt. Structural leverage magnifies the return and risk of the loan portfolio. With 90% financing and 10% equity, for example, a 1% drop in the value of the loan portfolio knocks down equity from 10% to 9%—a 10% drop in the value of equity. Return and risk get multiplied 10 times.
As for CLO debt, exposure to the loan portfolio drops as rating rises, reducing both return and risk. CLO debt returns from mid-2017 to mid-2022 show the impact (Exhibit 6.4). Compared to the average annual return and risk across a market index of leveraged loans, outstanding ‘AAA’, ‘AA’ and ‘A’ classes of CLO debt showed lower return and lower risk. Outstanding ‘BBB’ and ‘BB’ classes showed higher return and higher risk. Compared to the leveraged loan market index, returns in ‘AAA’ showed slightly more return for each unit of risk, and returns in ‘BBB’ showed slightly less. The ‘AA’, ‘A’ and ‘BB’ classes roughly matched the index in return for each unit of risk. These results suggest ‘AAA’ CLO debt over this period turned in the most efficient returns among CLOs, and ‘BBB’ debt the least efficient. Outside of CLOs alone, ‘AAA’ CLO debt turned in the most efficient performances across all fixed income, delivering 1.19% in return for each unit of risk.
Exhibit 6.4: Return and risk across CLO debt varies above and below the broad loan market

Note: Annualized daily returns based on Palmer Square CLO total return indices for each rating category except the leveraged loan index, which is based on the Morningstar/LSTA Total Return Index 7/5/17 to 7/1/22. Source: Palmer Square, Bloomberg, Santander US Capital Markets.
As for diversification, CLO debt returns look more correlated with each other than with the broad loan market. Correlation of daily returns within rated classes of CLO debt from mid-2017 to mid-2022 ranged from 0.69 to 0.90 (Exhibit 6.5). Correlation of rated classes to the market index fell in a lower range from 0.48 to 0.57.
Exhibit 6.5: Returns across CLO classes have been moderately correlated

Note: Correlation of daily returns based on Palmer Square CLO total return indices for each rating category except the leveraged loan index, which is based on the Morningstar/LSTA Total Return Index 7/5/17 to 7/1/22. Source: Palmer Square, Bloomberg, Santander US Capital Markets.
Before turning to the particulars of any portfolio, historical performance argues that leveraged loan exposure filtered through CLO structure has delivered some of the most efficient returns in fixed income and offered good potential diversification. Based on that track record, CLO exposure could play a valuable role in many debt portfolios.
Investing in CLOs for banks
Beyond general relative value, banks have to pay attention to a couple of other important considerations in any investment including yield and income, interest rate risk, hedging, realized and regulatory liquidity and risk-based capital.
CLOs coupons typically run well above a bank’s cost of funds and produce healthy net interest income. Yield and net income typically rank above price changes as the most valuable part of bank investment portfolio return. Net income gets reported quarterly through earnings, but changes in market value rarely do because of bank accounting. Banks classify most securities as either Available for Sale (AFS) or Held to Maturity (HTM) and only rarely as Trading. Changes in the price of AFS securities get recorded in a special account on the balance sheet, Accumulated Other Comprehensive Income (AOCI). Despite the name of the account, AOCI affects bank capital but does not show up in quarterly income and earnings. Since bank equity price historically is much more sensitive to earnings than to capital, banks attach high value to securities that produce yield and income. Hence the potential appeal of CLOs.
CLOs’ floating coupon reduces traditional measures of interest rate risk nearly to zero, although changes in CLO spreads can affect price. Banks can use CLOs to reduce portfolio price sensitivity to changing interest rates, which may be valuable depending on the bank interest rate target. Changes in spreads can move CLO prices above or below par, but those price changes show up in AOCI and not in earnings.
Banks have limited ability to hedge the credit or spread risk of CLOs. For any investor, the best hedge for a class of CLO debt depends on the changing value of the different options embedded in the debt. Most of those options could be at least partly offset by a variety of derivatives, including credit default swaps on high yield indices, options on equity indices and the like. These derivates would typically sit on a bank balance sheet with quarterly changes in value reported through income. At most banks, shareholders and management probably would not welcome the income volatility.
CLO realized liquidity, or the cost of trading a CLO for cash or using it as collateral for a loan, depends on market conditions. CLOs historically have been much less liquid than Treasury debt or agency MBS, and less liquid than non-agency MBS and certain ABS. However, CLO trading does get reported on TRACE, and the range of market prices for CLO debt at most rating levels is typically well known. Some banks see the investment portfolio exclusively as a store of liquidity and hold only assets with the most easily realized liquidity, others will hold relatively illiquid assets such as CLOs, non-agency MBS and ABS if other features compensate for the lower liquidity.
Larger banks—currently banks with $250 billion or more in total assets or with $100 billion or more in total assets and $50 billion or more of short-term wholesale funding, among other requirements—have to meet regulators’ requirements for the Liquidity Coverage Ratio. This set of rules classifies certain assets such as Treasury debt or agency MBS, among others, as High-Quality Liquid Assets (HQLA). Banks have to hold enough HQLA to defend against a run on bank deposits. Even banks below the largest consider the liquidity of their securities investments. CLOs do not qualify as HQLA.
CLOs, like any investment, require a bank to hold risk-based capital. The amount for a CLO depends on a special test, the simplified supervisory formula approach or SSFA. The SSFA takes into account the risk-based capital required for the underlying leveraged loans, the attachment point or the percent of the collateral pool subordinate to the class, the thickness of the class and whether the pool includes just loans or also includes bonds and other securitizations, too. The FDIC and others provide calculators for the risk-based capital required for CLOs and other securitizations. For a new deal with no defaulted loans and no bonds or other securitizations included, risk-based capital required ranges from 20% for a typical ‘AAA’ or ‘AA’ class to 1132% for CLO equity (Exhibit 6.6)
Exhibit 6.6: Risk-based capital for a new CLO varies across classes

Note: SSFA RW calculated from FDIC calculator https://www.fdic.gov/resources/bankers/capital-markets/regulatory-capital/ssfa-job-aid.xls. Source: FDIC, Santander US Capital Markets
Banks have steadily increased their CLO holdings, with balances by the end of 2018 exceeding $93 billion (Exhibit 6.7). At the end of the first quarter of 2022, regulatory reports showed holdings topped $155 billion. Banks largely hold ‘AAA’ classes because of the available size, relative liquidity and usually favorable capital treatment.
Exhibit 6.7: Banks hold most of their CLO exposure in senior classes

Note: All estimates as of December 2018. BHCs include other financial organizations other than insurers, mutual funds, pension funds or hedge funds. See DeMarco, L., E. Liu, T. Schmidt-Eisenlohr, “Who Owns U.S. CLO Securities? An Update by Tranche,” FEDS Notes, June 25, 2020. Source: Federal Reserve, Santander US Capital Markets.
Banks have a few appealing strategies involving CLOs:
- Hold ‘AAA’ and ‘AA’ CLOs instead of similarly rated MBS, CMBS or ABS floaters
- Hold ‘AAA’ and ‘AA’ CLOs from managers with high information ratios, wide debt spreads and low beta
- Structure exposure to new ‘AAA’ or ‘AA’ CLOs as loans rather than securities to take advantage of favorable loan accounting
Investing in CLOs for insurers
Insurance company investors also have to pay attention to a few unique portfolio considerations. Like banks, those considerations also include yield and income, interest rate exposure, hedging and capital. Unlike banks, most insurance portfolio investors in CLOs are less sensitive to liquidity.
As with banks, CLO coupons also tend to run well above insurers’ cost of funds. For insurers, funding cost ultimately depends on the cost of acquiring premiums, running the company and paying claims—for a property and casualty company, for example, the combined ratio. Insurers also report net interest income through earnings and any changes in market value through AOCI, so income again becomes very important. CLO income can be valuable to insurers.
Low CLO interest rate sensitivity might look good to insurers that have short liabilities but perhaps not so much to life insurers with long liabilities. Insurers nevertheless can combine CLOs with long Treasury, corporate or structured debt to create interest rate sensitivity that matches liabilities.
Like banks, insurers also have to approach hedging CLO risks with caution. Any mismatch between the changing value of the CLO and the changing value of any hedges would also flow through quarterly income, bringing unwelcome volatility.
The capital required for holding CLO debt currently depends on rating. The National Association of Insurance Commissioners recommends to states a schedule of risk-based capital for each rating category. Through 2020, the NAIC capital schedule put ‘AAA’, ‘AA’ and ‘A’ debt in the same category, NAIC 1, and recommended the same amount of capital for each rating, encouraging insurers to hold the lowest of the three ratings with the most yield spread (Exhibit 6.8). The NAIC changed capital charges starting in 2021, creating a finer grid of ratings with different risk-based capital charges for each. This should lead insurers to distinguish more carefully between CLOs with different ratings depending on available spread and required capital. In 2022, the NAIC has started reexamining capital charges for CLOs in particular. The NAIC is concerned that the capital required to hold a portfolio of leveraged loans differs from the capital required to hold every class of a CLO holding the exact same loans. The NAIC has started a review that could lead to changes in capital charges for CLOs sometime in 2023 or 2024.
Exhibit 6.8: NAIC life insurer risk-based capital schedule

Source: NAIC, New England Asset Management
Insurers’ need for liquidity depends on the structure of liabilities. In general, insurers take in premiums and invest them until either the policy lapses or expires or until the insurer needs to pay claims. For P&C insurers writing auto or homeowner policies, for example, a steady stream of claims requires the insurer to hold relatively short, liquid assets to cover potential claims. For life insurers, however, the time between receiving premium and paying a claim can be decades. Life insurers can hold relatively illiquid assets that fluctuate in price with little return of principal, and life insurers can do that without endangering their ability to pay claims. Life insurers consequently have felt comfortable holding CLOs across a range of rating categories.
Insurers at the end of 2018 held more than $108 billion in CLOs roughly evenly spread across senior, mezzanine and junior notes with a small exposure to CLO equity (Exhibit 6.9). By the end of 2019, insurer CLO exposure had jumped to nearly $157 billion, according to the NAIC, and by the end of 2020 to nearly $193 billion.
Exhibit 6.9: Insurers hold equal amounts of senior and lower CLO notes

Note: All estimates as of December 2018. See DeMarco, L., E. Liu, T. Schmidt-Eisenlohr, “Who Owns U.S. CLO Securities? An Update by Tranche,” FEDS Notes, June 25, 2020. Source: Federal Reserve, Santander US Capital Markets.
Insurers also have a couple of good strategies with CLOs:
- Hold CLOs paired with long Treasury or corporate debt to match the duration of liabilities
- Hold CLOs from managers with high information ratios, wide debt spreads and low beta
- Structure private CLOs where the insurer agrees to finance a portfolio of loans that might not easily fit the requirements of a public deal rated by Moody’s, S&P or Fitch
Investing in CLOs for mutual funds
Relative value and potential return are probably the most important aspects of CLO investing for mutual funds, which usually benchmark themselves to the total return of various fixed income market indices. Potential diversification from CLO exposure should also seem attractive. Interest rate exposure and liquidity also matter. Unlike a bank or insurers, mutual funds do not hold regulatory capital. But the fund investment guidelines often have to allow CLO exposure.
Mutual fund investors have to fit CLOs’ low price sensitivity to shifting interest rates into their overall portfolio target. As a substitute for other short asset such as Treasury bills, short ABS and the like, investing in CLOs is straightforward. Substituting for corporate debt or MBS can involve a mismatch since these other assets usually entail more price sensitivity. A mutual fund investor may have to pair a CLO with Treasury or corporate debt or MBS to create the needed price exposure, or pair CLOs with Treasury futures instead to hit a targeted duration.
Liquidity can be an important consideration as well since mutual funds face daily redemptions from their shareholders. Mutual funds can usually predict daily redemptions, but sometimes redemptions surge, especially following poor performance in actively managed fixed income funds.
At the end of 2018, mutual funds had roughly two-thirds of their exposure in CLO senior notes, a fifth in mezzanine and junior notes and an eighth in CLO equity (Exhibit 6.10).
Exhibit 6.10: Mutual funds lean toward senior CLO notes

Note: All estimates as of December 2018. See DeMarco, L., E. Liu, T. Schmidt-Eisenlohr, “Who Owns U.S. CLO Securities? An Update by Tranche,” FEDS Notes, June 25, 2020. Source: Federal Reserve, Santander US Capital Markets.
Some strategies available to mutual funds:
- Relative value based on MVOC, beta, debt refinanceability, volatility and time
- Diversification and out-of-index exposure to improve expected returns, reduce risk or do both for an indexed portfolio
- CLOs paired with Treasury or corporate debt or MBS to add carry while hitting index duration targets
Investing in CLOs for hedge funds
Unlike the average mutual fund, which usually limits exposure to any single asset class, a hedge fund can specialize and create deep expertise in targeted classes, including CLOs. There is no prescribed or benchmark interest rate exposure that a hedge fund has to target, and a fund’s mark-to-market balance sheet easily accommodates hedging with derivatives. Capital requirements or financial leverage usually get set through fund investment guidelines. Liquidity depends on the notice period the fund requires from its investors, and on gates or other requirements for redemption. If there is a limit on hedge fund investing in CLOs, it is the rate of return required by the hedge fund’s investors. That could rule out investing in any class trading below some threshold spread. Otherwise, hedge funds have a lot of flexibility to extract value from CLOs in any way possible.
At the end of 2018, hedge funds held roughly equal parts senior notes, mezzanine and junior notes and equity, with a slight tilt toward equity (Exhibit 6.11).
Exhibit 6.11: Hedge funds traffic in all CLO classes

Note: Hedge funds includes funds, other than mutual funds, and other investment vehicles. All estimates as of December 2018. See DeMarco, L., E. Liu, T. Schmidt-Eisenlohr, “Who Owns U.S. CLO Securities? An Update by Tranche,” FEDS Notes, June 25, 2020. Source: Federal Reserve, Santander US Capital Markets.
Hedge funds along with CLO market-makers may be the investors most likely to hedge CLO risk. Since the floating index on most CLO debt largely eliminates interest rate risk, hedging revolves almost entirely around credit or spread. Some portfolios try to hedge day-to-day spreads by taking offsetting positions in investment grade or high yield corporate credit default swaps, or CDS. But the simple correlation between day-to-day changes in CLO spreads and day-to-day changes in CDS is low, exposing the portfolio at times to sizable net mark-to-market volatility. Other portfolios, especially ones holding ‘AAA’ or ‘AA’ risk, may hedge only with out-of-the-money options on the S&P 500 or some other risk asset as a form of disaster insurance.
- Some unique strategies pursued by hedge funds:
- Investing in CLO equity for its carry and potential high returns
- Activist investing where the owner of control equity can require a CLO manager to refinance debt, reset broader deal terms, lower management fees or take other actions to increase the value of equity
- Investing in CLO debt using leverage to increase return on fund equity
A tailored exposure to leveraged loans
Leveraged loans’ track record of return, risk and diversification make them potentially valuable for a wide set of portfolios. And investors’ ability to use CLO structure to tailor the exposure to the unique needs of a given portfolio extend the potential value. Banks, insurers, mutual funds, hedge funds and other portfolios have become active investors in leveraged loans and CLOs. As the market evolves, the strategies used to extract value should continue to evolve as well.
< Previous Next >
For a print copy of the book, A Quick Guide to CLO Debt and Equity, please contact your Santander Sales Representative.