


Chapter V
Evaluating CLO Equity
Even though the CLO market and its investor base has grown steadily in the last decade, most CLO equity still ends up in relatively few hands. CLO debt goes to a wide set of banks, insurers, money managers and hedge funds. But equity still goes mainly to specialty investors and to CLO managers themselves. A wider set of investors might find the exposure valuable.
Because most CLOs have an active manager, CLO equity can control important aspects of CLO management. The CLO indenture and rating agency guidelines set boundaries on CLO management and the manager has wide discretion within those boundaries, but an investor—or a set of investors—holding a majority of equity can have significant influence as well. Investors can acquire controlling equity at new issue or in the secondary market. Controlling equity usually joins the CLO manager in negotiating initial deal terms with providers of debt. Controlling equity can choose to call or liquidate an eligible deal, or restructure or amend it. And while CLO indentures limit conflicts of interest between equity and the CLO—such as making loans to equity holders or their affiliates–equity investors almost certainly have a view of day-to-day portfolio management and, like equity investors everywhere, likely express it. Most CLO equity investors hold positions passively over long horizons, but some get actively involved in shaping deal management in hopes of quickly raising the value of equity and trading out.
CLO equity usually gets issued and trades—if it trades at all—in markets with limited or no price disclosure, making investment performance hard to gauge. Distributions of cash flow to equity get widely reported, but final returns after liquidation of portfolio loans rarely do. Analysis of CLO equity nevertheless continues to improve, and the latest work suggests CLO equity has a role to play in portfolios of alternative investments. In particular:
- Of the 797 CLOs included in an Amherst Pierpont study that made final distributions to equity between the late 1990s and 2020, the average equity returned 8.98% a year and the median equity returned 10.63%
- CLO equity performed well compared to the S&P 500 Banks sub-index before the Global Financial Crisis and to the S&P 500 before and after
- CLO equity provided diversification in a portfolio of alternative debt holdings, and
- CLO equity performance depended both on market conditions after issuance and on the CLO manager’s ability to navigate both the asset and liability side of the CLO balance sheet through changing markets
Sources of return on equity
CLO equity investors participate in a straightforward business. Equity shareholders hire a management team, raise debt and use proceeds to buy a portfolio of leveraged loans. The debt indentures along with debt rating agencies set guidelines for management. The manager can actively manage the loans within the deal guidelines and refinance or restructure the debt. Return on equity consequently depends on the manager’s skill in extracting return from the loans, managing the debt and navigating market conditions.
The most easily measured returns to equity come from the cash flow and liquidation value of the leveraged loans. The loans generate interest that goes to covering taxes, administrative expenses, the rare hedges in older deals, manager fees and the cost of CLO debt with any remaining interest flowing to equity. Portfolios can also generate capital gains and losses, and some CLOs allow gains to flow to equity if debt gets refinanced or deal terms get reset. After the CLO ends its reinvestment period and pays off all debt and other expenses, equity gets the remaining portfolio liquidation value.
Returns also depend on navigating the guidelines set out by the debt indentures and rating agencies. CLO overcollateralization and interest diversion tests, for example, can divert cash away from equity to protect debtholders. The equity class does not get the diverted cash back. Managers’ skill in avoiding failed tests or fixing failed tests quickly can make a material difference in equity return. Skill at operating within CLO constraints adds up.
Return on equity consequently depends on a clear set of cash flows, heavily weighted toward the difference between interest income and interest expense and magnified by leverage:
- Revenues
- Interest income from the leveraged loan portfolio
- Gains from realized appreciation in the market value of loans
- Proceeds from loan sales and from prepayments and maturities after CLO reinvestment ends
- Expenses
- Interest expense, including interest diverted to cure failed CLO tests
- Taxes, administrative expenses and hedge costs
- Manager fees
The return on equity is just the residual value available to shareholders:

Each component of return can vary based on the CLO manager’s efforts and market conditions.
Different classes of equity
Equity itself does not necessarily come in one undifferentiated class, although that is the most common form. Investors can split equity into preferred classes with prescribed coupons and rights to certain cash flows, senior equity entitled to certain cash flows and junior equity that gets any residual value. CLOs can set up these equity classes at new issue to allow investors to come in later without changing the CLO capital structure. CLOs can also set up new classes of equity if a deal gets refinanced or reset, especially if the deal needs new equity to bring portfolio market value up to levels needed to allow refinancing or reset. Risk and return obviously can vary across these classes of equity. In this discussion, however, the focus will be on untranched equity exposure.
The basics of evaluating CLO equity
CLO equity investors, just like debt investors, often have their own checklist of items to review on any investment. Some items overlap between debt and equity, but equity typically runs a more robust set of scenarios:
- The manager. Institutional strengths and weaknesses, alignment of interest with equity and past equity performance.
- The interest only or IO value. The projected residual interest distributed to equity during and after reinvestment, with particular attention to the difference between the weighted average spread of assets and the weighted average cost of liabilities. An equity investor will also pay special attention to structural leverage, such as the ratio of assets to equity, since leverage magnifies returns.
- The principal only or PO value. The projected principal distributed after paying off all debt and other expenses, or the terminal NAV, with close attention to portfolio quality, the tail risks represented by exposure to ‘CCC’ loans and to loans trading at low prices
- Sensitivity analysis. CLO equity investors will also typically run a series of scenarios, to probe exposure to infrequent or even rare events that nevertheless have a big impact on equity returns. The scenarios gauge sensitivity to a string of key exposures:
- Low-priced loans. Running higher default rates and lower recoveries
- ‘CCC’ loans. Running higher default rates and lower recoveries
- Par build. Running higher and lower reinvestment prices
- Reinvestment spreads. Running future purchases at higher and lower WAS
- Upside in deeply discounted loans. Running to higher prices
- Debt refinancing. Running a debt call and reissue at tighter spreads
- Deal reset. Running deal extension at a similar or lower cost of capital
- Specific issuers or industries. Running loans or sectors to special assumptions
- Ramping a new issue. Running scenarios around building a new deal portfolio
All of these practical analyses have roots in the history and performance of CLO equity.
Extending recent work on CLO ROE
Efforts to measure and model equity performance and the contributions of the manager and the market are relatively new despite a history of CLO issuance going back to the 1990s. Investors held an estimated $85 billion of par US CLO equity in deals backed by broadly syndicated loans as of June 2021, but lack of regular market pricing makes it hard to run traditional mean-variance analysis of asset returns. Investment analysts instead routinely estimate returns from interest cash flow to equity, although these estimates commonly omit the final principal distributions essential for calculating an internal rate of return, or IRR. Loans may continue distributing interest long after prospects of returning full principal have diminished, and it is not until default and liquidation or some alternative resolution that true IRR becomes clear. Thorough analysis of equity returns consequently focuses only on completed CLO deals.
Larry Cordell at the Federal Reserve Bank of Philadelphia along with Michael Roberts and Michael Schwert (CRS) at the University of Pennsylvania’s Wharton School provide one of the first comprehensive efforts to assess equity returns on completed US CLOs backed by broadly syndicated loans. CRS focuses primarily on the performance of CLO equity and debt and whether it generates excess return beyond market benchmarks. Their work draws some important conclusions:
- CLO equity from 1997 through 2016, after subtracting management fees, has performed better than the S&P 500 Bank sub-index before the GFC and the S&P 500 before and after
- CLO equity returns rise substantially if measured before managers’ fees, with the average IRR going up more than 50%, implying managers capture a significant share of CLO residual value
- CLO debt has performed better than corporate bonds with similar ratings and duration, although the better performance likely reflects lower liquidity for CLO debt and other risks
CRS also includes an appendix that looks at the influence of CLO managers on equity returns. The CRS analysis draws some broad conclusions about managers:
- CLO managers have significant impact on equity IRR
- Differences in managers’ equity IRR tend to persist over time, and
- Managers most important influence comes through loan spread, debt costs and leverage, and by trading the portfolio and building par
Work by Amherst Pierpont confirms most of the key manager findings in CRS and extends the analysis by quantifying specific ways managers contribute to equity IRR. In particular:
- CLO equity IRR depends significantly on market conditions that play out after issuance and stand outside manager control
- Manager influence on equity IRR shows important evidence of persisting from one deal to the next, as in CRS
- Manager influence on loans spread, debt costs and leverage have the biggest impact on IRR, with ability to meet CLO coverage tests and avoid catastrophic failure a close second
- Manager ability to add stable excess return to loan portfolio performance can add substantially to equity IRR, and
- Manager decisions about non-call and reinvestment periods can add to equity IRR depending on market conditions after issuance
The record of completed deals
Both the Amherst Pierpont analysis and CRS focus only on deals that have made final distributions to CLO debt by June 2020. This allows calculation of an equity IRR, assuming investment in equity at face value. Investors often buy equity at a discount to par, so IRR in the Amherst Pierpont work and in CRS is a lower bound. Since older deals have more time to finish, the percentage of each vintage entering the analysis falls for more recent vintages, so earlier vintages weigh more heavily in the results (Exhibit 5.1).
Exhibit 5.1: The share of CLO deals completed by mid-2020 falls in later vintages
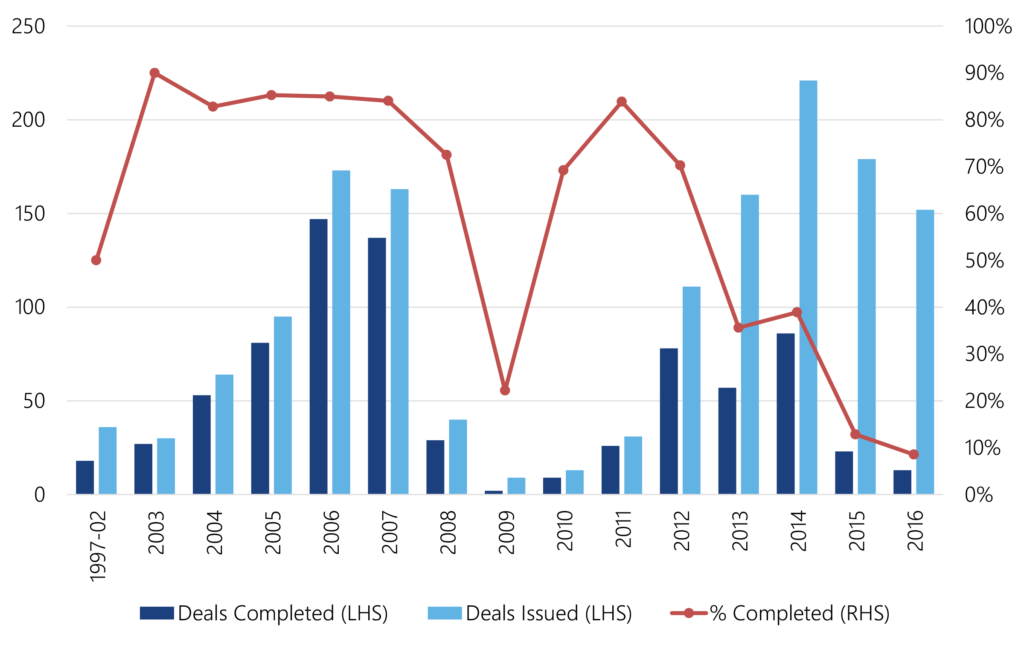
Note: Underlying data for this chart available in the data appendix. Source: Intex, Santander US Capital Markets
The APS count of completed CLO deals parallels the count from CRS. This shows consistency between the two studies in identifying completed deals. Both the APS and CRS analysis show 2006 and 2007 vintages with the most completed deals, each with at least 135 (Exhibit 5.2). No vintage since then has approached those numbers. At the other extreme, both APS and CRS show only two completed deals in 2009.
Exhibit 5.2: The largest share of completed CLO deals so far came before 2008
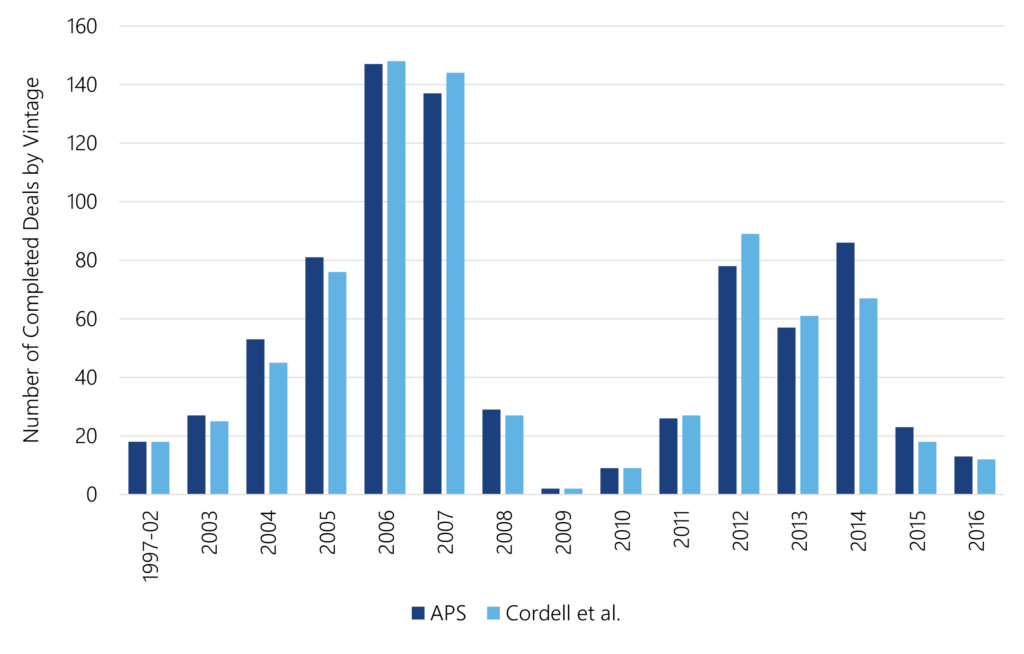
Note: Underlying data for this chart available in the data appendix. Source: Santander US Capital Markets, CRS
Over the full sample of 797 completed deals, the average equity tranche earned an IRR of 8.98% with a median of 10.63% (Exhibit 5.3). The average deal issued equity with a face value of slightly more than $50 million, debt with a face value of slightly more than $432 million and held loan portfolios with a face value of slightly more than $480 million. Average leverage, measured by the ratio of face value of debt to face value of loans, came to 0.90. The loan portfolio over the life of the deal earned an average spread over LIBOR of 3.57% and paid a weighted average cost of capital, or spread over LIBOR, of 1.30%. The average initial non-call period ran slightly more than three years, reflecting the prevalence of CLO 1.0 deals in the sample, and a reinvestment period of slightly more than five years. Over the life of the deal, 52% at some point failed an overcollateralization test for an average of 6.43 months. Deals that failed an interest diversion test on average failed for 4.02 months, and those that failed an interest coverage test on average failed for 2.92 months. Managers can also refinance CLO debt, and 17% of deals refinanced at least once. Managers can also lower debt costs by raising the share issued as ‘AAA’, and an average of 63% of debt came as ‘AAA’. Managers can also add value to loan portfolio performance, and the average deal realized 5 bp of monthly excess return, or alpha, with a beta of 0.95 and an information ratio of 0.13.
Exhibit 5.3: The distribution of key attributes in deals completed by June 2020
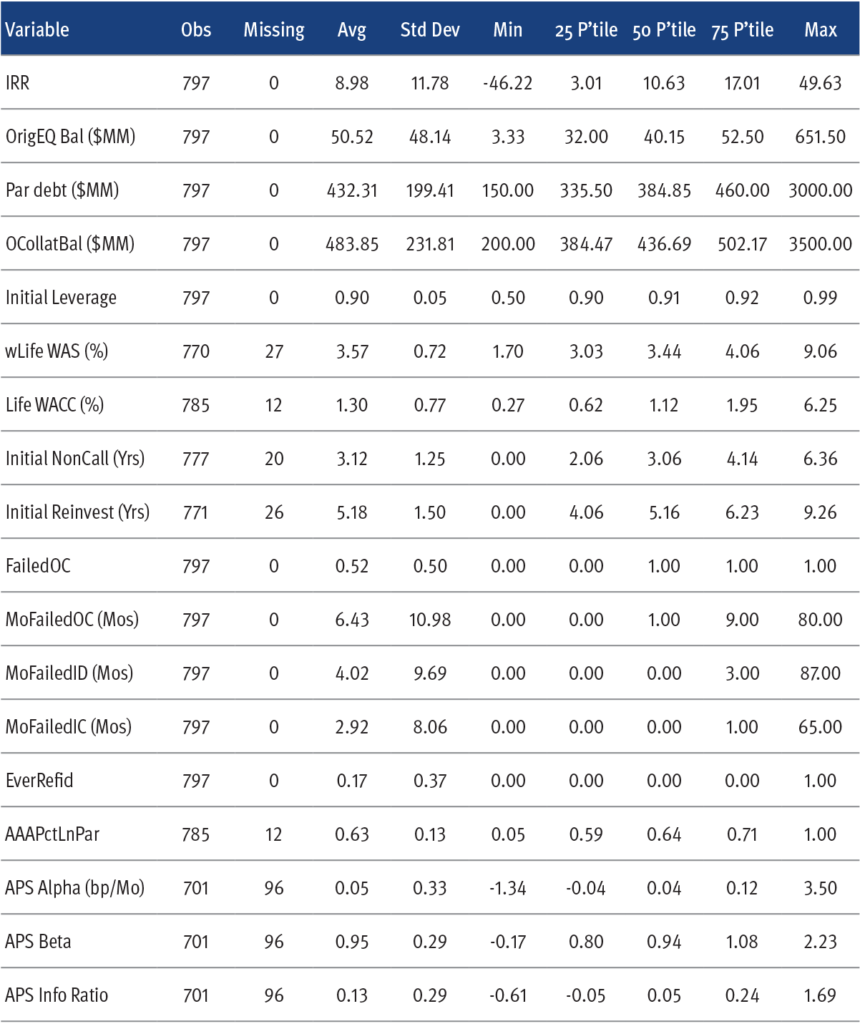
Source: Intex, Santander US Capital Markets
A lot depends on timing and available net interest income
Return on CLO equity has varied significantly year to year, underscoring the impact of timing and market conditions for issuing debt and investing in loans. Both the APS and CRS analysis show the highest equity IRR on vintages issued before the 2008 financial crisis (Exhibit 5.4). Median IRR in both analyses far exceeded 10% for the 2005, 2006 and 2007 vintages and later in the 2011 vintage. Other vintages posted mid-single digit IRR, and the small 2009 vintage posted roughly a 10% loss.
Exhibit 5.4: CLO equity IRR has varied dramatically by vintage
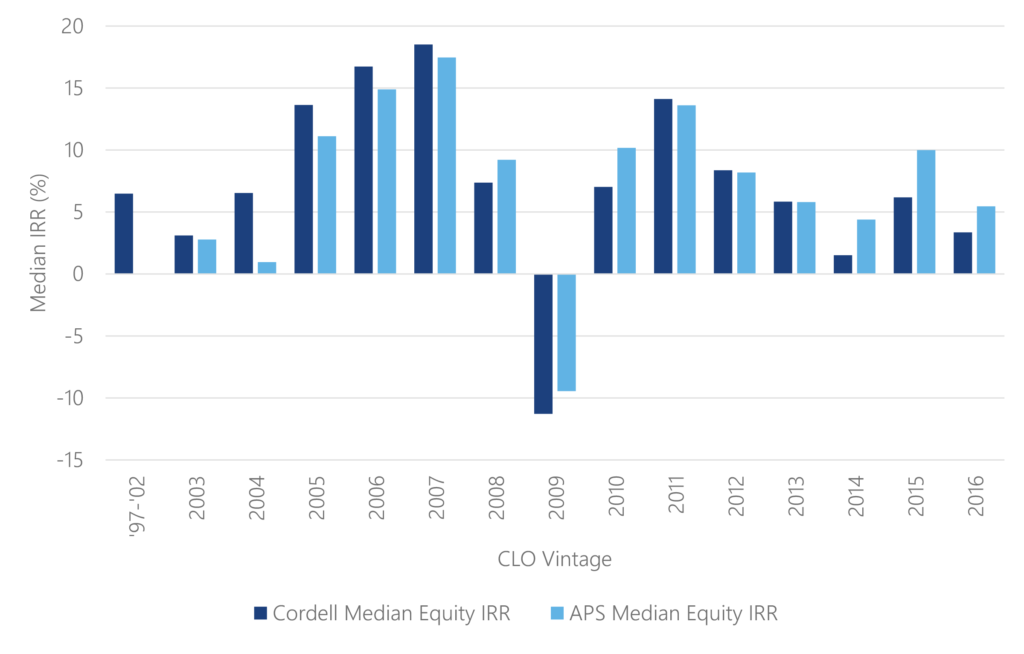
Note: Underlying data for this chart available in the data appendix. Source: Intex, Santander US Capital Markets, Cordell et al.
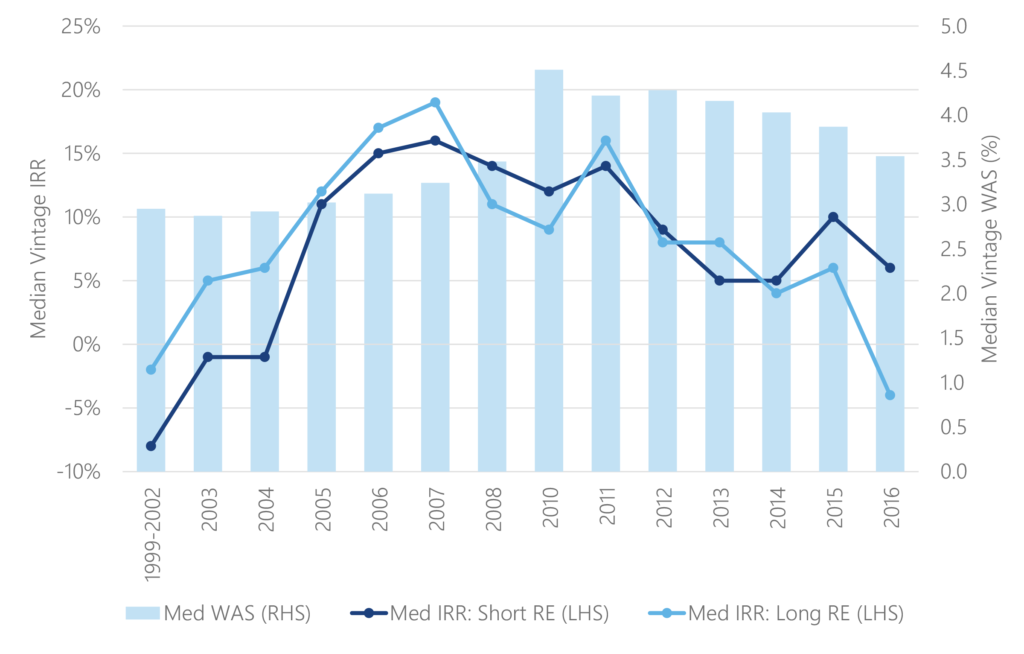
Differences in IRR across vintage partly reflect differences in investment and funding opportunities for the CLO managers. This is part of the systematic risk of CLO equity. The pre-2008 vintages issued debt at tight spreads and later entered CLO reinvestment periods after 2010 in markets where loans generally traded at much wider spreads. Tight debt and wide reinvestment increase the net interest income available to equity. Later vintages issued debt at wider spreads and generally saw spreads on debt and loans track tighter together. The difference between weighted average cost of debt capital and the weighted average spread on portfolio loans over the life of a completed deal, a measure of net interest income, was widest in pre-2008 vintages (Exhibit 5.5). The spread between loans and debt broadly declined after 2010, possibly reflecting the growth and improving liquidity in outstanding CLOs and leveraged loans.
Exhibit 5.5: The difference between loan spread and debt costs varies by vintage
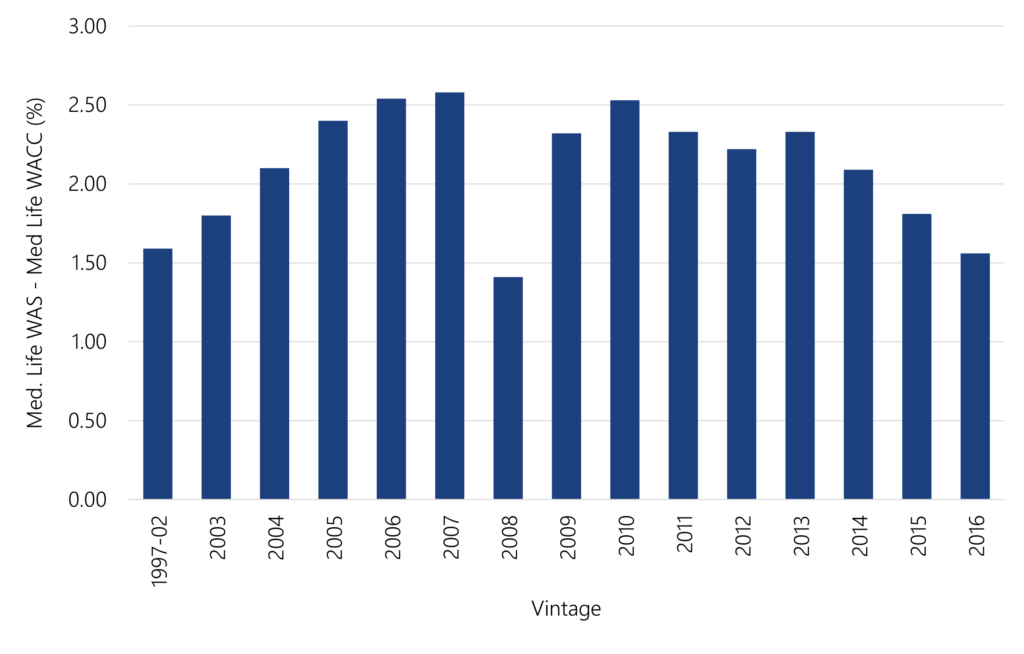
Note: Underlying data for this chart available in the data appendix. Source: Intex, Santander US Capital Markets
The spread between loan portfolio coupon and debt coupon over time also highlights differences between vintages and the importance of CLO dynamics after the end of reinvestment. The 2007 vintage of completed deals, for example, started 2008 with an average spread of 320 bp, peaked at the close of 2012 at an average spread of 400 bp and saw the average spread decline toward zero as the strongest deals in the vintage completed (Exhibit 5.6). The 2008 vintage started with an average spread of 260 bp, peaked at the end of 2010 at 297 bp and also saw margins decline after reinvestment, with margins going significantly negative. These and all other vintages include a tail of deals with material amounts of defaulted loans. Performing loan balances can drop below performing debt balances and create an interest shortfall, or negative net interest income. The pattern highlights the importance to equity of managing loan credit quality all the way to the last day of the CLO.
Exhibit 5.6: Different CLO vintages, different net interest income
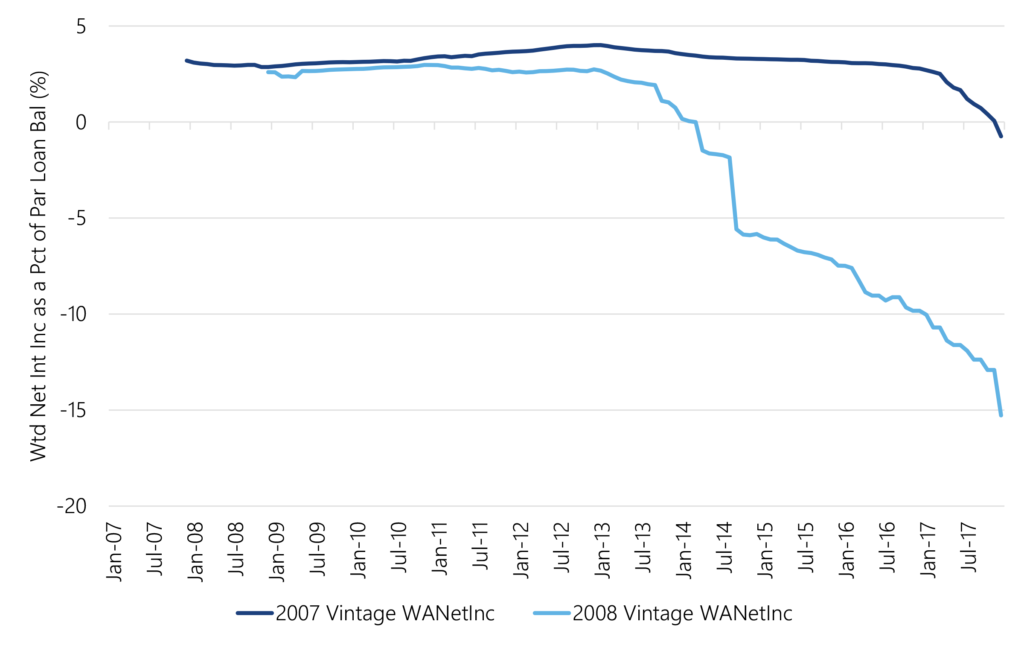
Note: The data show quarterly average net interest income as a percent of par loan balance weighted by loan balance across deals in each vintage. Net interest income for each deal was calculated as (WAS x Par Loan Balance) – (WACC x Par Debt Balance). The mix of deals in each vintage will change as deal debt pays down and each CLO completes. Source: Intex, Santander US Capital Markets
Every CLO deal begins paying off its debt starting with the least expensive ‘AAA’ class and proceeds sequentially until it pays off the lowest rated and most expensive class. Extinguishing debt in that order slowly raises the weighted cost of debt and narrows the spread between loans and debt. Residual interest cash flow to equity begins to fall. Managers’ span to trade the loan portfolio often narrows after reinvestment ends, potentially making it harder to trade out of troubled loans. If equity directs, managers can call or refinance debt to lower interest expenses. Deals with healthy portfolios have strong incentives to call or refinance debt as the interest spread between loans and debt falls below levels that provide adequate distributions to equity. Over time, the only deals remaining in most vintages are ones with troubled portfolios, so the net spread in the vintage continues to decline. Or if the portfolios have lots of defaulted loans, net spread goes negative. The final phase of retiring debt and unwinding assets consequently is critical to final IRR.
The track record of CLO equity by vintage shows it clearly depends on circumstances that unfold after issuance and that are largely beyond the control of the CLO manager. The average cost of debt and average reinvestment opportunity for a particular vintage make up a core part of the systematic risk or beta of CLO equity. But managers that can extract excess return from a loan portfolio or find ways to reduce the cost of debt can add return to equity. Some managers seem more effective at raising the spread on loans and lowering the cost of debt, arguably the most important job for generating equity return.
A lot depends on debt structure
Leverage
Deal leverage also varies over time, contributing to differences in IRR across vintages. But leverage varies as well as from deal to deal within a vintage, reflecting the effect of the CLO manager, of CLO equity or both on deal structure. All else equal, the same cash flow to a deal with more debt and a smaller equity class generates a higher return on equity. All else may not be equal, of course, since more leverage often means a more volatile equity NAV and a higher cost of funds.
The ratio of par debt issued to par loan balance on each deal’s effective date is highest in pre-2008 vintages, drops after the 2008 financial crisis and rises in later years (Exhibit 5.7). Within vintages, deals in the lowest third of leverage tended to have the lowest IRR, and deals in the middle and top third had progressively higher IRR.
Exhibit 5.7: A shift to lower leverage after 2008 contributed to lower median IRR
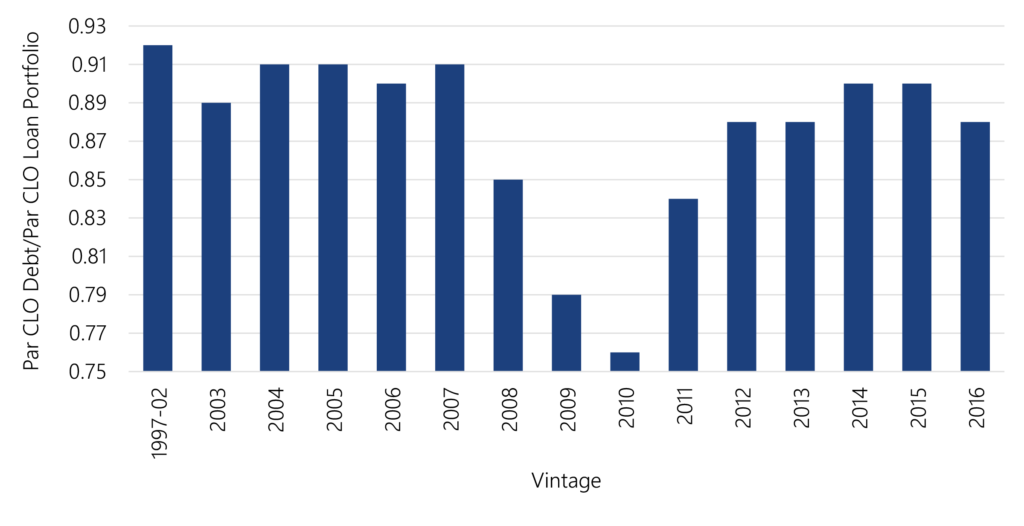
Note: Leverage measured Total Debt Issued/Par Collateral Balance on deal effective date. WA Leverage is Initial Leverage weighted by Initial Par Loan Balance on effective date. WA IRR is IRR weighted by par equity on effective date. Underlying data for this chart available in the data appendix. Source: Intex, Santander US Capital Markets
Callability and reinvestment period
Other aspects of CLO structure affect manager flexibility, including the length of the non-call period. A short non-call period gives the manager the most opportunity to refinance outstanding debt and lower the cost of funds. But options do not come free. Investors will charge a manager for shorter non-call periods and the flexibility that comes with that, all else equal, by charging a higher cost of funds. CLO equity with shorter non-call periods should underperform in markets with widening spreads since the initial cost of funds is higher and opportunities to refinance come along late or not at all. In markets with tightening spreads, equity with shorter non-call periods should outperform by refinancing more quickly and lowering the cost of funds. In fact, that pattern shows up clearly after dividing CLOs in each vintage into deals with non-call periods above and below the vintage median (Exhibit 5.8). From 2002 to 2008, when loan spreads after CLO pricing generally ran flat-to-wider, equity with shorter non-call periods underperformed in six out of seven vintages. But from 2010 to 2016, when loan spreads generally tightened, equity with shorter non-call periods outperformed in six out of seven vintages.
Exhibit 5.8: Equity funded by shorter NC debt underperforms in widening markets and outperforms in tightening markets
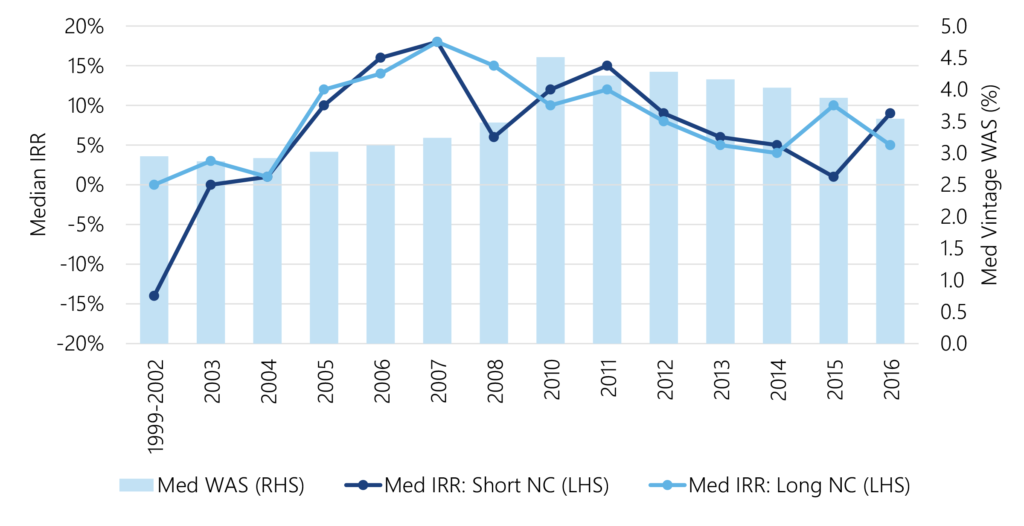
Note: WA noncall is the non-call period in years weighted by the par balance of deal equity on its effective date. WA IRR is the IRR weighted by deal equity on its effective date. Shorter noncall means deals below the median for each vintage, longer noncall means deals above the median. Underlying data for this chart available in the data appendix. Source: Intex, Santander US Capital Markets
The length of the CLO reinvestment periods matters, too. A long reinvestment period gives equity the best opportunity not just to capture net interest income and amortize any fixed expenses but, more importantly, to work out of any problem loans. Debt investors, however, will charge for long reinvestment periods because the range of possible credit outcomes broadens over time. CLO equity with longer reinvestment periods should outperform in markets where widening loan spreads and fixed debt spreads allow capture of more net interest income. Equity with longer reinvestment periods should underperform in markets with tightening spreads since the higher cost of debt cuts into net interest income. Splitting CLOs in each vintage into deals with reinvestment periods above and below the vintage median shows the pattern (Exhibit 5.9). As spreads ran flat-to-wider from 2002 to 2008, equity with longer reinvestment outperformed in six out of seven vintages. As spreads tightened from 2010 to 2016, longer reinvestment underperformed in four out of seven vintages.
Exhibit 5.9: IRR tends to rise within vintage from shorter reinvestment to longer
Note: WA reinvestment is the reinvestment period in years weighted by the par balance of deal equity on its effective date. WA IRR is the IRR weighted by deal equity on its effective date. Shorter reinvestment means deals below the median for each vintage, longer reinvestment means deals above the median. Underlying data for this chart available in the data appendix. Source: Intex, Santander US Capital Markets
The length of the non-call and reinvestment periods are highly correlated in practice. In this study, the correlation between length of the non-call and the reinvestment period is 0.68. Issuers tend to offer short non-call periods with short reinvestment periods, and long non-call periods with long reinvestment periods. That limits the ability to see the true market price for independent non-call and reinvestment periods and the ability to tease out the separate effects on equity IRR.
A lot depends on the manager
Variability within vintage points to manager influence
The variability in equity IRR within vintages is large enough to suggest that actions of managers affect performance. In the APS analysis, the 75th percentile of IRR weighted by number of completed deals delivers 15.5% while the 25th percentile delivers 4.9%. In the CRS analysis, the 75th percentile of IRR delivers 15.6% while the 25th percentile delivers 6.5%. In both analyses, the difference is material. Variability of IRR was muted through 2007 but picked up through the volatile markets immediately after the 2008 financial crisis and again through the 2016 oil crash (Exhibit 5.10). Volatile markets are more likely to test managers’ ability to adapt their portfolios.
Exhibit 5.10: IRR varies within vintage, with variability rising in 2008 and afterwards
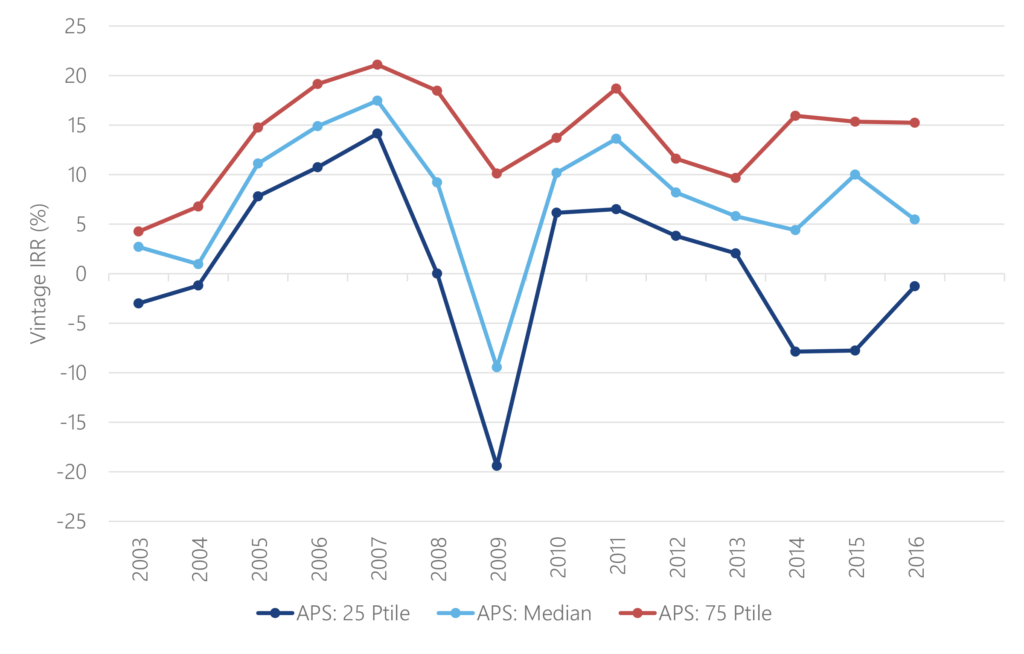
Note: Underlying data for this chart is available in the data appendix. Source: Intex, Santander US Capital Markets
Persistence in manager performance
If managers influence equity IRR and if the influence is consistent, then a relatively stable set of managers with highly ranked deals in one vintage should have highly ranked deals in later vintages, and managers with poorly ranked deals should repeat their poor ranking later. That’s broadly what the data show.
Deals completed through June 2020 included ones managed by 151 unique managers. Of those, 102 issued more than one deal (Exhibit 5.11). For managers with more than one deal, pairing each deal with the deal that followed lays the groundwork for looking at IRR stability. The manager’s first deal might be paired with the second, and the second with the third and so on. Each deal IRR also ranks somewhere within its issuance vintage. Dividing each vintage into thirds—the top tercile, the middle tercile and the bottom tercile—allows an analysis of whether a manager’s deal in one tercile is followed by a deal also in the same tercile, or whether the following deal ranking is effectively random.
Exhibit 5.11: Distribution of managers by number of completed deals
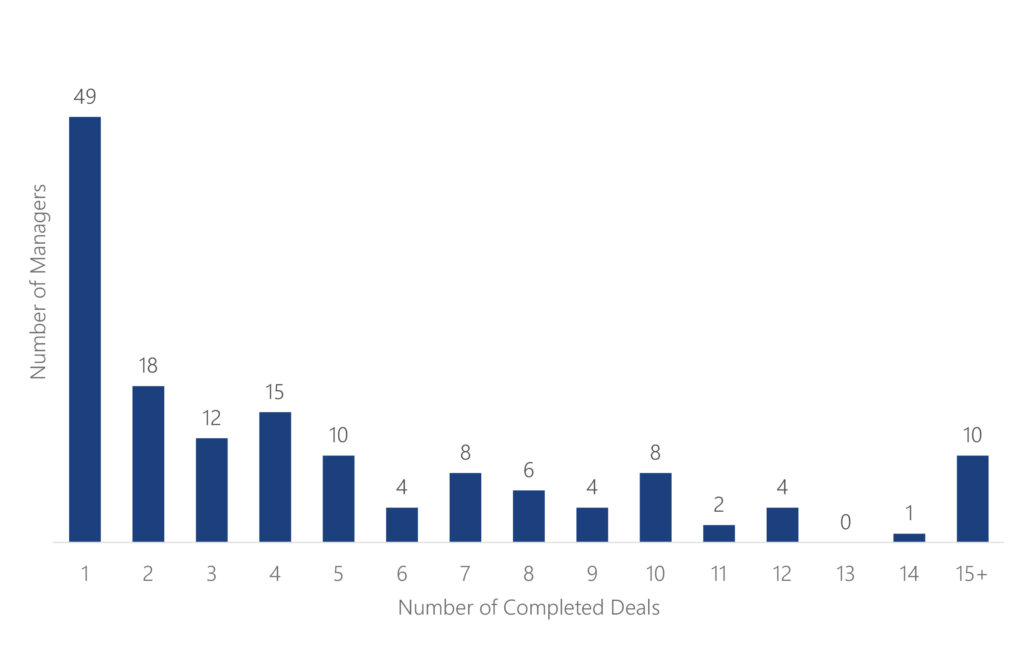
Source: Santander US Capital Markets
Analysis of persistence in manager IRR does show that managers with a deal in the top, middle or bottom third of vintage IRR tend to have a following deal that also performs in the same tercile of its vintage. For example, of the 219 deals in the top third of its vintage, 107 or roughly half were followed by another deal also in the top third of its vintage (Exhibit 5.12). Of the 215 deals in the middle tercile of its vintage, 84 followed with another deal in the middle tercile. And of the 208 deals in the bottom third of its vintage, 93 were followed by another deal also in the bottom third.
Exhibit 5.12: Managers with an initial deal in one IRR ranking category tend to follow with another deal in the same category
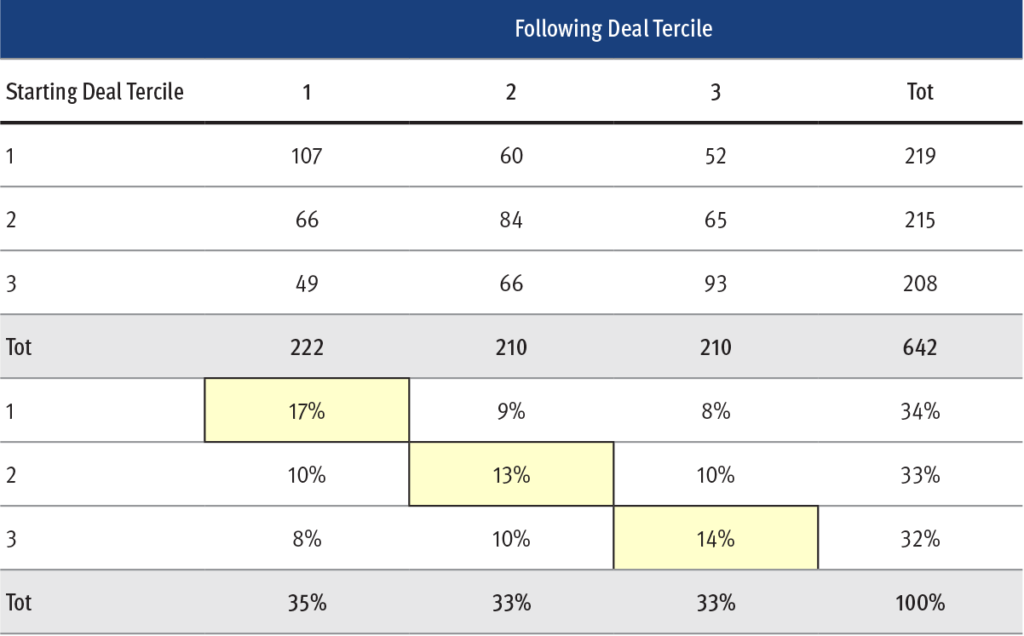
Note: Chi-square value: 40.71, p-value < 0.001, degrees of freedom = 4. Source: Santander US Capital Markets.
There is a clear case for persistence of manager effect on IRR at least over closely paired deals. Each deal is the repetition of an experiment where the manager launches a new CLO. Relatively stronger and weaker performances tend to repeat themselves. Although CRS looks for persistence in performance relative to equity markets and not based on IRR, this evidence of persistence is similar to the CRS results.
Channels for manager influence
Managers may be able to influence the spread on portfolio loans, the cost of debt, the amount of leverage and the length of the non-call and reinvestment periods. But these features could equally reflect market conditions. Separating the influence of manager and market is hard. In other areas, the differences arguably are clearer.
Extracting excess return from the loan portfolio
Investment performance on any CLO loan portfolio also reflects both manager and market. Since the debut of the capital asset pricing model in the 1960s, investors have routinely used performance benchmarking to measure manager and market contributions in mutual funds, hedge funds, private equity and other asset classes. The method applies well to CLOs.
The simplest benchmarking of an investment portfolio compares its periodic total returns to a market index. Here is where CLOs have a distinct advantage over other structured products backed by loans or other assets that rarely or never trade. The leveraged loan market provides regular market pricing, and that pricing and regular loan cash flow mean each CLO loan portfolio produces a history of periodic total return. The Morningstar/LSTA Leveraged Loan Total Return Index tracks performance in the broad market for leveraged loans and offers a natural benchmark for CLO loan managers.
For all current or completed CLO loan portfolios with sufficient data, which would include all deals in this study, Amherst Pierpont regularly calculates measures of manager and market performance:
- Alpha, or excess return: the average monthly return on a CLO portfolio above or below the return on the Morningstar/LSTA Leveraged Loan Total Return Index; alpha tries to isolate the manager contribution to performance
- Information ratio, or the stability of alpha. A high information ratio indicates stable or reliable excess return, and a low information ratio indicates volatile or unreliable excess return. This distinguishes between portfolios, for example, that both deliver 120 bp of excess return in a year with one portfolio delivering 10 bp a month and the other delivering 120 bp in January and 0 bp thereafter. The first portfolio would have a high information ratio, the second would have a low one
- Beta, or the riskiness of the CLO portfolio relative to the index. A beta of 1.0 means the portfolio on average matches the Morningstar/LSTA Total Return Index and reflects the same risk, a beta greater than 1.0 means more systematic risk and a beta less than 1.0 means less systematic risk
Positive alpha should contribute to equity returns by making more interest cash flow, more price return or both available to equity. A positive information ratio does the same and arguably reflects more sustainable manager advantage in delivering excess return. Alpha and information ratio offer direct measures of a manager’s ability to enhance equity by extracting excess return from the CLO loan portfolio. Splitting each vintage into deals with alpha above and below the vintage median shows high alpha deals with a better IRR in nine out of 14 vintages, with the advantage after 2008 very strong (Exhibit 5.13). The pattern is similar for information ratio. Of course, the limited number of vintages makes the pattern suggestive but not conclusive.
Exhibit 5.13: Deals with a higher alpha show higher IRR especially after 2008
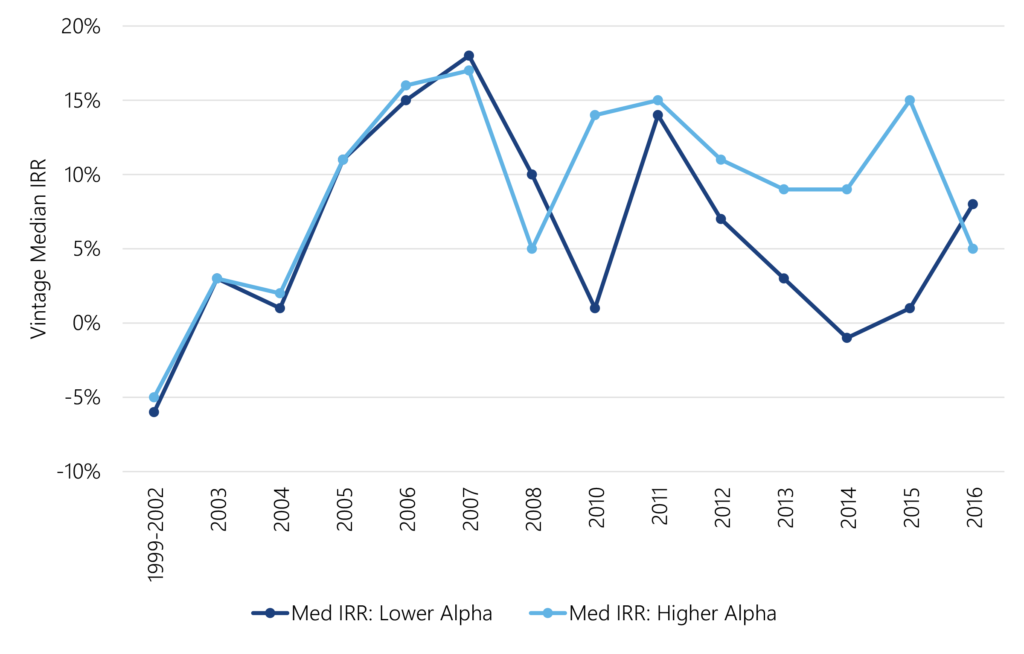
Note: Underlying data for this chart is available in the data appendix. Source: Intex, Santander US Capital Markets
Beta is a measure of market risk, and although riskier portfolios generally produce higher returns, debt investors generally charge a higher cost of funds for those portfolios. With the potential for cost of funds to vary with beta, the net benefit to equity is unclear. A manager needs to do more than just take on systemic risk; a manager needs to add excess return, especially reliable excess return.
Avoiding CLO disasters
Managers can also have a more directly measurable effect on equity by avoiding breaches of coverage tests and other features of CLO structure that divert cash flow away from equity. If these tests are breached, managers help equity by fixing the problems quickly. Deals that spend less time in breach should show higher return on equity. The importance of limiting time in breach of overcollateralization tests, which cut off cash flow to equity, shows up clearly by splitting each vintage of completed CLOs into deals above and below the median time in breach (Exhibit 5.14). In 12 out of the 14 vintages studied, deals below the median showed a higher equity IRR than deals above the median.
Exhibit 5.14: Deals that spend less time in breach of OC tests show higher IRR
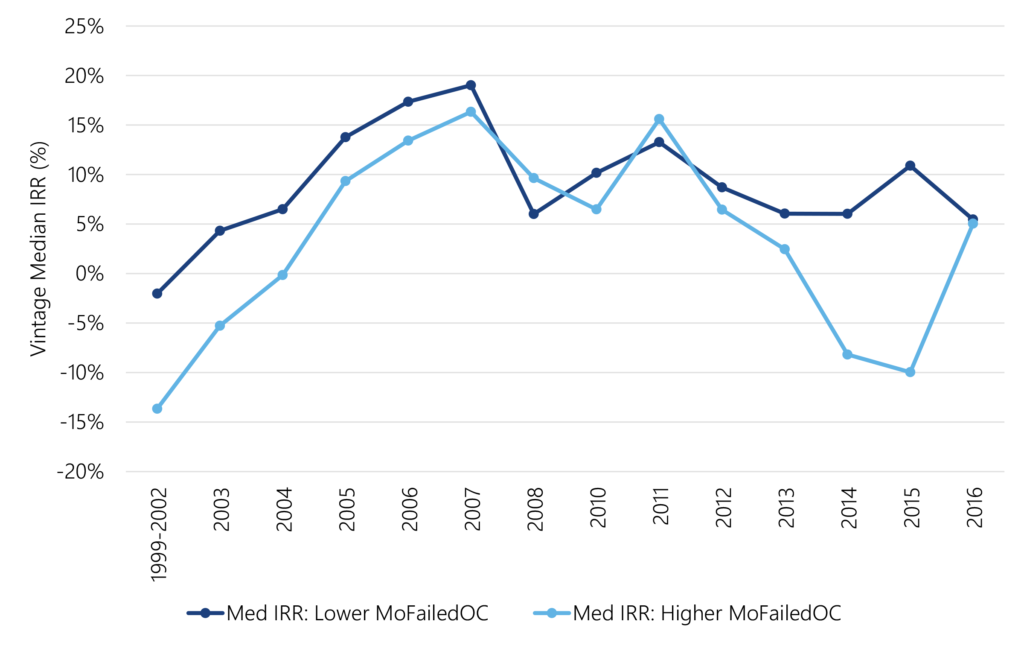
Note: Underlying data for this chart is available in the data appendix. Source: Intex, Santander US Capital Markets
Managing the debt
Managers can also influence equity return by lowering the cost of debt, and one important way to do that is to make low-cost ‘AAA’ debt as high a proportion of total debt as possible. Deals that have the highest share of debt rated ‘AAA’ should show higher equity returns.
Measuring influences on CLO equity IRR: a statistical model
With all the factors that could shape CLO equity performance, understanding ability to predict return and relative impact is important for evaluating new investments. This study ran a series of standard ordinary-least-squares regressions to estimate impact on IRR (Exhibit 5.15). The regressions confirm a number of key observations:
- Annual vintage alone explains the largest part of equity IRR, highlighting the importance of market conditions and systemic risks that unfold after issuance.
- The weighted average spread on the CLO loan portfolio along with weighted average cost of capital and initial leverage explain the next largest part of equity IRR. As expected in any leveraged spread portfolio, more spread, a lower cost of capital and more leverage add to IRR.
- The initial non-call period and initial reinvestment period add to IRR as they get longer, a counterintuitive result for non-call. But the impact of these features depends on subsequent market conditions, and these features are closely correlated, complicating OLS estimates of significance and magnitude.
- Consistent excess performance on the loan portfolio as measured by information ratio is a highly significant and large contributor to equity IRR, while loan portfolio beta is not. As expected, consistent portfolio alpha is valuable, while simply taking systematic risk is not.
- A manager’s timeline for curing failed interest diversion, overcollateralization and interest coverage tests also drive IRR. Time to cure overcollateralization tests come out between two times and four times as important as the others, while the results for curing interest coverage tests are also only marginally significant and counterintuitive, suggesting a longer period adds to IRR
- Raising the ‘AAA’ percentage of a deal also shows a significant effect, but the negative coefficient is unexpected, suggesting a higher share of ‘AAA’ reduces IRR. The correlation of this measure with overall leverage may be affecting the sign of the coefficient.
- Adding a set of fixed effects for the 151 unique managers in the study adds another significant increment of explanatory power, with the adjusted r-squared rising from 0.382 to 0.457. The fixed effects also reduce the significance of other levers that managers can pull including the non-call and reinvestment periods and, most importantly, the information ratio. This suggests that managers affect equity IRR through these and other channels.
Exhibit 5.15: OLS regressions of CLO equity IRR on key variables
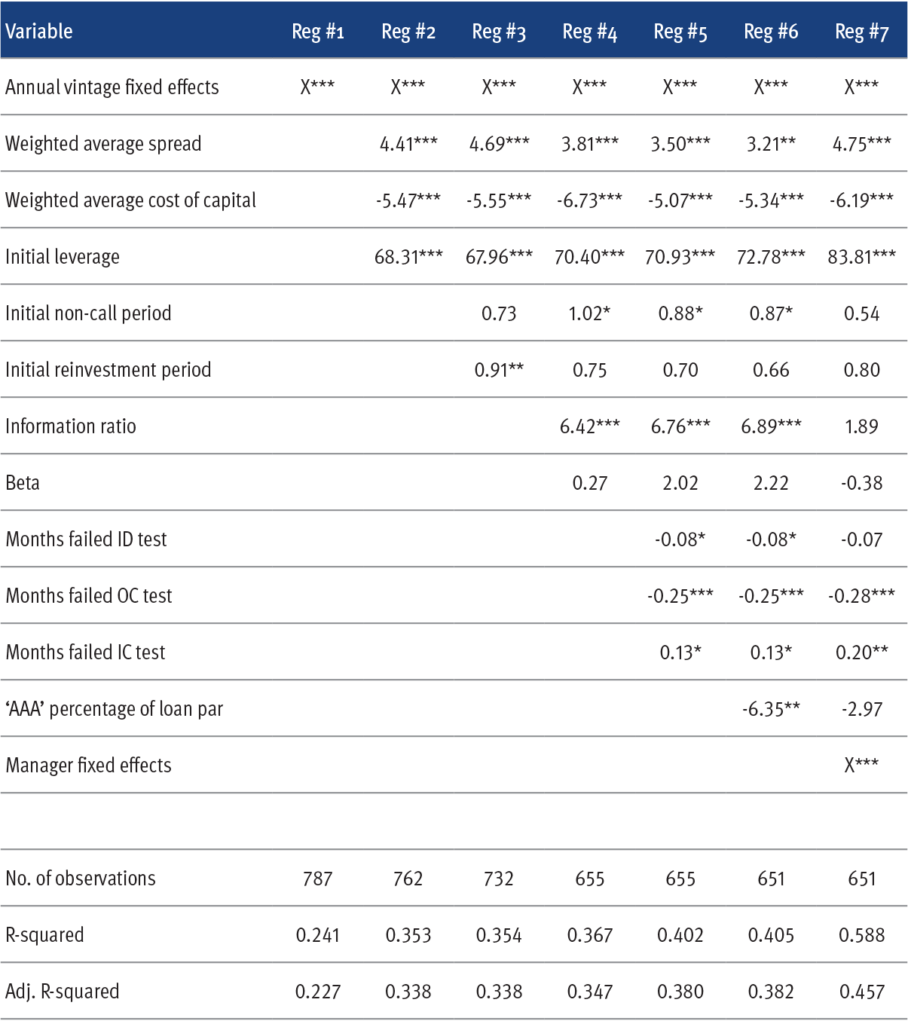
Note: ***, ** and * denote p-values less than 0.01, 0.05 and 0.10 respectively. Source: Santander US Capital Markets.
The impact of each variable becomes clearer by comparing equally likely moves. A one standard deviation drop in the weighted average cost of capital lifts expected IRR by 3.90% (Exhibit 5.16). A one standard deviation rise in leverage improves expected IRR by 3.55%. A similarly likely drop in months of failed overcollateralization testing raises IRR by an expected 2.75%. A one standard deviation rise in weighted average spread raises IRR by 2.52%. And a similarly likely rise in information ratio lifts expected IRR by 1.96%. Other modeled features of CLO or manager performance have smaller effects.
Exhibit 5.16: The impact on equity IRR from equally likely moves in key variables
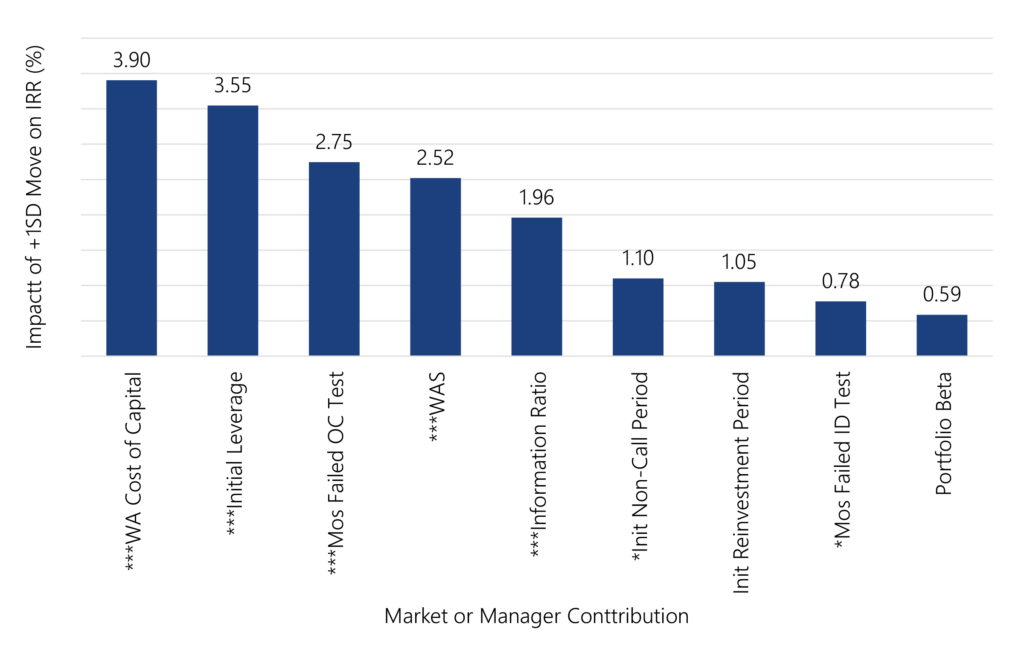
Note: Data shows impact on IRR from a move of one standard deviation in each variable in a direction that enhances IRR. For variables with a positive coefficient, it is +1SD, or variables with a negative coefficient, it is -1SD. ***, ** and * denote p-values less than 0.001, 0.0 and 0.10 respectively. Estimates based on Regression #5. Source: Santander US Capital Markets.
Expectations for CLO equity return
CLO equity returns have varied significantly over time and within different vintages. Equity has outperformed broad market benchmarks, according to work by CRS, largely because managers take on relatively risky loans and fund with relatively safe debt. CRS finds that managers make a difference in CLO equity return relative to market benchmarks, and differences between managers can persist. But CRS leaves room to explore the details of manager influence on equity returns.
Work at Amherst Pierpont replicates CRS findings of significant differences in equity performance over time and extends the finding of persistent manager differences in benchmark performance to find persistent differences in equity IRR. The Amherst Pierpont work also explores specific ways managers influence equity performance through loan spread, debt cost, non-call and reinvestment structure, excess performance on loan portfolios and efforts to avoid and cure failures of difference CLO coverage tests.
CLO equity has enough of a track record for investors to start forming clear expectations of potential return. Market conditions after issuance play an important part, but the manager’s influence on loan spread, debt cost, leverage, portfolio performance and key CLO tests also make material differences. Investors can also explore the IRR impact from the interaction between non-call and reinvestment periods and future expected loan and debt spreads. Investors can still project CLO equity IRR through standard projections of cash flows, defaults and recoveries, although those projections may not capture a manager’s track record of excess return or the manager’s effectiveness at avoiding or curing coverage failures, and these projections may not shed light on the influence of non-call and reinvestment periods. Historical estimates of these relationships offer another window on returns in the asset class and the differences in those returns across managers.
A special thanks to Jinzhao Wang for invaluable assistance in preparing the data presented in this chapter and conducting the analysis.
< Previous Next >
For a print copy of the book, A Quick Guide to CLO Debt and Equity, please contact your Santander Sales Representative.