


Chapter II
The Basics of CLO Structure
CLOs take a portfolio of leveraged loans and create classes of risk to fit the preferences of different investors. Some classes magnify or leverage the credit risk of the portfolio and pay higher rates of interest than the underlying loans, and other classes reduce or deleverage the credit risk and pay lower rates. The portfolio on its own might not fit all the investors well. But by placing different classes of risk in hands best able to bear it, CLOs broaden the audience of investors able to take leveraged loan exposure and bring more capital to the market. The different classes of risk come from a few key features of a CLO:
- Structural credit enhancements
- Limits on loan portfolio quality, and
- The CLO lifecycle
Most of the features of US CLOs apply to European CLOs, too, although the focus here will fall only on the US.
Structural credit enhancements
CLOs use structural credit enhancements or rules for allocating cash flows to create senior classes that get paid principal and interest first and junior classes that get paid last. Compared to the underlying portfolio of loans, credit risk gets reduced or deleveraged in the senior classes and magnified or leveraged in the junior classes. If loans default, junior classes may not get paid at all. These cash flow rules fall into a pair of distinct categories:
- Rules creating structural subordination, where senior classes get cash flow first and junior classes bear the risk of a shortfall in principal, interest or both; and
- Rules creating collateral performance tests, where deterioration of loan credit triggers diversion of cash flow to senior classes from junior classes.
Subordination creates classes with a senior claim on principal and interest, which means other classes have a junior claim. If defaults create principal or interest shortfalls, the deal pays senior classes out of available cash flow first and junior classes bear the shortfall.
Based on rating agency expectations for CLO loan portfolio losses through stress scenarios, the size of different CLO classes leads to different ratings. For example, a CLO might have an equity class that absorbs the first 11.3% of principal losses, a ‘BB’ class that absorbs the next 3.4%, a ‘BBB’ class that absorbs the next 5.7%, a ‘A’ class that absorbs the next 7.2%, a ‘AA’ class that absorbs the next 9.2% and a ‘AAA’ class that absorbs any losses beyond that (Exhibit 2.1). Each class is protected by the ones subordinate to it. The ‘AAA’ class, for example, is protected by 37% of subordination.
Exhibit 2.1: Subordination structure for a typical CLO

Note: Display shows class rating and class share of total funding structure. Based on Wellfleet CLO 2022-2 as of 8/12/2022. Source: LCD, Santander US Capital Markets.
The risk of principal loss depends on both defaults and the amount of principal recovered after default. Defaults and losses historically have come in below levels needed to lose principal in most rated classes of CLOs. After the bursting of the Internet bubble in the early 2000s, rolling 12-month defaults peaked in June 2000 at 7.41%, below levels needed to hit the principal of a typical ‘BB’ class even assuming no recoveries (Exhibit 2.2). After the Global Financial Crisis of 2008, defaults peaked in November 2009 at 10.81%, again below levels needed to hit typical ‘BB’ principal even assuming no recoveries. Of course, CLO classes remain outstanding for years, and defaults below levels needed to breach class principal in any one year could still build up over many years and breach a class. Each CLO loan portfolio also ends up with its own history of defaults and losses. Defaults and losses come in above average in some deals and below average in others. That leaves open the possibility of loss in any particular deal.
Exhibit 2.2: Rolling 12-month loan defaults historically have come in below CLO subordination levels

Note: Default rates reflect the sum of all defaulted amounts in the prior 12 months divided by the amount of performing loans outstanding 12 months ago. Source: LCD, ASantander US Capital Markets
Subordination and ratings, as in any similar securitization, should align with the probability of losing a dollar of principal in a given class over the long run. The equity class of any securitization typically is expected to lose most if not all principal in an average economy, so it needs a high coupon or high rate of distribution to make up for the expected loss. Speculative grade classes should expect to take losses in slightly or moderately weak economies. And investment grade classes should expect to take losses in very weak economies, or, in the case of ‘AAA’ classes, only in the event of catastrophe.
CLO collateral performance tests create further protection for senior classes. CLOs include a few key tests:
- Par overcollateralization or OC tests
- Interest coverage tests
- Interest diversion tests
- Event-of-default tests
Par overcollateralization tests
All CLOs have par overcollateralization tests. The tests try to ensure a deal has enough par loan balance to repay debt. A CLO will count par value based on the face amount of each loan, at least if the CLO bought the loan above a specified price, say $80. The tests look at the ratio of par loan balance to the par balance of each debt class and the classes senior to it. For example, take a deal with a $500.95 million par loan portfolio. A ‘AAA’ class with $316.25 million par value would have a ratio of ($500.25/$316.25) or 158%. A ‘AA’ class with $46.25 million par value would have a ratio of ($500.25/($316.25 + 46.25)) or 138%. Each class would have a progressively lower par OC ratio (Exhibit 2.3). Each class except the ‘AAA’ also has a trigger ratio where a drop in the par value of the portfolio would drag the ratio below the trigger and divert cash from the classes below it.
Exhibit 2.3: Calculating CLO overcollateralization tests

Note: All numbers $million unless otherwise noted. Source: Santander US Capital Markets
A deal will fail a par overcollateralization or OC test whenever a combination of several types of troubled assets exceeds a trigger value. That combination usually includes the following:
- Trading losses
- ‘CCC’ assets
- Discount purchases, or loans purchased below a certain price, such ‘B-‘ loans below $80
- Defaulted assets
Trading losses reduce deal par value directly, but the deal also will haircut or lower the presumed par value of these other categories of loans and reduce the par value of the CLO loan portfolio. As par loan values fall, par OC tests begin to fail. The presumed reductions in par value of these particular types of assets works as follows:
- ‘CCC’ assets. These assets reduce deal par value when the total amount exceeds a limit, usually 7.5%. When that happens, the deal rules then sort the ‘CCC’ assets from highest market price to lowest (Exhibit 2.4). The rules then begin adding the cumulative par value of the ‘CCC’ loans, going from highest price to lowest, until the tally hits the usual 7.5% limit. For all principal beyond that limit, the rules cut the par value from the face amount of the loan to the market value. If the first loan beyond the 7.5% limit trades at $70, for example, the rules will cut its counted par value from $100 to $70. The more loans above the usual 7.5% limit and the lower their price, the bigger the hit to deal par value.
Exhibit 2.4: Example of a reduction in deal par from holding more than 7.5% ‘CCC’ assets

Note: All $ in millions. Source: Santander US Capital Markets
- Discount purchases. CLOs carry most assets at par if the manager buys them above a specified price, such as $80. That applies even if the manager buys a loan above $80 and the price drops afterwards. But if the manager buys assets below $80, the deal only gets credit for the initial market value of the loan, not the par value. The deal continues to carry the loan at initial market value until it trades above a trigger price, such as $90, for some minimum amount of time, perhaps a month. At that point, the deal counts the par value of the loan and continues to count the par value no matter what the price does afterwards.
- Defaulted assets. For defaulted assets, a deal carries them at the lower of recovery value or market price. Recovery value for a loan is set by a rating agency based on loan collateral, issuer rating and other factors. For example, a $100 loan might trade at $65 but have an estimated recovery value of $45. In that case, the asset gets counted as $45 for par OC tests.
A deal will only haircut the par balance of a loan for failing one test, even if the loan fails more than one. A ‘CCC’ loan purchased at a discount that defaults, for example, only gets haircut once rather than three times.
A par OC test will take ‘CCC’ assets, discount purchases and defaults into account to calculate an adjusted par balance. For example, a par balance of $500.25 million would drop by $9.51 million for breaching ‘CCC’ limits, $4.77 million for discount obligations and $4.62 million for defaulted assets (Exhibit 2.5):
Exhibit 2.5: An example of adjusting a deal par balance

Source: Santander US Capital Markets
Finally, the deal would use the adjusted par balance to run the OC tests again. Returning to the earlier example, the original par balance of $500.25 gets replaced by the adjusted balance of $481.35 (Exhibit 2.5.A). All the OC ratios fall, but the ratio on the ‘BB’ class falls below the trigger and the test fails.
Exhibit 2.5.A: An example of a deal failing a ‘BB’ OC test

Source: Santander US Capital Markets
A failed OC test diverts principal and interest from equity and junior notes to senior notes until the test cures. The cure usually comes by paying down the principal balance of the senior notes until the ratio of adjusted par loan balance to debt passes the par OC test. Note that the OC test hinges on the ratio of debt balance to adjusted collateral balance, and this approach cures the test by making the debt balance smaller.
Of course, the test could also cure if ‘CCC’ loans get upgraded, if discount obligations get reclassified, if defaulted loans reperform or if the CLO manager trades to build par—for example, by selling a loan near par to buy a larger notional amount of one moderately below par, a trade that would lift the par balance of the deal. These solutions work by lifting the adjusted collateral balance.
Interest coverage tests
Interest coverage tests try to ensure a CLO has enough interest to cover the interest expense of each debt class and the classes senior to it. This could happen, for example, if interest rates dropped dramatically and a CLO had invested heavily in loans indexed to 1-month SOFR while paying debt indexed off 3-month SOFR. If scheduled interest from the loan portfolio is less than the scheduled interest on a target debt class and the classes senior to it, the rules divert principal and interest from junior classes. Interest gets diverted first to pay senior principal and interest, unpaid or deferred interest and so on until the test cures. Principal gets diverted next to pay senior principal and interest, unpaid or deferred interest and so on until the test cures. The cure again comes from paying down the principal balance of senior notes.
Interest diversion tests
Interest diversion tests come in as another form of structural protection designed to make sure the deal has enough par loan balance to repay debt. These tests only apply during the reinvestment period. Interest diversion tests also calculate a par value on the loan portfolio adjusted for ‘CCC’ loans, discount purchases and defaulted assets. The test is usually set at the same debt class as the lowest OC test but with a higher trigger. The interest rate diversion test should trip before the par OC test. Deals that include a ‘B’ class often set the interest diversion test at that level, although a ‘B’ class rarely if ever has an overcollateralization test. Instead of diverting principal and interest to pay down senior classes, however, the rules divert cash flow to buy more assets. The test cures by raising the par balance of the loan portfolio rather than paying down the par balance of debt. These rules also typically divert only a portion of the cash flow due to equity, say 50%, rather than all cash flows.
Note that interest diversion also hinges on the ratio of debt balance to adjusted collateral balance but cures the test by making the collateral balance larger.
Event-of-default tests
Finally, event-of-default tests stand as the last bulwark against losses in the ‘AAA’ class. If the adjusted par balance of deal collateral drops below 102.5% of the par balance of the ‘AAA’ class, the deal liquidates and pays off ‘AAA’ principal.
Limits on loan portfolio quality
Beyond subordination and collateral performance tests, CLOs also put guardrails on the composition of the loan portfolio to ensure the manager stays within reasonable risk limits. If a deal goes outside these limits, the manager can only trade to maintain or improve the portfolio and cure the breach. CLO managers must comply with a pair of limits during active management of the portfolio:
- Concentration limits
- Portfolio quality tests
Concentration limits, as the name suggests, limits portfolio exposure to specific types of risks such as junior rather than senior liens, exposure to a single loan issuer, exposure to ‘CCC’ and fixed-rate loans, certain industries and so on (Exhibit 2.6). After all, the strength of CLO credit rests on the diversification of risks within the portfolio. Concentration limits try to ensure diversification throughout active management.
Exhibit 2.6: Common CLO concentration limits

Source: Santander US Capital Markets
Portfolio quality tests are negotiated between the manager, equity and debt and evaluated by the rating agencies. They keep portfolio quality within a set of boundaries set by spread, rating factor, diversity score and so on:
- Minimum floating spread test. Floating assets need a minimum margin over the index.
- Minimum weighted average coupon test. Fixed-rate assets need a minimum coupon.
- Maximum Moody’s rating factor test. Portfolio WARF should fall below the test limit.
- Moody’s diversity score test. Portfolio diversity score should exceed the test limit.
- Minimum weighted average Moody’s recovery rate test. Recovery should exceed the test.
- Weighted average life test. Portfolio WAL should fall below the test limit.
Rules for structural subordination and collateral performance tests come out of discussions heavily influenced by the investor holding a controlling share of CLO equity, by credit rating agencies paid to rate all or parts of the deal—primarily Moody’s, Standard & Poor’s and Fitch with ratings coming, too, from DBRS Morningstar and Egan-Jones—and by the lead debt investor, which is often the largest investor in the ‘AAA’ class. In fact, many investors in investment grade classes require ratings from a major agency before investing. These major parties, advised by the CLO manager and the investment bank arranging the deal, come to consensus about the specifics of each deal.
The CLO lifecycle
A CLO goes through a distinct lifecycle starting before it comes to market and ending with final maturity. CLO risk and return changes through this lifecycle (Exhibit 2.7).
Exhibit 2.7: The main phases of a CLO lifecycle

Source: Santander US Capital Markets
The warehouse
CLO managers typically need time to build a diversified loan portfolio before issuing debt, and that is where a loan warehouse comes in. The manager along with one or more equity investors will approach lenders willing to finance the accumulation of loans. One lender usually provides all the financing. Warehouse financing typically runs for up to 12 months followed by another 12 months for amortization. But some warehouses have terms as short as six months and others have evergreen terms that renew automatically every few months until the lender gives notice. The manager has incentives build a portfolio efficiently because the lender often charges fees for minimum use of committed funds, ongoing use and administration of the warehouse. The funds typically cover 80% of the value of the loan portfolio—an 80% advance rate or, alternatively, a 20% haircut—and the manager pays a floating rate of interest on the debt at roughly the rate on a ‘AAA’ CLO.
The manager begins to buy loans using equity and warehouse funding while working with rating agencies and investment banks to issue a CLO. At some point, the manager and equity investor decide they can issue debt with spreads and terms that offer sufficient potential flexibility and return on equity. The manager will then price a deal, finalizing the coupons and terms on debt. A few weeks later, the CLO closing date arrives when the warehouse transfers loans to a trust, investors get debt and interest starts to accrue.
Market conditions can deteriorate after a warehouse launches, of course, and the manager can end up still in the warehouse as the end of the term approaches. Lenders rarely force warehouse portfolios to liquidate but instead ask the manager to put up more equity or steadily repay or amortize the loan. This raises the cost of staying in the warehouse and can give equity or debt investors leverage to negotiate better terms or to reduced manager fees, and it can also trigger sale of loans or have other effects.
The ramp-up
A CLO deal typically gets priced and closes without having the final portfolio in place, and the manager can take months after the closing date to finish the job. The manager pays off the warehouse funding with some of the proceeds from issuing debt and uses the rest of the proceeds to buy the balance of the portfolio in the primary and secondary loan market. The manager has incentive to ramp up quickly to cover the cost of the newly outstanding debt. The longer the manager sits in cash, the greater the drag on equity returns. When the portfolio balance hits the targeted deal size, the ramp-up ends and the CLO effective date arrives. As a practical matter, the portfolio also has to hit promised targets for WAS, WARF, diversity score, loan recovery and concentration limits, too, or else the rating agencies will not rate the debt.
Managers sometimes try to take advantage of attractive economics in the CLO market—wide spreads on loans, tighter spreads on debt or both—and price and issue debt without a warehouse and immediately start to ramp up their portfolio. This puts pressure on the manager to build the portfolio quickly. This approach is often called “print and sprint.”
Reinvestment
Generally after the ramp-up ends and with the targeted portfolio in place, reinvestment begins. Reinvestment usually lasts five years, although the term can vary. During reinvestment, the loan portfolio pays principal and interest, and the cash flows get distributed to CLO debt and equity according to the rules that create subordination, collateral performance and collateral quality tests. Within these rules, the manager has wide discretion. The manager usually reinvests any maturing or repaid principal to keep the portfolio balance steady. The manager can also actively buy and sell loans during reinvestment. In some cases, the deal can pay or “flush” trading gains to the equity class. Equity naturally welcomes these payments while debt investors would rather keep them in the deal as collateral.
The longer the reinvestment period, the wider the spread on the CLO debt. The wider spread reflects the possibility that credit on the loan portfolio, spreads on CLO debt or both could drift away from their starting point when the deal is issued. The longer the reinvestment period, the further conditions might drift. The broadening range of possible states of the world increases the chance of credit problems in the loan portfolio and the chance of triggering another important feature of a CLO lifecycle—the ability to call or refinance the CLO debt.
The non-call period, debt refinancing and deal resets
CLOs allow the calling or refinancing of CLO debt. Since CLO debt usually pays a floating rate of interest, the call is triggered not by a change in interest rates but by a change in spread over the floating-rate index. If a CLO issued ‘AAA’ debt at a spread of 150 basis points over the floating index and the market now is willing to buy ‘AAA’ debt at a spread of 125 basis points, for example, the manager may want to refinance the debt and lower the deal’s cost of funds. The manager can call each class of debt separately or all classes at once at par. Investors in CLO debt have sold call options on debt to the equity class, and equity will exercise the calls if spreads tighten enough.
A typical CLO includes a period when equity cannot exercise debt calls. The non-call period usually runs for two years after issue on a 5-year reinvestment period, although the non-call period and reinvestment period can be shorter or longer. A manager can then refinance the debt on any business day after the non-call period ends. The manager usually has a choice of refinancing all classes or just some classes. If a CLO calls its debt, it can issue new debt with a new non-call period and with a lower spread for the remaining term of the CLO.
If debt is called, the investor can either get the par value of the debt in cash or the same par amount of new debt issued to finance the deal. The new debt will have the same repayments terms as the old debt. But the new debt will carry a lower coupon, so a CLO debt investor can see coupon income called away.
CLO equity investors can also choose to reset a deal after the non-call period ends. Resets make changes to the CLO structure beyond refinancing the debt. A reset could add equity to the deal and raise the balance of debt, extend the maturity, add a new non-call period and make other changes. Resetting a deal is a much more complex negotiation between equity and debt investors.
In rare cases, a manager can also reissue a deal. This involves paying off all debt, transferring CLO assets along with equity interests to a new securitization trust and issuing a new stack of debt.
The risk of losing coupon income to refinancings, resets or even reissues means that CLO debt spreads reflect call risk. CLO prices and spreads change as the non-call period varies. The shorter the remaining non-call period, the wider the spread on debt and the harder it is for debt to trade much above par. The longer the remaining non-call period, the tighter the spread and the higher the potential premium to par.
Amortization
After the reinvestment period, maturing and repaid loan principal is generally used to retire outstanding CLO debt starting with the ‘AAA’ class and proceeding to each lower class until all debt is repaid. But that is not always the case. Some deals allow the manager to continue reinvesting repaid principal within limits. This extends the average life of the deal. But in most cases the timing of repayment and the average life of debt depends on the schedule of loan maturities, the pace of repayment and any defaults. After 90% of debt is repaid, equity can liquidate any remaining loans at any time and take the proceeds. At that point, the deal ends.
The emergence of static CLOs
Some CLOs—static CLOs—come to their pricing date with a fully assembled portfolio, close and issue debt and do no reinvesting afterwards. Some investors like this approach because it allows them to assess risk with full knowledge of the loan portfolio before closing and avoids the complexities of reinvestment. The lack of reinvesting also shortens the average life of the debt. When investors have reasonable confidence in the overall leveraged loan market but want to avoid manager risk, a static CLO can be a good choice.
No risk retention for CLOs backed by broadly syndicated loans
Unlike issuers of securitizations, managers of CLOs backed by broadly syndicated loans in the US do not have to hold onto any of the debt or equity issued to fund a deal. The US Court of Appeals for the District of Columbia made that decision in February 2018, four years after the Dodd-Frank Wall Street Reform and Consumer Protection Act initially required it. Dodd-Frank wanted to align the incentives of loan originators to those of subsequent investors. The act required securitizers to retain at least 5% of the credit risk of the assets serving as collateral for debt securities, giving securitizers incentive to monitor the quality of the loans involved. For four years, managers of CLOs distributed in the US retained the required 5% risk. But following litigation brought by the Loan Syndications and Trading Association, the DC Circuit Court decided CLO managers were not securitizers. The court pointed out that securitizers transferred assets to a trust that issued asset-backed securities. Managers instead never own the loans backing a CLO, only acquiring them in the open market on behalf of the CLO trust, and consequently cannot transfer them. The manager only acts as an agent of the issuer. That, the court decided, made CLO managers exempt from retention.
Managers of CLOs backed by middle market loans in the US do have to hold onto risk since those managers almost always work for the same company that originated the loans. Those managers hold the risk for the life of the asset.
Managers of CLOs distributed in the European Union and the United Kingdom also retain risk, and the market continues to produce deals for a broad audience in those markets.
Wide spreads in CLOs
The loan portfolio collateralizing a CLO along with the structure and manager all contribute to the spreads on CLO debt. Those spreads vary reliably across debt rating from levels between 100 bp to 200 bp or more on ‘AAA’ classes to between 500 bp and 1000 bp or more on ‘BB’ classes. CLO spreads historically exceed spreads on similarly rated corporate debt, but for reasons addressed later. The spreads nevertheless draw a wide audience of investors looking for income.
Exhibit 2.7.A: CLO debt spreads reflect collateral, structure and manager
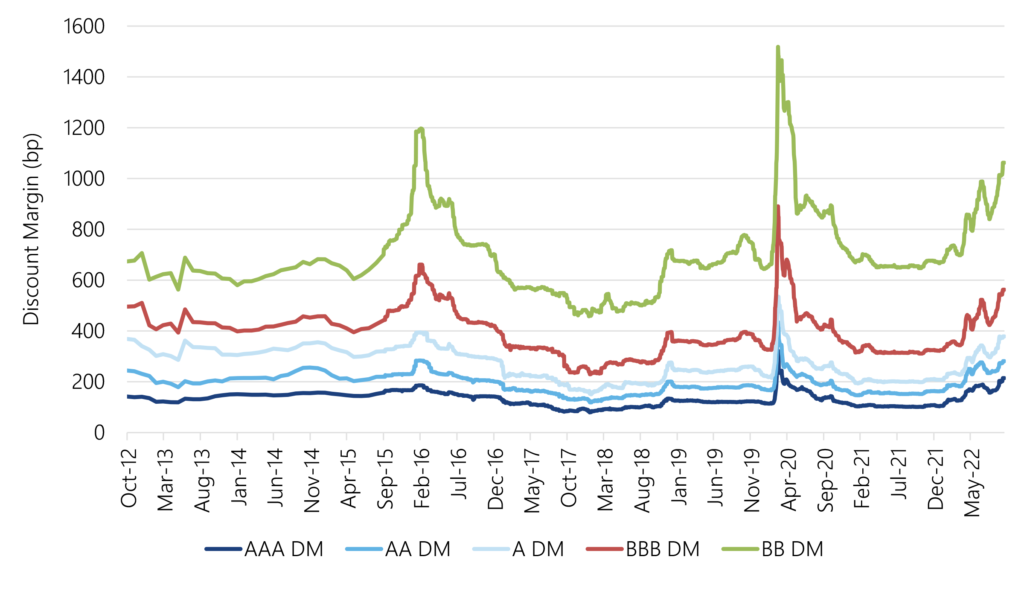
Source: Palmer Square, Bloomberg, Santander US Capital Markets
Past performance of CLO structure
Past performance has proven CLO structure quite resilient. The combination of subordination, collateral performance and collateral quality tests has led to few defaults in any CLOs despite the Global Financial Crisis, the energy crash of 2015-2016 and the Covid-19 pandemic. Among CLOs issued from the mid-1990s through 2009, the era of CLO 1.0 when subordination generally was lower and spreads on loans and debt tighter, defaults over the life of the structure remained low. ‘AAA’ classes saw no defaults with other classes seeing single digit percentages except for ‘B’, which saw 10.7% (Exhibit 2.8). Among CLOs issued from 2010 through 2021, CLO 2.0, defaults have been even lower, although roughly half of rated CLO 2.0 deals remain outstanding. For those deals, ‘AAA’, ‘AA’, ‘A’ and ‘BBB’ classes have seen no defaults with ‘BB’ and ‘B’ default percentages in the low single digits.
Exhibit 2.8: A record of relatively low defaults in CLOs

Source: S&P Global Rating, Santander US Capital Markets
Performance is about more than just defaults, of course, and the downgrading of rated CLO classes can have a big impact on pricing and cash flow. Ratings can fluctuate with credit conditions, sometimes significantly. After Covid-19 struck in March 2020, for example, rating agencies put hundreds of CLO classes under review (Exhibit 2.8.A). Subordination and other forms of support meant none of S&P’s ‘AAA’ or ‘AA’ classes came under review with the spotlight focusing instead on classes with lower ratings. By the end of 2020, S&P had downgraded less than 2% of ‘A’ classes, 13% of ‘BBB’, 44% of ‘BB’, 60% of ‘B’ and 62% of ‘CCC’. Many of these classes ended up having their ratings partly or fully restored as credit conditions improved through 2021. But downgrade rather than default is a more material part of risk in different CLO classes.
Exhibit 2.8.A: Covid-19 triggered a broad review of CLO ratings and downgrades through 2020

Source: Standard & Poor’s, Santander US Capital Markets
Projected performance of CLO structure under stress
History, of course, may not include plausible future stress scenarios. That requires stress testing. In October 2021, the National Association of Insurance Commissioners, or NAIC, reported its 2020 stress testing results on US insurers’ CLO exposure. The NAIC tests covered nearly $193 billion in CLO holdings. Under the most stressful scenario, losses only touched ‘A’ and lower classes, leaving ‘AA’ and ‘AAA’ classes untouched.
In the stress tests, NAIC used the first 10 years of default history from Moody’s for cohorts of corporate debt from 1970 to 2011. It refined the history for ‘Ba’ through ‘Ca’ issuers into finer categories from ‘Ba1’ to ‘Ca-C.’ For each rating category, the NAIC ended up with 40 default histories. It then calculated the average default rate year-by-year across the 40 histories, and the standard deviation of the default rate year-by-year. That allowed the NAIC to build an average annual default rate for a rating category for 10 successive years, and an annual default rate one standard deviation above average.
The NAIC also applied stress to loan recovery rates. It assumed each CLO would have to sell a defaulted loan roughly six months after default. In the base case, for example, the study might assume a defaulted first lien bank loan would trade around $64. In the stress case, it might assume it would trade like a defaulted senior unsecured bank loan, and the recovery would step down to around $40.
The NAIC then built three scenarios for each loan rating category:
- A base case: the historical average default rate for 10 years with historical rates of recovery
- A stress case: the historical average default rate for 10 years with stressed recovery
- A stronger stress case: the default rate one standard deviation above average for 10 years with stressed recovery
The NAIC excluded CLOs backed by middle market loans, commercial real estate and any other collateral except broadly syndicated loans. The study did not account for the potential benefits of diversification across issuers or across industry within a CLO portfolio, or any impact from active portfolio management.
The study took 1,700 unique deals and ran each one loan-by-loan through the scenarios corresponding to each loan’s rating and tallied up the principal and interest cash flows. In the most stressful scenario, ‘AAA’ and ‘AA’ took no principal or interest losses (Exhibit 2.9). ‘A’ classes took only 4 bp of losses. ‘BBB’ and lower classes took substantial losses, however, including some classes that lost more than 100% of par due to failed OC tests and diversion of interest to senior classes.
Exhibit 2.9: The NAIC stress test of insurers’ 2020 CLO holdings show no ‘AAA’ or ‘AA’ losses

Note: Mezzanine classes may not receive interest payments in stress scenarios if a senior OC test is triggered. This does not quality as a default, but the missed interest is capitalized. If the capitalized interest is not later paid back to the mezzanine class, losses can amount to more than 100% of the par or amortized value of the position. Source: Johnson, J. and J. Carelus, E. Kolchinsky, H. Lee, M. Wong, E. Muroski and A Abramov, “Collateralized Loan Obligation (CLO) – Stress Testing U.S. Insurers’ Year-End 2020 Exposure,” Table 8, available at https://content.naic.org/sites/default/files/capital-markets-special-reports-clo-stress-test-ye-2020.pdf.
S&P stress tested its own rated US CLO 2.0 positions during the energy collapse of 2015. S&P developed five test scenarios and all resulted in limited rating impact, except a very severe scenario that combined all stress factors into one case (Exhibit 2.10)
Exhibit 2.10: S&P ran a stress test on BSL CLOs during the 2015 energy collapse

Source: S&P, “Shock To The System: Additional Stress Tests for U.S. CLO 2.0 Ratings Show Continued Resiliency,” September 15, 2015.
In 2017, S&P completed a similar study for middle market CLOs. S&P typically rates middle market CLO classes from ‘AAA’ to ‘BBB’. In general, the agency found that middle market loan CLOs benefit from higher levels of subordination and relatively lower exposures to energy and commodity industries. In this study, S&P subjected a sample of outstanding middle market loan CLOs to four stresses (Exhibit 2.11). The study highlighted a greater risk of downgrade than default.
Exhibit 2.11: S&P stress tested its middle market CLOs in 2017

Source: S&P, “Shock To The System: U.S. Middle-Market CLO Ratings Show Resiliency To Stress Tests,” April 3, 2017.
Of course, default is only one measure of CLO structural performance. A failed OC test also marks a CLO under pressure, and rating agency upgrades and downgrades also highlight current and potential performance of CLO classes. These features can move CLO prices long before an actual default.
Enter the active manager
CLO structure widens the audience of leveraged loan investors by tailoring risk to the preferences of different portfolios. Portfolios that want to magnify loan credit risk and loan return might invest in classes with lower ratings while portfolios that want to minimize loan credit risk might invest in more senior classes. Investors can choose non-call periods and reinvestment periods to change the potential for default or debt refinancing. The details of OC and interest diversion tests and quality tests can further shape a deal.
Over all of this presides the CLO manager, the other big influence on the performance of a CLO. Without an active manager, investors could focus on the loan portfolio at the end of the ramp-up period and try to project its performance—its rate of repayment and default, the likelihood of breaching a coverage or diversion test, the chances of drifting beyond concentration limits or violating quality tests, the possibility of having debt refinanced or a deal reset. Evaluating the balance between these risks and a fair rate of return requires enough careful analysis on its own. Now add the influence of an active manager, and the work becomes even more challenging.
< Previous Next >
For a print copy of the book, A Quick Guide to CLO Debt and Equity, please contact your Santander Sales Representative.