


The Long and Short
Out-of-consensus calls for investment grade credit in 2026
Dan Bruzzo, CFA | November 21, 2025
This material is a Marketing Communication and does not constitute Independent Investment Research.
Spreads on investment grade credit have room to go even tighter next year, partly because of strong fundamentals but also because Treasury supply is likely to continue outstripping rising corporate supply. Banking, utilities and midstream energy also look likely to have surprisingly good years. And going down in structure through non-bank hybrid debt or pre-capitalized securities look like better ways to pick up spread than going down in credit.
Investment grade spreads tighten even with issuance poised to rise again
It seems possible that investment grade corporate spreads could retest historic tights in the weeks ahead and into early 2026. Seeing the index with a spread over the Treasury curve between 60 bp and 70 bp next year does not appear entirely far-fetched, potentially stretching expectations for excess returns beyond those posted this year. With both gross and net supply poised to rise again next year, investor demand for corporates relative to broader fixed income product could continue to push the market tighter.
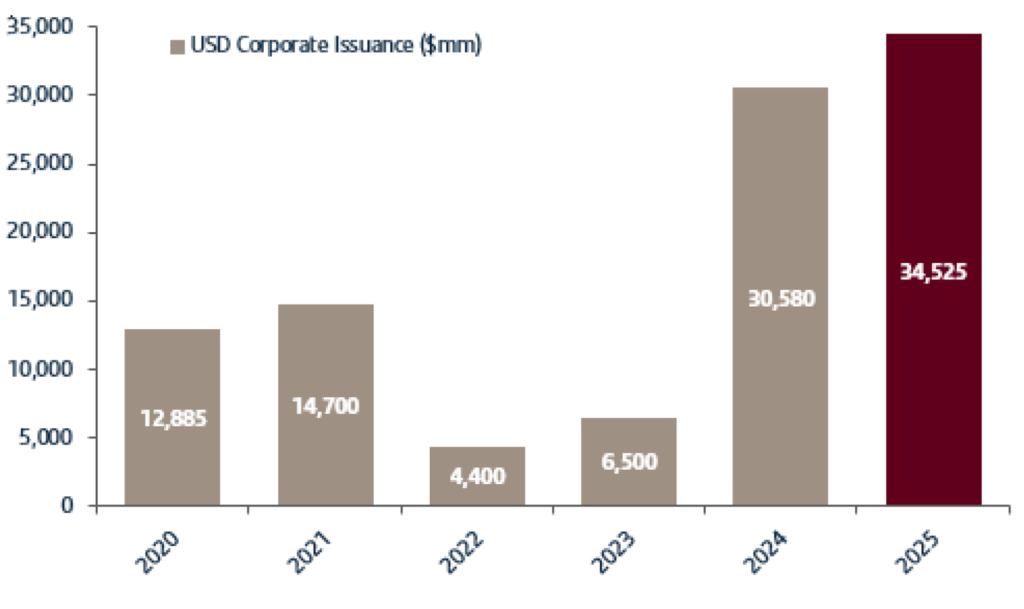
Investment grade corporate new issue has been a big story throughout 2025. Current gross volume stands at just under $1.6 trillion for the year, on pace for the second highest issuance total in history. Only the $1.9 trillion issued in 2020 tops this year. Meanwhile, net supply is on track to finish the year between $300 billion and $475 billion. Hefty gross levels of debt issuance in the current year were at least in part due to the sizable maturity wall that resulted from the record gross levels in 2020. Early guidance is calling for another banner year in 2026. Some estimates call for 10% to 15% growth in gross volume, with some looking for as much as $1.8 trillion in the coming year. Net supply is expected to increase to as much as $600 billion to $800 billion.
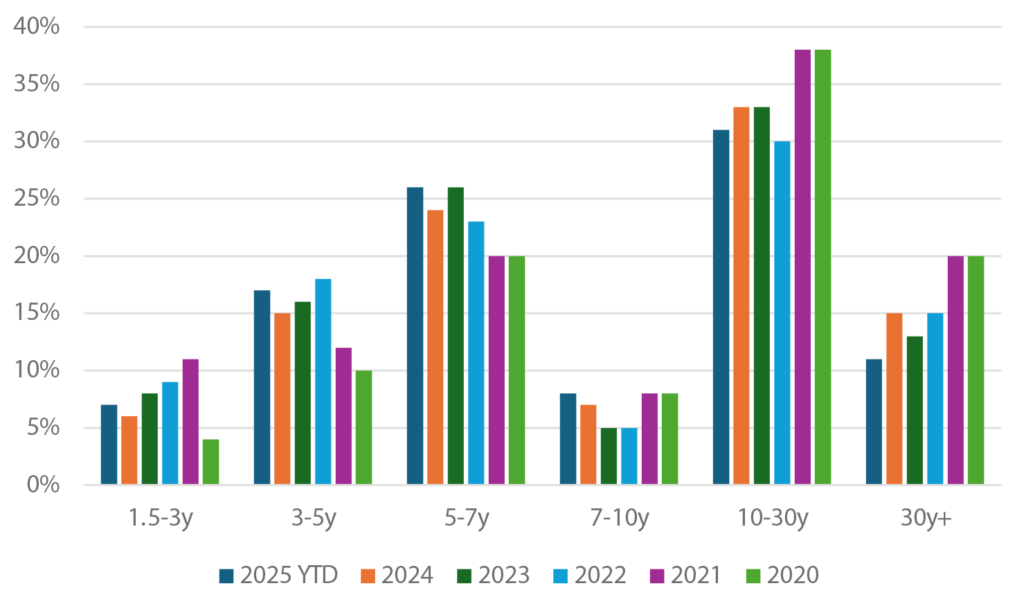
The market also could see significantly higher net growth in the coming year, particularly with the ongoing technology and AI buildout driving some of the recent jumbo debt launches that are pushing volume higher. Furthermore, large capital projects look likely to surface in response to significant tax incentives in the One Big Beautiful Bill Act. Also notable until more recently had been the lack of 30-year supply in the market until some of these late-stage tech deals (ORCL, META, GOOGL) hit the tape. As of summer’s end, debt with 30-year or longer maturities made up just 11% of new supply, compared with a 5-year average of about 17% (Exhibit 1). This added tremendous technical pressure in the long-end of the curve throughout much of 2025, a trend that may not persist in 2026 with more jumbo launches from the TMT segment.
Exhibit 1: New supply of 30-year debt lagged throughout much of 2025
Source: Santander US Capital Markets LLC, Bloomberg IG Corporate Bond Index
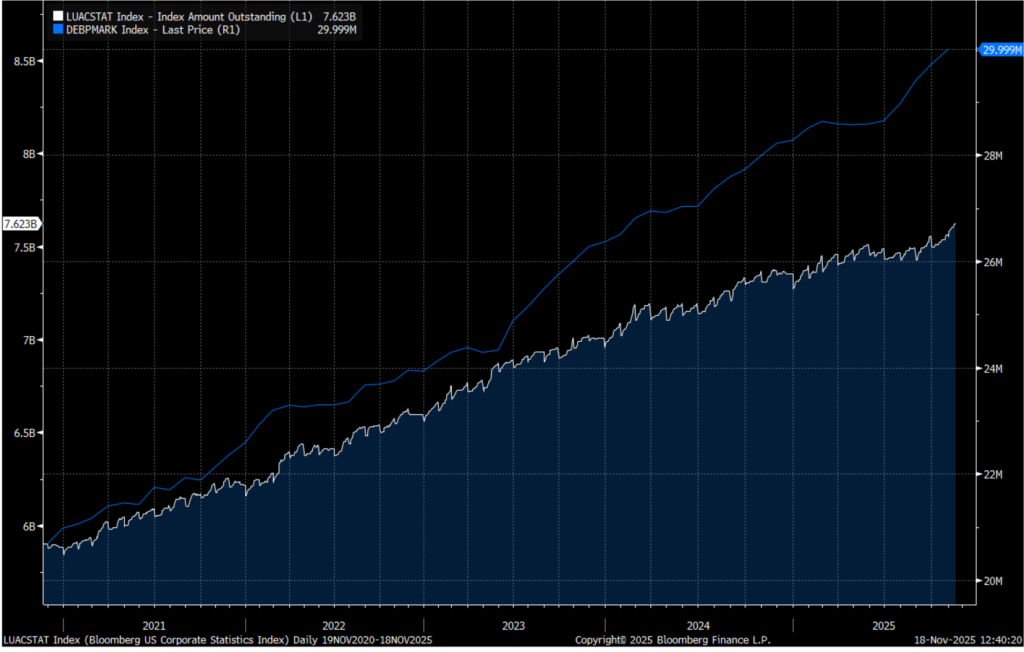
Above all else, even with near record supply for investment grade corporates in 2025 and expectations for more in 2026, even heavier supply of Treasury debt should keep spreads in check. Growth in US Treasury debt has run well ahead of total investment grade index par amount outstanding since mid-2023 and should continue in 2026 (Exhibit 2). This supply imbalance creates a baseline of expected performance for the investment grade sector to support positive excess return continuing and likely accelerating in the coming year.
Exhibit 2: Investment grade par outstanding has lagged US Treasury debt
Source: Santander US Capital Markets LLC, Bloomberg LP, Bloomberg IG Corporate Bond Index
Low-beta sector “carry trades” to navigate late cycle malaise
Sector selection will be critical to total return performance in 2026. With limited capacity for spread tightening in the coming year, investors would be best served to overweight sectors with lower beta carry that are defensive on the downside and therefore well insulated to external risk-off events. These sectors include banking, utilities (including natural gas), and the midstream segment within energy.
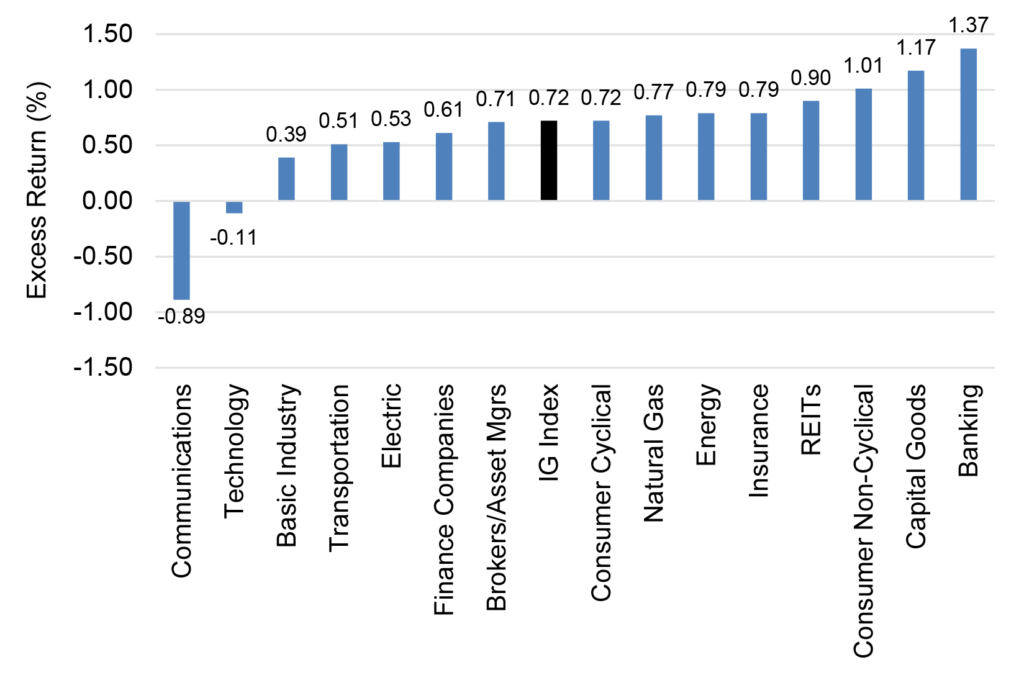
Year-to-date, the investment grade corporate bond index has generated just over 70 bp of excess return. Aggregate option-adjusted spread is remarkably flat as we approach year end having moved just 3 bp to 4 bp wider to about 84 bp in the third week of November from its starting point of 80 bp in January. Total return has come in at just under 7% for the year so far, largely relegating the sector to what would best be described as a “carry trade” for much of 2025. A look back at performance by sector throughout the year demonstrates where investors could identify, albeit limited, opportunities to outperform versus benchmarks. Banking, capital goods and consumer non-cyclicals provided the most stability and consistent returns throughout the year (Exhibit 4). Meanwhile, the communications and technology sectors produced negative excess returns, largely a function of the extraordinary new supply over recent months and several key fallen angels in the segment throughout the year.
Exhibit 3: Investment grade index YTD excess return by sector
Source: Santander US Capital Markets LLC, Bloomberg IG Corp Bond Index
On balance, credit quality for investment grade has been steadily improving for large cap credits over the past year. Cash flows are higher overall, systemic leverage is lower, balance sheet liquidity has improved, and margins are higher. Corporate earnings results have been steady with limited impact from tariff or global trade concerns over the past several quarters. Year-to-date, investment grade upgrades have vastly outpaced downgrades at S&P at a level of 205 to 69. With balance sheets strong and earnings growth tapering off, there does appear capacity for growth in debt-financed M&A, which could see some of these positive credit trends level off with more consolidation. Fairly recently, the market saw the largest ever proposed leveraged buyout (LBO) with the announcement of Electronic Arts valued at $54 billion. And while overall M&A trends spiked in the third quarter, the market is still lagging the headier days of late 2020 through early 2022 when cheap funding fueled the last notable consolidation wave. But even with those potential pressures, underlying credit quality in investment grade should support modestly tighter spreads, particularly when considering higher systemic leverage during prior periods when spreads tested historic tights.
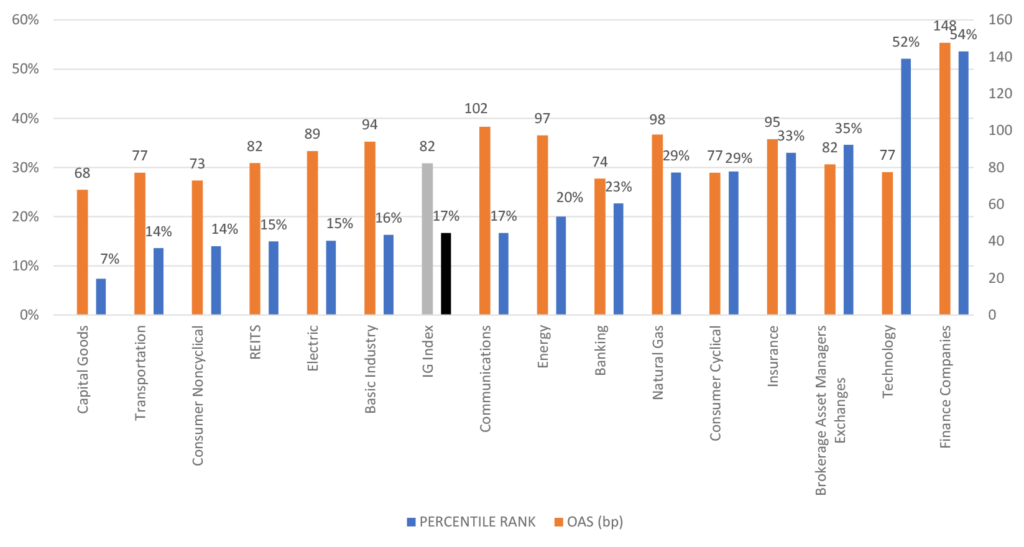
With the more recent back-up in spreads off historically tight levels, percentile ranks within the index have once again begun to signal which sectors have been hardest hit and are signaling “risk/cheap” compared to their historical ranges (Exhibit 4). Not surprisingly, the tech sector has seen the most movement with the influx of jumbo debt launches pushing concessions wider, particularly in deals that did not perform as well, such as META. Given the likelihood for these trends to continue, that does not appear a signal that the segment is presently undervalued for a 2026 outlook.
Exhibit 4: Percentile ranks – current spread versus 5-year range
Source: Santander US Capital Markets LLC, Bloomberg IG Corp Bond Index
Likewise, credits within the finance companies and broker/asset manager segments have been trailing the overall market significantly with fresh concerns about potential deterioration in private credit and increased lending to non-bank financial institutions. While these segments may very well outperform in the in the very short-term as concerns ease, the outlooks for 2026 are far more muddled. The prospect for external risk-off events in the coming year appear more likely to land in these areas of the market and are therefore subject to most potential for spread shocks in the coming year. While the banking sector has rising exposure to private credit and lending to non-bank financial institutions, the largest constituents including both money centers and large regionals, appear well diversified and sufficiently insulated to near-term shocks to credit markets.
While electric utilities (besides natural gas) do not signal as being particularly cheap on their five-year trading ranges, the segment offers tremendous stability amidst shocks in credit and the opportunity for investors to add duration exposure in attractive parts of the curve, such as seasoned 20-year paper. Similarly, midstream/pipeline credits offer investors the opportunity to at least maintain market weight position to the energy sector while mitigating the potential risk for greater oil price volatility in 2026. In the current year, oil prices have remained largely rangebound between $80 and $60, but the outlook for the coming year is far more uncertain. Threats of oversupply and middling global demand growth have some targeting oil prices to dip well below $60 per barrel in the months ahead. Pipeline credits offer the least commodity exposure in the segment with long-term take-or-pay contracts protecting the operators from swings in energy prices. Investors appear reasonably well compensated for credit risk given the attractive protection afforded to this subgroup within the broader sector of the investment grade index.
Choose down-in-structure versus down-in-credit opportunities for alpha
Non-bank hybrids, P-CAPs, and surplus notes all present opportunities to move down in structure in the investment grade market. While the first two continue to look like great ways to pick up commensurate spread in 2026, recent events suggest exercising a little more caution around surplus notes, particularly given inconsistent liquidity over time.
One of the fastest growing segments of the investment grade market has been in non-bank hybrid structures. Issuance of non-bank junior subordinated hybrid securities has gained increased prominence over the past two years. Investor appetite for higher yields has fueled this trend, enabling a broader cross section of issuers to tap this segment of the market. As corporate bond spreads have tested historically tight levels, more investors have moved down in structure to add commensurate spread and yield, creating opportunities for issuers looking to raise debt with partial equity credit. What was once a niche market with only a few issuers has become a more liquid and well-defined segment of the primary and secondary bond markets. Over the past two years, over 90 new issues have priced in the investment grade and ‘BB’ primary markets for non-bank hybrids, more than doubling the number of bonds trading in the overall universe. Volumes in 2025 have already surpassed last year’s record. In the past month alone, there have been eight new issues added to this segment.
Exhibit 5: Five-year growth in non-bank hybrid market
Source: Santander US Capital Markets LLC, Bloomberg, Informa
Comparatively, smaller cap credits with higher risk profiles and lower underlying ratings have seen deterioration in credit quality over recent years. In addition, the recent bankruptcies at Tricolor and First Brands and disclosures of bad loans during regional bank earnings seasons have triggered new concerns about private credit and the rapid expansion of lending to non-bank financial institutions. While it appears possible that some of the growth in this segment could start to taper off in the coming year, it remains a far more prominent source of risk within the system than it did just several years ago. And one that is of greater concern to smaller cap, lower-rated credits within the IG landscape. Investors seeking to bolster spread performance and overall yields would be better served moving down in structure in banks, utilities and midstream credits than taking on exogenous risk in low ‘BBB’ investment companies or other smaller cap credits throughout the system.
Another structure trend in 2025 within the IG landscape has been the increased use of pre-capitalized securities or P-CAPs . While traditionally a structure that has been used almost exclusively in the insurance sector, Mexico’s $12 billion bailout of Pemex in 2025 utilized the issuance of P-CAPs, demonstrating the potential for much broader application across a variety of potential different industries – something that could materialize more in 2026. Additionally, new insurance companies employed the structure for their capitalization needs throughout the year, including MET and LNC.
P-CAPs are a unique trust structure for companies that want to raise capital but keep leverage off the balance sheet until (or if) the liquidity funds are eventually needed. The bonds trade in the secondary market at a significant discount to comparable senior unsecured debt issued by the same companies. Rating agencies rate them in-line with senior unsecured debt, since the trust can only be dissolved by issuing comparable senior unsecured debt to replace the securities. LNC and UNM have dissolved P-CAP trusts in the past year providing proof of concept on the structure. The current discount within the insurance sector continues to be about 20 to 25 bp, which appears to attractively compensate investors for the moderate give-up in liquidity.
Another structure frequently employed in the insurance sector are surplus notes. Both public and mutual insurance companies use surplus notes to diversify capital and attract different types of investors within the public debt markets. Despite their subordinated classification within the capital structure, in many cases surplus notes are among the only outstanding debt issues for mutual companies. Therefore, they are often only subordinated to the insurance company’s policyholders for priority of payment. Interestingly for the public insurance companies, since the debt is issued directly out of the insurance operating company, it typically maintains structural seniority to most of the senior unsecured debt issued at the parent company level. Furthermore, since large mutual insurance companies are conservatively managed, and typically well-capitalized, these subordinated issues frequently maintain higher ratings than even the senior debt levels of some of the largest and higher-rated public insurance companies.
Surplus notes are also classified as hybrid capital since they technically provide for temporary loss absorption to issuers. While the deals are mostly issued as cumulative, both principal and interest payments must be approved by the insurance company’s state regulators. At the regulator’s discretion, those payments can be delayed without triggering an event of default or cross-default provisions. In the event of a delay in interest payment, interest accrues until regulatory approval is reinstated to the issuer to resume the payments. Although there have been very few instances where a delay in payment was ever implemented in the history of the structure, recent events should at least give investors pause on this niche segment of the market.
MASSMU is one of the largest and most frequent issuers of this particular debt class. Earlier this year, concerns were raised by the SEC about the insurer’s investment accounting practices. An investigation is ongoing, with the SEC issuing subpoenas regarding the company’s bookkeeping related to billions of dollars of loans held in its general investment account. The concern for investors of surplus notes is if accounting irregularities do exist and in a worst-case scenario result in a delay of payment on MASSMU’s coupons. That would likely cause the segment of the market to reassess risk in surplus notes, serving as a reminder to investors that despite high ratings overall, the securities do qualify as hybrid capital. At a minimum, investors should exercise a little more caution around the sector, particularly given that liquidity on these securities can fluctuate highly with interest rates.