


The Big Idea
Rising costs of homeownership weigh on home prices
Steven Abrahams | August 1, 2025
This material is a Marketing Communication and does not constitute Independent Investment Research.
It’s official, at least based on home prices through May. The impressive rally in US residential real estate since the start of 2022 has finally stalled. One simple rule of thumb in housing is that prices stay flat go or up unless you can find forced sellers. Well, the rising price of homeownership brought on mainly by insurance costs and taxes looks like it is gently pushing sellers into the market. Investors in new mortgage credit, new vintages of prepayment risk and in the debt and equity of companies that rely on bull market housing should put that on the radar.
Stall speed
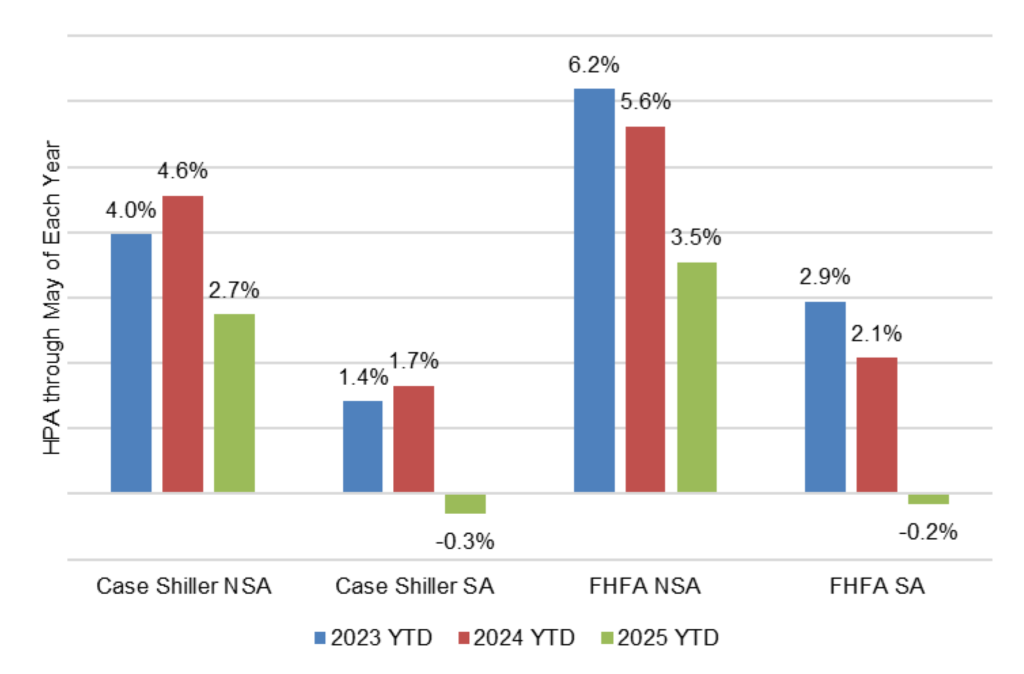
Nominal home prices still have increased this year as they typically do through the spring selling season. The S&P/Case-Shiller US National Home Price Index before seasonal adjustments shows prices up through May by 2.7% (Exhibit 1). But after adjusting for the usual spring surge, prices this year are down 0.3%.
Exhibit 1: Home prices up nominally year-to-date but down seasonally
Source: Bloomberg, Santander US Capital Markets
The Case-Shiller index is not alone. The index published by the Federal Housing Finance Agency also shows nominal prices up by a smaller 2.1% and adjusted prices down by a smaller 0.2%. The two indices suggest the loss of price momentum is broadly based. Case-Shiller covers housing purchases of any type—conforming conventional, jumbo, non-QM, FHA, VA or other loans or purchases not financed at all—and is weighted by market value. The FHFA index covers just homes financed by loans purchased by Fannie Mae or Freddie Mac whether for purchases or refinancings and gives each home equal weight.
A market for price targeting rather than price discovery
The effectively flat pricing so far this year signals that something is changing in housing. The US market in residential real estate has long been a market for price targeting rather than price discovery. Sellers can stay in the property, take it off the market or rent it until a buyer comes along willing to hit the nominal target. This kind of market becomes biased toward only the most motivated or optimistic buyers, biasing prices higher. Only if sellers can no longer afford to stay does the transaction turn into price discovery where the seller lowers the price until finding a clearing level.
Forcing the sellers
US sellers historically have lost their ability to stay in their house only in a narrow range of circumstances. Those include holding an adjustable-rate mortgage as interest rates rise, a job loss or other income shock or a combination of these. Job losses in Texas after oil prices crashed in the mid-1980s, for example, helped drive local home prices down. Job losses in Southern California as the defense industry contracted in the 1990s also helped drive local home prices down. And, of course, the rising percentage of US homes financed with ARMs in the late 2000s along with job losses through the Global Financial Crisis drove home prices down in markets across the country.
In recent years, the high percentage of US homes financed by mortgages with low fixed rates along with help from a strong labor market have protected housing from selling pressure. At the end of March, 96% of US mortgages had fixed rates, with more than 70% of those loans paying interest of 5% or less. Higher interest rates have not raised the cost of homeownership for those borrowers. And unemployment for the prior two years through March averaged 3.8%, among the lowest unemployment rates since the late 1960s. Homeowners have had steady mortgage payments and the income needed to pay housing expenses.
But now some things are changing.
One thing that has obviously changed is inflation. Since home prices started accelerating at the start of 2022, CPI after stripping out the cost of housing has moved up 11.4%. That’s the cost of everything else competing for a homeowner’s dollars. But since average hourly earnings have moved up 13.5%, the average household has likely covered those rising costs.
Homeowners insurance, which is excluded from CPI, has gone up faster than hourly earnings. CPI uses owners’ equivalent rent as the biggest component of the cost of shelter and consequently excludes the cost of homeowners insurance along with most spending on home maintenance and repairs to avoid double-counting. But PPI includes a measure of premiums for homeowners’ insurance, and that index since the start of 2022 is up 21.9%. That increase is undoubtedly more for areas vulnerable to storms, flooding and wildfire and less for everywhere else.
Property taxes also have gone up faster than hourly earnings. Since the start of 2022, the US Bureau of Economic Analysis tally of personal current state and local property tax receipts has gone up by 22.1%. Depending on home prices, frequency of reassessment and changes in tax rates, the tax impact also can vary sharply across local markets.
Different markets, different stories
The flat average home price this year leaves a substantial tail of local housing markets at a year-to-date loss offset by a substantial tail with a year-to-date gain. Of 471 local US housing markets, 143 are at a loss, 83 are flat and 245 have a gain (Exhibit 2). Since the performance of any pool of credit depends heavily on the exposures most at risk, the markets with losses so far this year are the ones to watch.
Exhibit 2: Average HPA masks a broad dispersion of HPA across markets
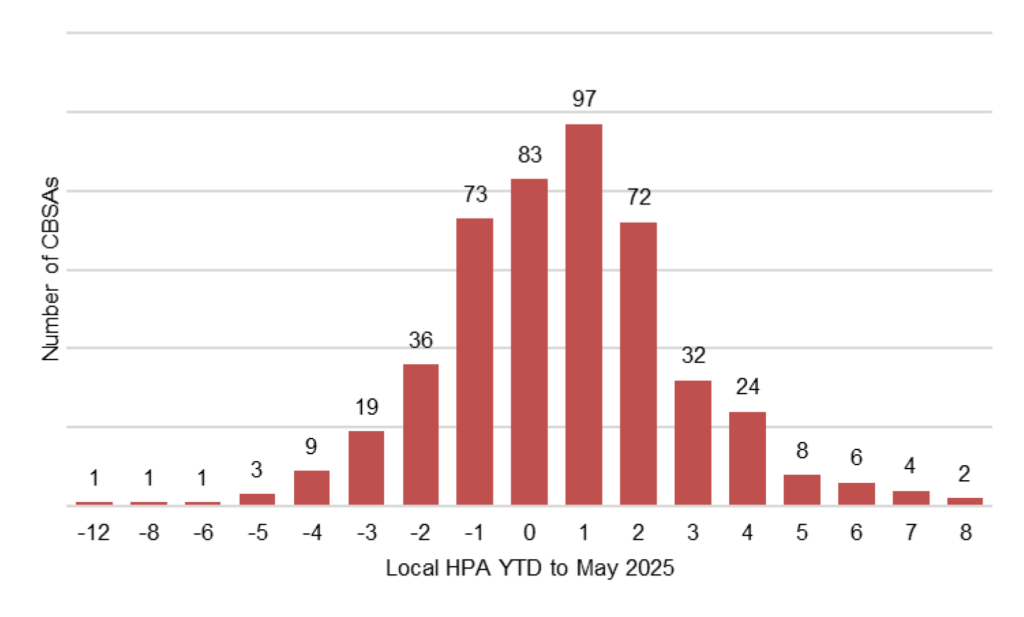
Note: CBSA stands for core-based statistical area, the geographic area surrounding a core urban area as defined by the US Office of Management and Budget.
Source: Cotality, Santander US Capital Markets.
The exposed markets
Although the new softness in home prices should have some marginal effect on economic growth and consumer spending, it stands to put more of a pinch on a few markets:
- Exposures to new vintages of residential credit through agency credit risk transfers and the subordinate tranches of private securitizations; older vintages still likely have substantial home price appreciation in place
- Prepayments in newer vintages of MBS triggered either by default or cash-out refinancing, especially the case for FHA or VA or other loans with high LTVs where small changes in home prices can make a big difference.
- The credit of homebuilders, single-family rental businesses, home improvement retailers and other businesses that rely on home price appreciation
The newest vintages of these exposures should trade at wider spreads than they have over the last few years and definitely at wider spreads than older vintages. Older vintages generally have healthy home price appreciation already built in from prior years. Instead of losing equity in their property, older vintages are just not gaining it as their earlier pace. Chalk it up to a new dynamic that is putting sellers in the housing market—this time not because of rising mortgage costs or lower income but because of the rising cost of homeownership.
* * *
The view in rates
The weak July employment report and heavy revisions lower of May and June payrolls led the market to price in another 15 bp of easing by the end of the year, leaving fed funds priced at 3.73% then. That is roughly 14 bp below the Fed’s June dots. The market is undoubtedly looking at the Bowman and Waller dissents at the last FOMC and the Kugler resignation on Friday and seeing a board with economic and political reasons to get easier. On the other hand, the first signs of tariffs in the inflation numbers also showed up in June, and the possibility of a fresh round of tariffs could give inflation momentum. The Fed is not off the hook yet and still has to balance inflation against the labor market.
Other key market levels:
- Fed RRP balances settled on Friday at $97 billion, down $53 billion on the week
- Setting on 3-month term SOFR closed Friday at 430 bp, down 1 bp in the last week.
- Further out the curve, the 2-year note traded Friday at 3.65%, down 26 bp in the last week. The 10-year note traded at 4.22%, down 16 bp in the last week.
- The Treasury yield curve traded Friday with 2s10s at 53 bp, steeper by 7 bp in the last week. The 5s30s traded Friday at 107 bp, steeper by 9 bp over the same period
- Breakeven 10-year inflation traded Friday at 233 bp, down 9 bp in the last week. The 10-year real rate finished the week at 188 bp, down 8 bp in the last week.
The view in spreads
Spreads look relatively tight against the Treasury curve. That seems to give a lot of weight to a benign outcome to the tariff standoff between the US and dozens of its trading partners. That helps risk assets continue to hold their ground against the Treasury curve. The Bloomberg US investment grade corporate bond index OAS traded on Friday at 76 bp, tighter by 1 bp in the last week. Nominal par 30-year MBS spreads to the blend of 5- and 10-year Treasury yields traded Friday at 147 bp, tighter by 1 bp in the last week. Par 30-year MBS TOAS closed Friday at 35 bp, wider by 1 bp in the last week.
The view in credit
A wide range of specific industries and individual companies still have exposure to tariff risk, but fundamentals for the average of the distribution continue to look stable. Most investment grade corporate and most consumer balance sheets have fixed-rate funding so falling rates have limited immediate effect. Consumer debt service coverage is roughly at 2019 levels. However, serious delinquencies in FHA mortgages and in credit cards held by consumers with the lowest credit scores have been accelerating. Consumers in the lowest tier of income look vulnerable, and renewed student payments and cuts to government programs should keep the pressure on. The balance sheets of smaller companies show signs of rising leverage and lower operating margins. Leveraged loans also are showing signs of stress, with the combination of payment defaults and liability management exercises, or LMEs, often pursued instead of bankruptcy, back to 2020 post-Covid peaks. If the Fed only eases slowly this year, fewer leveraged companies will be able to outrun interest rates, and signs of stress should increase. LMEs are very opaque transactions, so a material increase could make important parts of the leveraged loan market hard to evaluate.