


The Big Idea
The strangely different returns to buying and selling
Steven Abrahams | September 22, 2023
This material is a Marketing Communication and does not constitute Independent Investment Research.
Buying and selling may seem to be opposite sides of the same coin for any institutional portfolio, but buying almost certainly gets more than its fair share of attention. The hunt for the next deal, the overlooked asset, the better relative value seems to take up more time and effort than finding the next thing to sell. And while thoughtful buying can clearly make portfolio returns shine, thoughtful selling can do just as much. In fact, in practice, some intriguing new work suggests thoughtful selling may be a surprisingly important way to add value.
Institutional investors’ decisions to buy selected securities routinely adds excess return to an alternative strategy of just investing evenly across securities a portfolio already owns, according to novel analysis led by Klakow Akepanidtaworn (KA) at the University of Chicago. But just as clearly, institutional investors’ decisions to sell selected securities routinely detracts from returns from just selling evenly across securities a portfolio already owns. Over one year, purchases tended to outperform the alternative strategy by an average of 116 bp while sales tended to underperform by 80 bp (Exhibit 1).
Exhibit 1: Value added by institutional buying but not by selling

Source: Akepanidtaworn, K, R. Di Mascio, A. Imas, and L. Schmidt (2021), “Selling Fast and Buying Slow: Heuristics and Trading Performance of Institutional Investors,” NBER Working Paper No. 29076, Figure 1.
The researchers argue that the better performance from buying comes from the greater amount of attention given to finding good buys and that decisions to sell often come relatively quickly when portfolios need to raise cash either to make new purchases or meet redemptions. The work specifically does not argue that institutional investors intrinsically have better skills for buying than selling. In one creative look at this issue, the researchers look at both buys and sells made on days of corporate earnings announcements, when portfolio managers’ attention would likely get drawn to a particular position. On announcement days, both buys and sells tend to perform well. Only away from announcement days do sells tend to underperform, which the analysts argue reflects not lack of skill but lack of attention. Allocation of attention and effort, not skill, should change.
The study further argues that institutional investors’ decisions to sell underperform because the decision often gets narrowed into an overly simple rule-of-thumb: (i) focus on portfolio positions that have significantly outperformed or underperformed the rest of the portfolio, and then (ii) within those positions, sell the ones where the portfolio lacks any strong conviction for or against them, which is conceptually equivalent to selling positions where the portfolio weighting is close to neutral. Selling a neutral position substitutes for selling a position where the manager does the work to figure out which one might subsequently underperform.
The results seem intriguing for institutional fixed income portfolios even though the team led by KA focused on 783 separately managed accounts generally owned by pension funds with an average balance of $573 million invested in equities. These portfolios also had limits on short sales. The study used daily data from these portfolios from 2000 to 2016, giving them an extraordinarily detailed view.
Part of the intrigue for fixed income portfolios comes from the intuition that the fixed income market also spends more time and effort on buy opportunities than on sell opportunities. Street research typically focuses more on buys than on sells, and portfolios see far more offers during a typical day than requests to buy securities from the investor. And in fixed income, just as in equities, the results from a buy decision—the returns on the position after acquisition—usually are far more visible than the results from a sell decision where the position disappears and its returns are no longer tracked.
One place where fixed income might see similar results would be in markets where mutual funds do more than the usual amount buying to invest inflows and in markets where funds do more than the usual amount of selling to meet redemptions. The work by KA and team should predict that in markets with inflows, active funds deliver more than the usual amount of alpha or excess return. And in markets with redemptions, active funds should deliver less alpha or excess return.
Last year and this year offer a natural test of these possibilities because in 2022 many actively managed fixed income mutual funds saw material redemptions while in 2023 many saw material inflows. Monthly excess returns for a fund should be weaker in 2022 than in 2023. Although only a cursory analysis of the possibility among a few of the largest actively managed US fixed income mutual funds, the pattern shows up. For example:
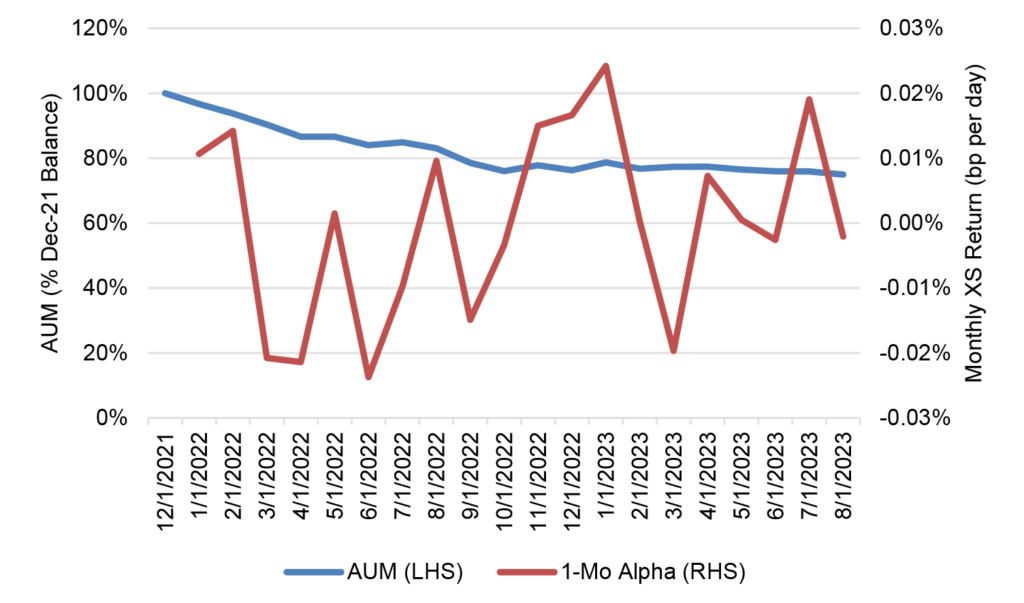
- In the first fund examined, AUM dropped from the start of 2022 through October and rebounded afterwards. Average daily alpha or excess return through October was -0.01%, after October 0.003% (Exhibit 2).
Exhibit 2: Fund #1 alpha was low through redemptions, higher through inflows

Note: 1-month alpha calculated by regressing daily returns from the fund during each month on daily returns on the fund’s primary benchmark, the Bloomberg Aggregate Bond Market Index. Fund name available on request.
Source: Bloomberg, Santander US Capital Markets
- In the second fund examined, AUM also dropped from the start of 2021 through October, and then rose slightly afterwards. Average daily alpha through October was -0.003%, after October 0.015% (Exhibit 3).
Exhibit 3: Fund #2 alpha was low through redemptions, higher afterwards

Note: 1-month alpha calculated by regressing daily returns from the fund during each month on daily returns on the fund’s primary benchmark, the Bloomberg Aggregate Bond Market Index. Fund name available on request.
Source: Bloomberg, Santander US Capital Markets
- In the third fund examined, AUM again dropped from the start of 2021 through October, and then stayed roughly flat afterwards. Average daily alpha through October was -0.0103%, after October -0.0004% (Exhibit 4).
Exhibit 4: Fund #3 alpha was low through redemptions, higher afterwards

Note: 1-month alpha calculated by regressing daily returns from the fund during each month on daily returns on the fund’s primary benchmark, the Bloomberg Aggregate Bond Market Index. Fund name available on request.
Source: Bloomberg, Santander US Capital Markets
- In the fourth fund examined, AUM again dropped from the start of 2021 through October, and then stayed roughly flat afterwards. Average daily alpha through October was -0.006%, after October 0.006% (Exhibit 4).
Exhibit 5: Fund #4 alpha was low through redemptions, higher afterwards
Note: 1-month alpha calculated by regressing daily returns from the fund during each month on daily returns on the fund’s primary benchmark, the Bloomberg Aggregate Bond Market Index. Fund name available on request.
Source: Bloomberg, Santander US Capital Markets
In four funds examined out of the 20 largest active US fixed income funds, all four showed a lower alpha during redemptions in 2022 than after redemptions largely ended. Although the absolute differences in alpha during and after redemptions were small, they were daily measures that could quickly compound over time. Of course, multiple caveats apply: the sample of funds is limited, the number of months is small, and factors other than redemptions could be influencing the results.
Although far from the careful work done by KA and team, the excess returns on fixed income funds nevertheless are broadly consistent with the idea that selling to generate cash often lowers fund performance. If the ideas behind the more careful work are correct, then fixed income investors could add material value by focusing as carefully on identifying sale candidates as they do on identifying buy candidates. Portfolio teams may want to designate buy and sell analysts. Or short of going that far, portfolio teams may want to resist the urge to sell clear winners or losers where the team is index-weighted and sell a strip of the entire portfolio when circumstances call for cash. That may be an underexploited way to add back return in an actively managed portfolio.
* * *
The view in rates
OIS forward rates now see a chance of one more hiks from the fed and roughly steady rates through March. The same forwards then anticipate 75 bp of cuts from March to December 2024.. The Fed may hold rates high into July next year and then cut afterwards. The risk to the market is that sticky inflation keeps the Fed at higher rates for even longer, which would eventually create credit problems for balance sheets funded at floating rates that already are burning cash.
Other key market levels:
- Fed RRP balances closed Friday at $1.43 trillion, up $26 billion in the last week but down dramatically from its March peak of $2.37 trillion.
- Setting on 3-month term SOFR traded Friday at 540 bp, roughly unchanged in the last week
- Further out the curve, the 2-year note closed Friday at 5.11%, up 7 bp from mid-August. With the Fed likely to hike again and hold fed funds closer to 5.50% into next year, fair value on the 2-year note is above 5.00%. The 10-year note closed at 4.43%, up 10 bp in the last week. Much of the rise in 10-year yields came after late July hints of a shift in Japan’s yield curve control and the Treasury announcement of heavy supply ahead. With inflation likely to drift down and growth likely to slow through this year and next—shaping the Fed path—fundamental fair value on the 10-year note for now is closer to 3.50%.
- The Treasury yield curve closed Friday afternoon with 2s10s at -67, steeper by 3 bp in the last week. Expect 2s10s to reflatten toward -100 bp again as the Fed keeps short rates high and concerns about growth and recession grip long rates. The 5s30s closed Friday at -3 bp, steeper by 1 bp in the last week.
- Breakeven 10-year inflation traded Friday at 237 bp, up by 3 bp on the week. The 10-year real rate finished the week at 206 bp, up 8 bp on the week.
The view in spreads
The Bloomberg investment grade cash corporate bond index OAS closed Friday at 143 bp, tighter by 3 bp on the week. Nominal par 30-year MBS spreads to the blend of 5- and 10-year Treasury yields traded Friday at 167 bp, roughly unchanged on the week. Par 30-year MBS TOAS closed Friday at 65 bp, also roughly unchanged in the last week. Both nominal and option-adjusted spreads on MBS have been particularly volatile in the last month but trending wider.
The view in credit
Most investment grade corporate and most consumer balance sheets look relatively well protected against the likely impact of Fed tightening. Fixed-rate funding largely blunts the impact of higher rates on both those corporate and consumer balance sheets, and healthy stocks of cash and liquid assets allow these balance sheets to absorb a moderate squeeze on income. But other parts of the market funded with floating debt look vulnerable. Leveraged and middle market balance sheets are vulnerable, especially with the tightening of bank credit in the wake of SVB. At this point, mainly ‘B’ and ‘B-‘ loans show clear signs of cash burn. Commercial office real estate looks weak along with its mortgage debt. Credit backing public securities is showing more stress than comparable credit on bank balance sheets. As for the consumer, subprime auto borrowers, among others, are starting to show some cracks with delinquencies rising quickly. The resumption of payments on government student loans in September should add to consumer credit pressure.