


The Big Idea
The sound of bank credit tightening
Steven Abrahams | February 11, 2023
This material is a Marketing Communication and does not constitute Independent Investment Research.
The latest Fed survey of bank lending standards released February 6 should give pause to any credit portfolio. The Fed survey may be the single best indicator of economic slowdown and recession of the last 30 years. And the survey showed the sharp tightening of bank credit that started last spring continued through December, especially across commercial and industrial loans and commercial real estate. Credit portfolios should check valuations on their most cyclical and most leveraged holdings. And private debt investors with cash should start focusing on opportunities.
Tighter bank credit has coincided with recession since 1990
Along with each US recession since 1990 has come tighter lending standards at banks (Exhibit 1). Cause and effect are hard to untangle here. Tighter access to bank credit could limit business and consumer spending and tip the economy into recession or, alternatively, slowing growth and weakening borrower balance sheets could encourage banks to protect themselves. But parsing cause-and-effect may matter less for investors than the signal the numbers send about slowing growth and the risk to credit in specific areas.
Exhibit 1: Bank lending his tightened to levels often associated with recession
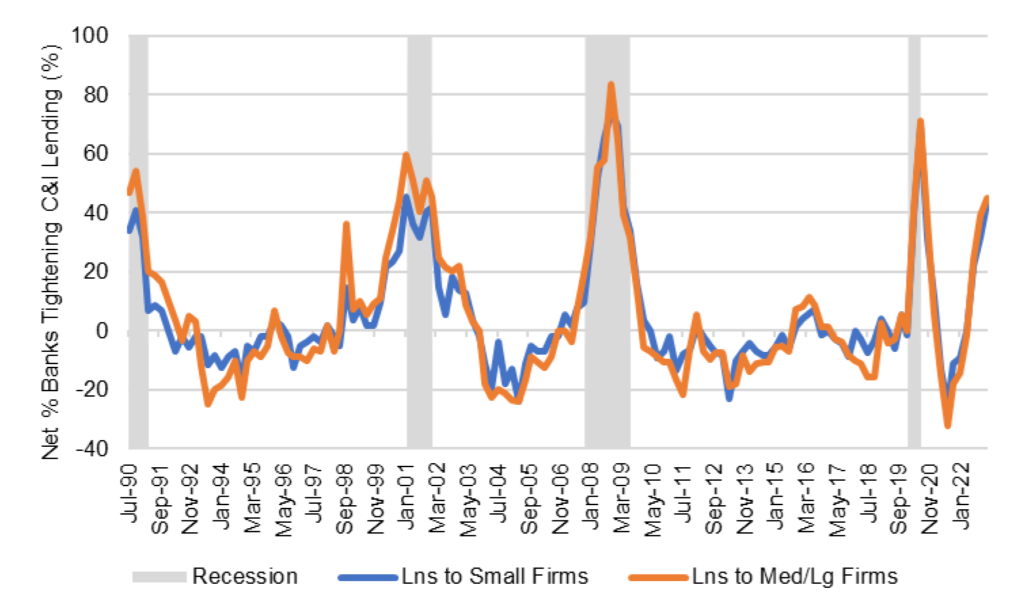
Source: Bloomberg, Federal Reserve, Santander US Capital Markets
The survey suggests that small and large business along with commercial real estate is in the process of getting the screws while the consumer is only getting tweaked. The survey showed around 44% of banks net tightening credit on commercial and industrial loans, around 57% tightening on nonfarm nonresidential commercial real estate loans and multifamily loans and 69% tightening on commercial real estate development loans. A modest 10% to 17% tightened on different types of consumer loans. And an even more modest 2% to 15% of reporting banks tightened on residential mortgage loans.
The reasons cited for tightening on commercial and industrial loans seemed especially interesting and diverse. Among others:
- Economic uncertainty
- Lower risk tolerance
- Problems with specific industries
- Poor liquidity in the secondary C&I loan market
- Less competition from other banks and nonbanks
- Deterioration in current or expected liquidity
Concerns about liquidity strike a particular chord since, as Tom O’Hara and Stephen Stanley have noted in other contexts, banks have seen a significant drop in core deposits as the Fed has tightened and have started raising deposit rates. Anecdotally, some banks have started offering incentives to loan officers if borrowers redeposit unused cash. Other banks have sharply raised rates on retail certificates of deposit, citing concern about runoff. A higher cost of funds will likely get passed through to borrowers, further tightening credit.
Banks’ forward views of credit
Banks’ forward views of credit also suggest a further turn in the credit tap. The latest survey asked a set of special questions about banks’ outlook for further changes in lending and loan quality this year. And a major net share expected to tighten across commercial and industrial and commercial real estate. Moderate shares planned to tighten on mortgage loans, credit cards and auto loans. The main reasons cited for tightening include deteriorating collateral values, lower risk tolerance and eroding quality in the bank’s own loan portfolio.
The pinch falls on leveraged and middle market credits
Most investment grade credits have little to worry about if bank credit tightens since lower rates and lower spreads in the bond markets have actually eased credit conditions substantially since October. Even companies with access to the high yield bond markets have found conditions easier this year and issuance year-to-date well ahead of last year.
The pinch from tighter bank credit will likely fall on leveraged loan borrowers with operations burning cash and on middle market companies tied to one bank and with limited other sources of funds. If it turns out again that tighter bank credit coincides with slower growth or recession, these highly leveraged borrowers and middle market businesses could find themselves caught between declining revenues and costly and constraining financing.
Opportunity for private credit
This kind of market creates opportunity and risk for the growing pockets of private credit supported heavily by pensions and life insurers. The Milliman index of the 100 largest pensions showed them funded at the end of January at 109.3%, giving them room if appropriate to rotate out of equities and into long-duration credit to match longer liabilities and lower the volatility of their net pension obligations. As for life insurers, CreditSights estimates that roughly half of current US life insurer allocation to corporate credit is private, including both 144A, portfolio financing, direct lending and other forms. Pensions and insurers will likely have good opportunities to provide lifelines to companies with good businesses that need to ride out a period of slow growth.
Estimating the risk priced in
One distinct aspect of this cycle of Fed tightening has been the speed with which the market has tried to anticipate and price in risk. Credit markets already have priced in substantial risk. Just take leveraged loans, for instance. The average loan in the Morningstar/LCD leveraged loan index prices today at $94.66. That pricing could absorb historically high defaults of 10.7% and historically low recoveries of 50% and still produce an attractive return. Close attention to valuation will be important.
* * *
The view in rates
OIS forward rates now price almost exactly to the Fed’s forward guidance, hitting 5% now by August 2023 and falling only to 4.83% by August 2024. The market is priced in line with warnings from Fed Chair Powell and other FOMC members that the Fed will hold rates high through the end of the year.
Fed RRP balances closed Friday at $2.04 trillion, unchanged over the last week. With the federal government at its debt ceiling and cutting back on net new issuance, rates on short Treasury bills have become much more competitive. Banks have also started competing a little more for cash by raising deposit rates. Competitive from T-bills and bank rates may be cutting into RRP.
.
Settings on 3-month LIBOR have closed Friday at 487 bp, up 6 bp on the week. Setting on 3-month term SOFR closed Friday at 476 bp, up 7 bp on the week.
Further out the curve, the 2-year note closed Friday at 4.52%, in the neighborhood of fair value given the risk of fed funds climbing to 5.0% or higher and remaining there into 2024. The 10-year note closed well above fundamental fair value at 3.73%, up 21 bp on the week.
The Treasury yield curve has finished its most recent session with 2s10s at -78 bp flatter by 2 bp over the last week. The 5s30s finished the most recent session at -10 bp, flatter by 5 bp over the last week. The 2s10s curve looks likely to invert by around 100 bp shortly before Fed tightening comes to an end. That should come by mid-year.
Breakeven 10-year inflation finished the week at 234 bp, up 11 bp in the last week. The 10-year real rate finished the week at 140 bp, up 11 bp in the last week.
The view in spreads
Volatility has remained steady into February and should come down with each reading on inflation and employment and each Fed meeting. Each number and meeting should give more clarity to inflation, growth and Fed policy. Both nominal MBS and credit spreads should tighten as volatility drops. Nominal par 30-year MBS spreads to the blend of 5- and 10-year Treasury yields closed Friday at 148 bp, up 19 bp on the week. Par 30-year MBS TOAS has closed Friday at 55 bp, wider by 16 bp on the week.
The view in credit
Most investment grade corporate and most consumer balance sheets look relatively well protected against the likely impact of Fed tightening. Fixed-rate funding largely blunts the impact of higher rates, and healthy stocks of cash and liquid assets allow these balance sheets to absorb a moderate squeeze on income. Leveraged and middle market balance sheets are vulnerable, especially with the sharp tightening of bank credit. As for the consumer, subprime auto borrowers, among others, are starting to show some cracks with delinquencies rising quickly. In leveraged loans, a higher real cost of funds has already started to eat away at highly leveraged balance sheets with weak or volatile revenues.