


The Big Idea
Easing an income pinch with wholesale funding
Tom O'Hara, CFA | February 3, 2023
This material is a Marketing Communication and does not constitute Independent Investment Research.
Banks this year should have a hard time repeating the earnings-palooza of 2022 as pandemic-driven cash supply leaves the system and banks need to pay depositors more to stay. The mix of deposits is also shifting toward more expensive interest-bearing deposits. Banks consequently will need to raise more wholesale funds to offset deposit run-off, which may further compress net interest income. But wholesale funding still looks like the most efficient game in town.
Ensuring liquidity and protecting earnings
Bank wholesale funding has jumped by roughly $300 billion since last June (Exhibit 1). That is small amidst banks’ nearly $21 trillion in liabilities, but it is offsetting a decline in core retail deposits. Rising balances at money market funds suggests those deposits are leaving for higher yields away. The competition for cash has started.
Exhibit 1: Wholesale funding has helped offset core deposit runoff
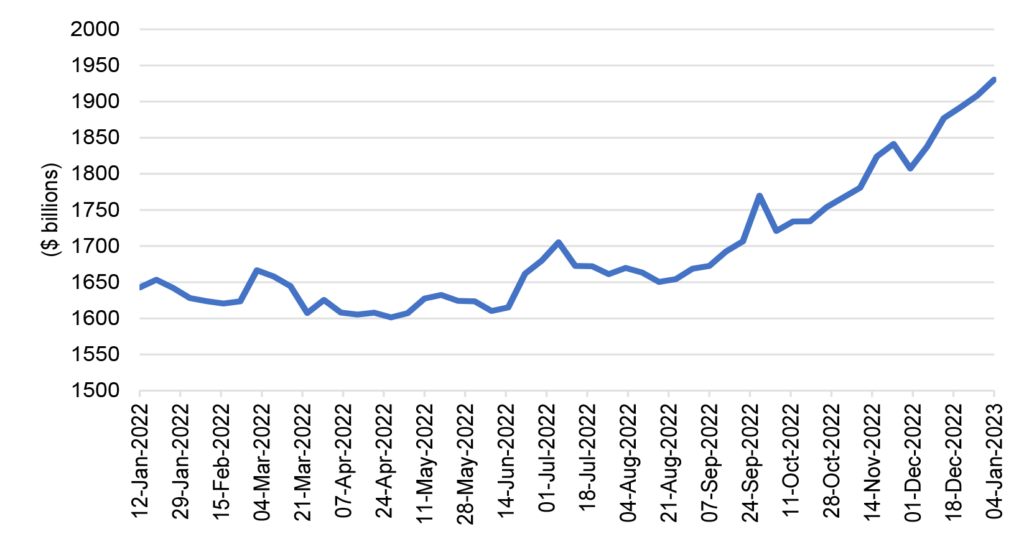
Source: Federal Reserve H.8 as of 1/4/23, Amherst Pierpont Securities
One notable form of wholesale funding on the rise is borrowing from the Fed’s discount window, reaching as much as $9 billion last November. At the beginning of pandemic, the Fed reduced the premium of the discount window over the top end of the fed funds range from 50 bp to 0 bp, ending the historical premium over funds and trying to remove the stigma attached to borrowing at the window. The Fed also extended the maximum term from overnight to 90 days with the option to prepay at any time, providing banks with more flexibility. The New York Fed recently noted recently noted that most of the borrowers are banks with assets less than $3 billion. The NY Fed noted that quantitative tightening has resulted in a disproportionally large cash drain at these smaller banks.
Bank treasury teams will need to deploy the full arsenal of wholesale funding alternatives, including FHLBank borrowings, unsecured debt issuance, securitization and repurchase agreements, all of which will likely be more expensive than deposits.
For our bank tracking group, the median cost of interest-bearing deposits is 0.56%, whereas the median cost of other debt is 3.03% as of the third quarter last year—5.4 times higher. However, interest-bearing deposits account for 58% of the median bank’s funding mix, compared to 10% for other debt, or 5.8 times the amount of other debt. This helps illustrate why seemingly more expensive wholesale funding alternatives continue to be an attractive part of the overall liability mix. A bank that issues new unsecured debt around 5% would see the same dollars of interest expense by increasing their deposit cost by just a few basis points.
Banks can also take advantage of the currently inverted yield curve to issue longer-dated debt. A large regional bank recently issued 3- and 10-year senior debt on the same day, where the spread differential between the two was 70 bp. But given a 40 bp point curve inversion, the bank was able to print a coupon on the 10-year that was only 30 bp higher than the 3-year.
Of course, to enhance net interest income, banks could look to expand the credit box of their loan and securities portfolios, although given the possibility of recession in 2023, the timing might not get a warm reception from investors or regulators. Banks could also shift balance sheet interest rate exposure. Where many banks added duration in the second and third quarters of 2022 to make themselves less asset sensitive, that activity has cooled in recent months. Most banks remain modestly asset sensitive and seem content to hold their rate risk profile constant until a clearer market direction develops.
The background: a rising cost of funds
The marginal impact of wholesale funding varies significantly from bank to bank based on the pricing of deposits. With loans growing at a robust pace, banks are reaching their limits in terms of how much cash they have allowed to run-off and realize they need to start paying their depositors more. This is referred to as ‘beta’—how much of the market increase in rates is passed on to depositors. Betas were very low in the first quarter of 2022 but started to rise in the second quarter after the first Fed hikes in March 2022. For our tracking group, that beta overall was 17% on a cumulative basis in the second quarter. As the Fed continued tightening in the subsequent months, banks were forced to increase rates further, resulting in a third quarter of 2022 cumulative beta of 27% (Exhibit 2).
A bank’s beta is usually a conscious decision made by management based on the amount of excess liquidity a bank has, balanced against net interest income needs. Banks with more excess liquidity were happy to keep their betas lower to allow some deposits to run-off and improve earnings. As the graph shows, there is quite a wide range of outcomes based on the individual bank’s own business model, with some banks still reflecting cumulative betas of 10% or lower in the third quarter of 2022, and others around 50%.
Exhibit 2: Betas on the rise
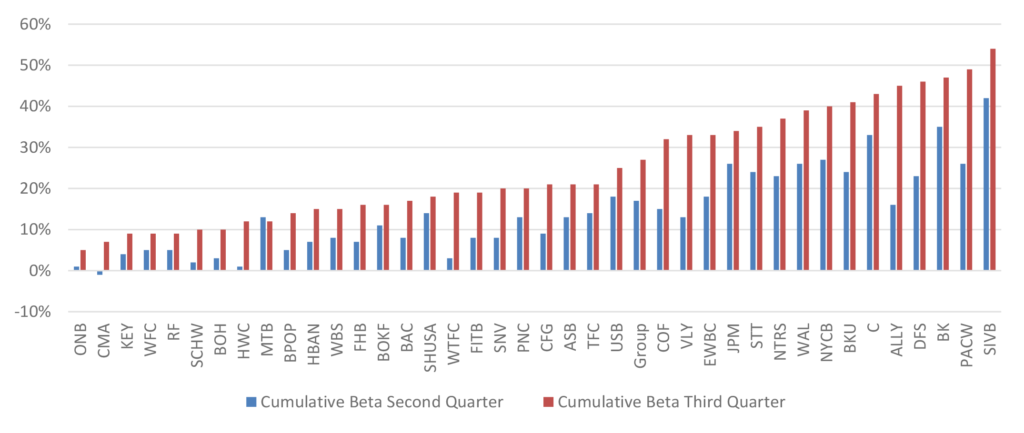
Source: S&P Capital IQ, Amherst Pierpont Securities
In general, higher betas mean higher deposit costs, although this is not always the case. The beta is calculated based on the change in what the bank is paying over a particular time period, so banks may have increased their pay rates substantially, but could be starting from a very low base and therefore still paying a low absolute rate (Exhibit 3). This is particularly true for the trust banks, where Exhibit 2 above shows State Street, Northern Trust and The Bank of New York to all be above the tracking group median and all above 30% cumulative beta for the third quarter of 2022 (BK above 40%), but their actual cost of interest-bearing deposits is around the group median and all still below 1.0% as of the third quarter.
Exhibit 3: Deposit cost is progressively going higher for almost all banks
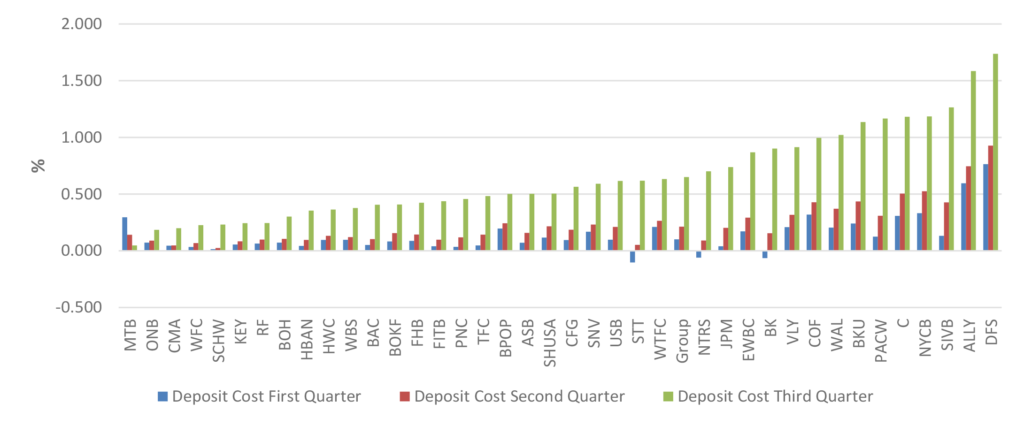
Source: S&P Capital IQ, Amherst Pierpont Securities
Deposits overall declining, interest-bearing deposits increasing
The lag and the low initial betas in 2022 led to a large amount of run-off. There were a handful of banks that closed on M&A transactions last year, which accounts for most of the banks that saw any type of material increase in their overall deposits (Exhibit 4). Otherwise, most banks saw a decline in deposits through the third quarter of 2022, with the median drop being 2%. It is interesting to note that interest-bearing deposits increased through the third quarter last year as a percentage of total deposits by 1%, where the median is now 66%. This trend is likely to continue in 2023, at least over the next few months until the Fed pauses the current tightening cycle.
Exhibit 4: Excluding M&A, overall deposits decline, interest-bearing deposits increase
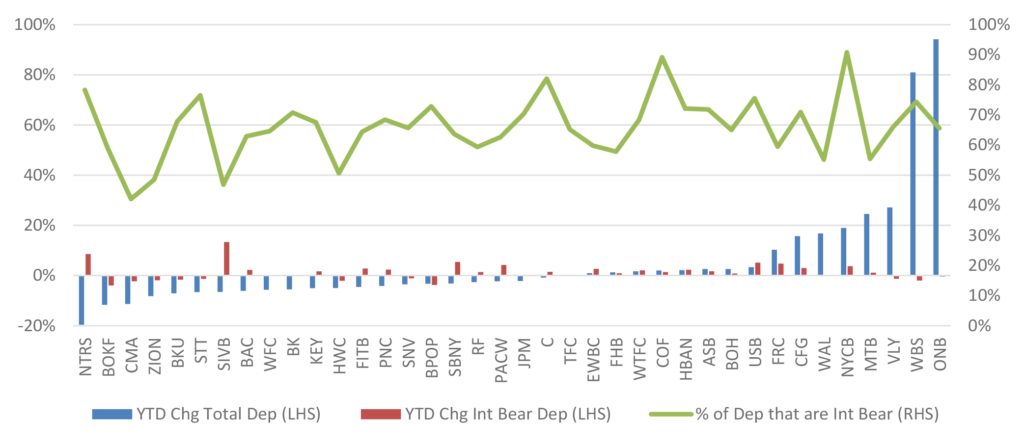
Source: S&P Capital IQ, Amherst Pierpont Securities
What accounts for the differences across banks?
Of course, all banks have their unique issues and challenges based on their own business model, funding mix, geographic concentration and a host of other variables. But one of the most obvious drivers of the differences in beta and cost is liquidity, where some banks are still finding themselves holding ‘surge’ deposits from the pandemic years. As mentioned earlier, a good measure of this is the bank’s loan-to-deposit ratio, and there is a moderate correlation between the bank’s ratio and their actual cost of interest-bearing deposits (Exhibit 5). The graph below reflects the second quarter of 2022, where the red loan-to-deposit ratio line has a gradually higher slope moving left to right, and the banks on the far right with the highest ratios are generally paying more for their interest-bearing deposits. Moderate correlations are also evident when looking at first quarter and third quarter of 2022 data.
Exhibit 5: Deposit cost and loan-to-deposit ratios, second quarter 2022
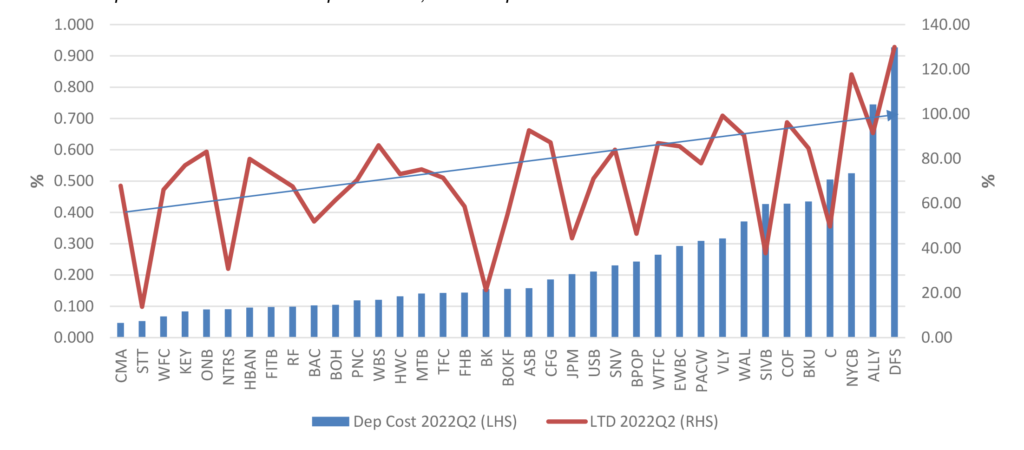
Source: S&P Capital IQ, Amherst Pierpont Securities
After liquidity, another important factor to consider when looking at a bank’s beta and deposit funding cost is earnings and net interest income. Within the overall constraint of liquidity, a bank will try to keep the cost of their interest-bearing deposits as low as possible. Banks with higher percentages of overall funding coming from deposits will be more sensitive to raising their deposit rates to higher absolute levels compares to banks with less funding coming from deposits (Exhibit 6).
Exhibit 6: Deposit cost increase, percentage deposit-funded, third quarter 2022
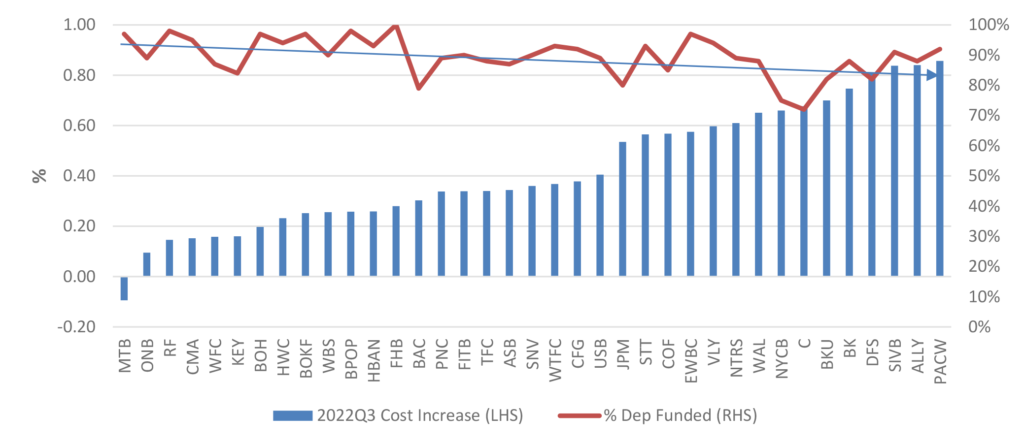
Source: S&P Capital IQ, Amherst Pierpont Securities
Several other factors that would seemingly have an impact on deposit cost did not prove to have a meaningful correlation (< 0.1). Banks with larger percentages of commercial customers than consumer customers were not generally paying more for deposits. Correlations between deposit cost increases were also very low when looking at the amount of deposit outflow, and also when looking at the relative cost of other debt.