


The Big Idea
The ongoing split between large, small corporate balance sheets
Steven Abrahams | February 21, 2026
This material is a Marketing Communication and does not constitute Independent Investment Research.
As larger corporate balance sheets keep getting stronger, smaller balance sheets keep getting weaker. That has been the story since at least the start of Fed tightening in early 2022, and the last six months are no exception. With spreads tight on the debt of both larger and smaller issuers, relative value favors the bigger ones.
Bigger balance sheets continue to gather strength whether measured by earnings, leverage, liquidity, margins or rating trends, The most accessible picture comes from comparing metrics on the S&P 500 to the Russell 2000. The average S&P 500 company these days has a market capitalization of $122 billion while the average Russell 2000 has a capitalization of $1.8 billion. Goliath versus David, although history is probably not a good guide to this one.
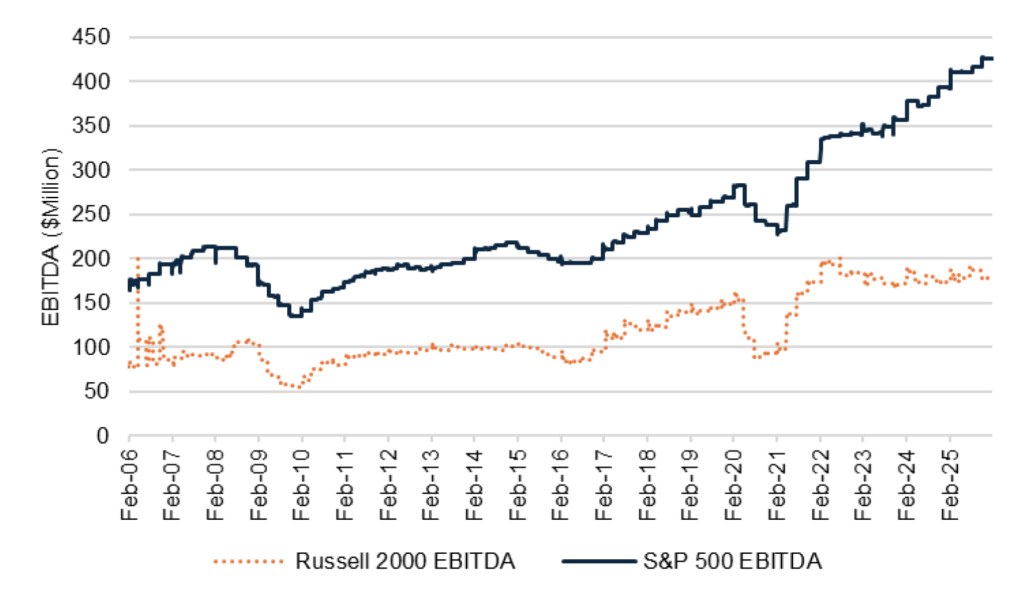
Take topline numbers to start, weighted EBITDA. Earnings at S&P 500 companies have moved higher since the start of 2022 with earnings at Russell 2000 companies essentially flat (Exhibit 1). The average S&P 500 company posts $425 million in EBITDA these days, up 3.5% in the last six months. The average Russell 2000 company posts $178 million, down 5.8% in the last six months. Bigger companies are running up the score on gross earnings.
Exhibit 1: S&P 500 margins rise 3.5% in six months as Russell 2000 drop 5.8%
Source: Bloomberg, Santander US Capital Markets
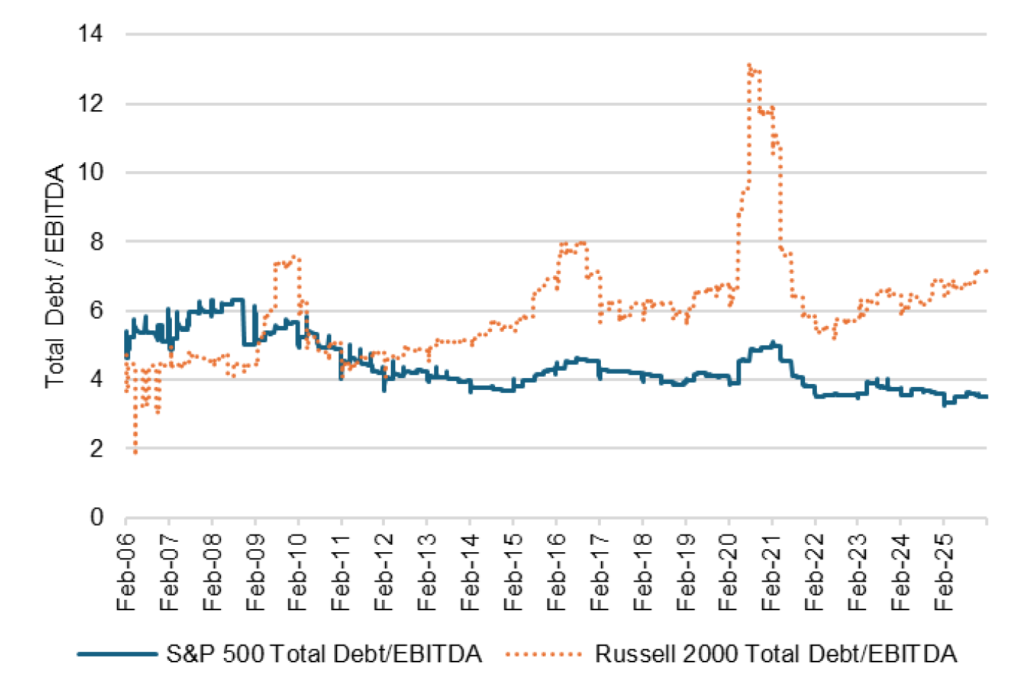
On leverage, the larger and smaller companies again take different paths. Leverage measured by the ratio of total debt to EBITDA continues to drift down at S&P 500 companies with leverage up at Russell 2000. The average larger company lately has 3.5 times its gross earnings, down 0.4% in the last six months. The average smaller company has 7.1 times its gross earnings, up 6.1% over the same time. Larger companies are deleveraging, smaller companies re-leveraging.
Exhibit 2: Leverage is falling at S&P 500 companies, rising at Russell 2000
Source: Bloomberg, Santander US Capital Markets
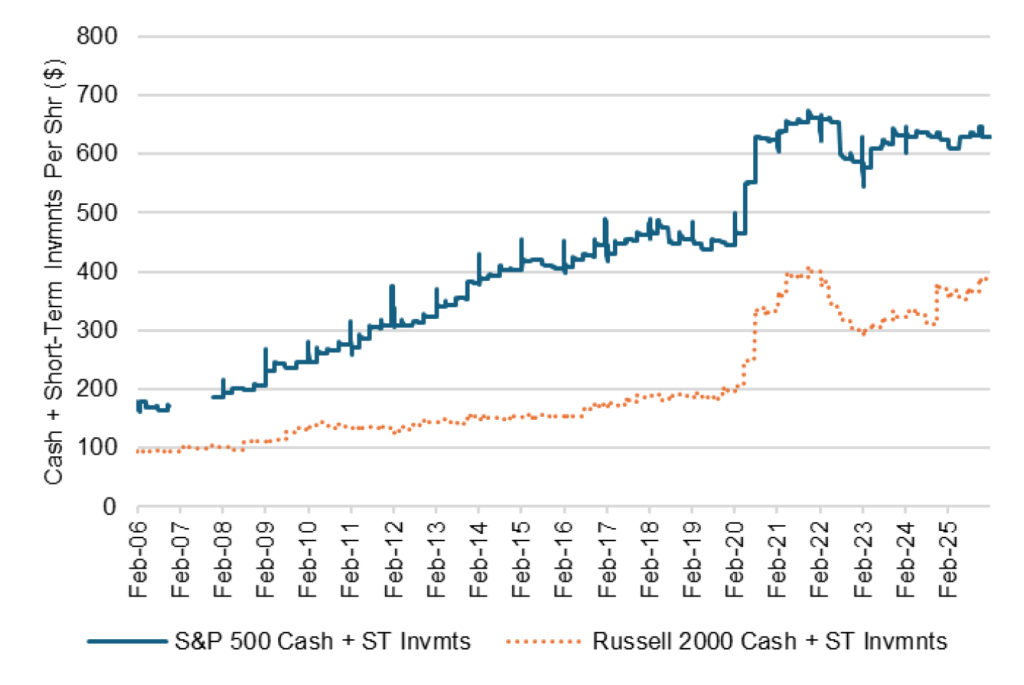
On liquidity, both large and small companies are getting stronger. Larger companies today hold $629 in cash and short-term investments per share on the balance sheet, up 0.1% in the last six months. Smaller companies hold $387 in cash and marketable securities per share on the balance sheet, up 5.2% in the last six months. Corporate liquidity across most balance sheets is marginally improving.
Exhibit 3: Liquidity is improving at large and small companies
Source: Bloomberg, Santander US Capital Markets
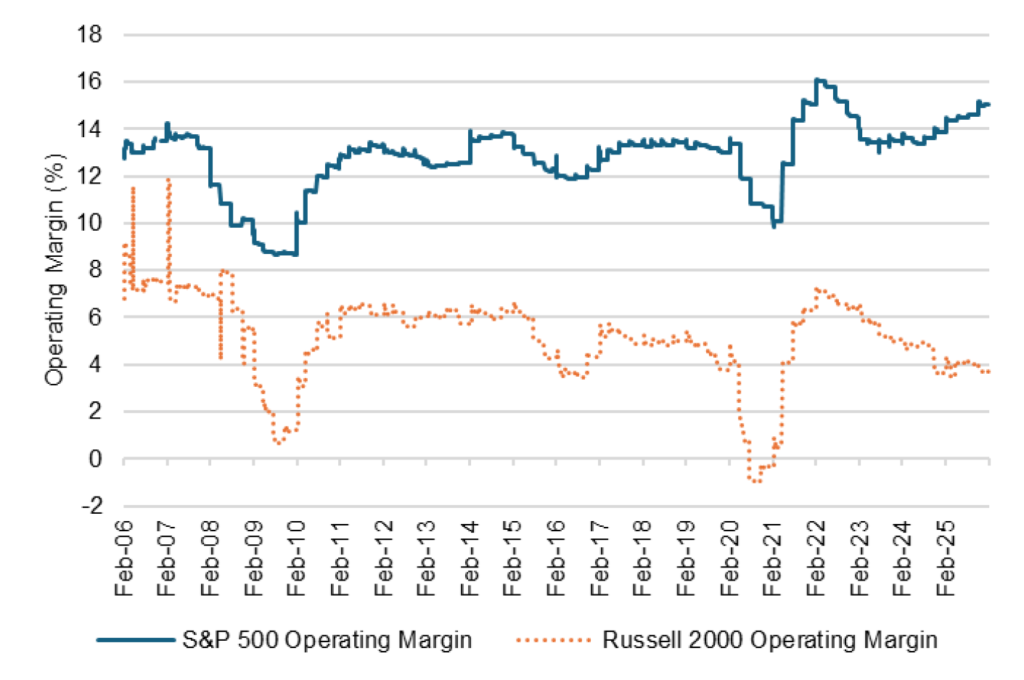
Finally, operating margins, or profits before paying interest and taxes. Although S&P 500 companies have posted margins at least double the Russell 2000 since the end of the Global Financial Crisis, the trend in the last few years is for margins at the big companies to rise and at the small companies to fall (Exhibit 4). Large companies now have average margins of 15.0%, up 3.5% in the last six months. Small companies have margins of 3.7%, down by more than 10% in the last six months.
Exhibit 4: S&P 500 operating margins keep rising, Russell 2000 margins fall
Source: Bloomberg, Santander US Capital Markets
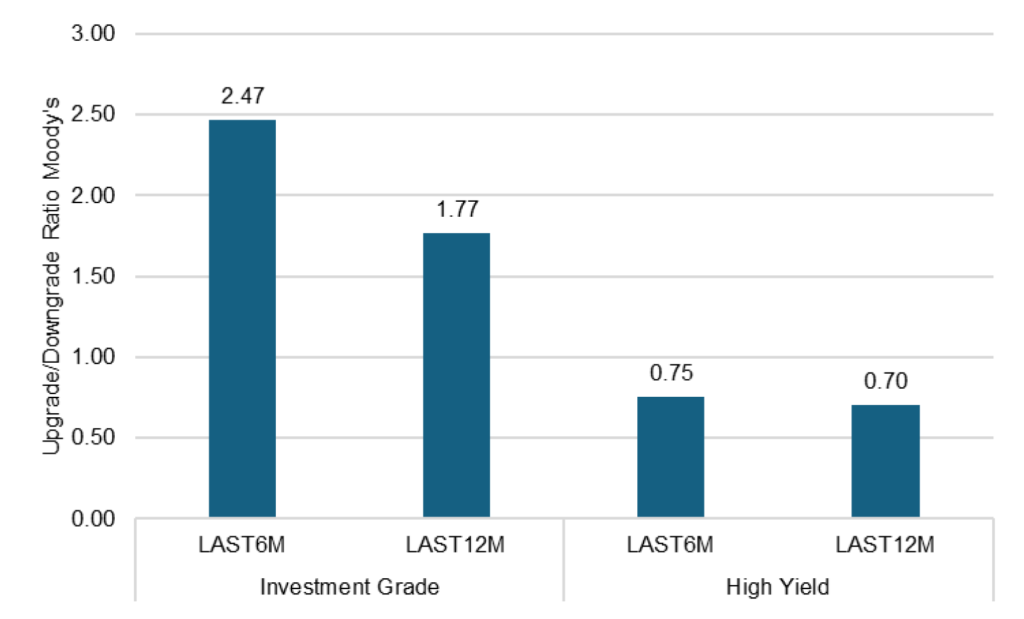
Although balance sheet measures from public companies reflect a wide range of influences and do nothing to reflect the status of the large and growing private equity markets, the picture of larger companies getting stronger while smaller companies trail is also at least echoed in rating agency actions. In the last six months, for example, Moody’s has upgraded the ratings of 2.47 investment grade companies for each investment grade company it downgraded (Exhibit 5). That ratio is 1.77 over the last 12 months. Investment grade companies tend to be larger and less leveraged than most. In contrast, it has upgraded only 0.75 high yield companies for every downgrade in the last six months and upgraded only 0.70 for every downgrade in the last 12 months. High yield companies tend to be smaller and more leveraged.
Exhibit 5: Investment grade upgrade/downgrade ratios top high yield
Source: Bloomberg, Santander US Capital Markets
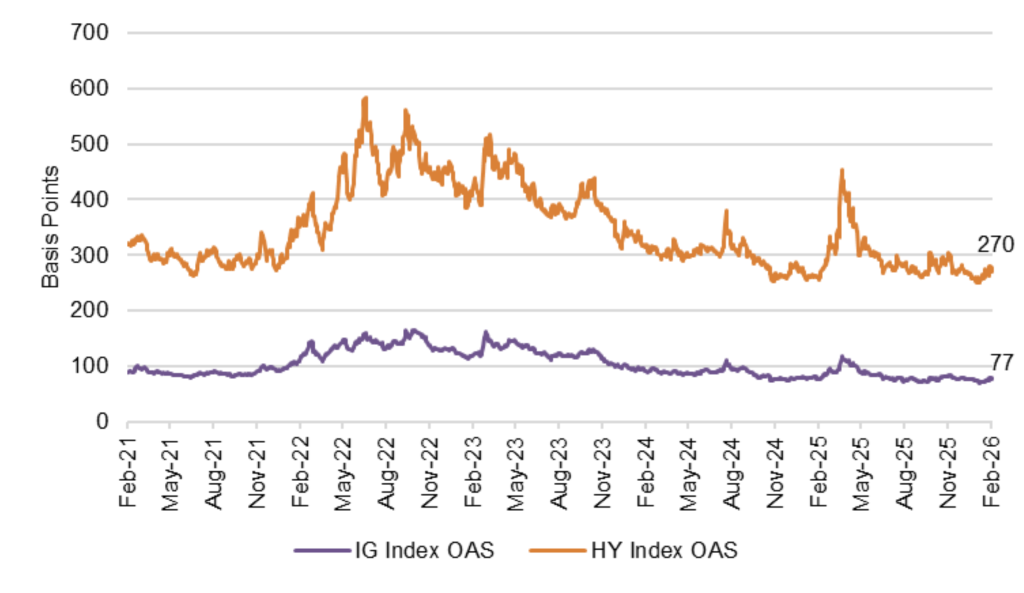
If these contrasting pictures of fundamentals showed up in spreads, then there might be a case for fair value across balance sheets of all sizes. But spreads on the smaller, more leveraged balance sheets captured by high yield indices have followed the larger, less leveraged balance sheets tighter since 2022 (Exhibit 6). Of course, the mix of companies represented in public equity indices and public debt indices differs, but the trend is instructive. The spread between the Bloomberg high yield index OAS and the investment grade index is at 193 bp, the 11th percentile—the tight end—of its 5-year range. Considering broad fundamentals, high yield looks rich.
Exhibit 6: Considering fundamentals, high yield looks rich to investment grade
Source: Bloomberg, Santander US Capital Markets
* * *
The view in rates
Supply and demand keep conspiring against yields at the long end of the curve. On the supply side, the Supreme Court on Friday struck down most of the tariffs imposed by the administration on Liberation Day. Those tariffs had raised monthly import duties from $7 billion in January to $30 billion by September, reducing the US primary deficit. The administration has promised to reimpose tariffs under different laws, but those tariffs usually have limits on amounts, timing or both. It will likely be hard pressed to fully replace the Liberation Day revenues. The administration on January 8 also proposed increasing the defense budget by 66% to $1.5 trillion. That should get resolved through the spring budget process but would boost deficits. On the demand side, the recent rise in yields in Japan stands to trim incentives for Japan’s domestic portfolios to buy US Treasury debt. Japanese debt now offers higher yield that Treasury debt after hedging foreign exchange risk. Since Japan is the single largest foreign holder of Treasury debt, that matters.
The 2s10s Treasury slope traded Friday at 60 bp, off its recent peak at 72 bp, with 5s30s at 108 bp.
Key market levels:
- Fed RRP balances settled on Friday at $496 million, the facility’s 3.50% yield running well below SOFR’s alternative 3.67%
- Setting on 3-month term SOFR traded Friday at 366 bp, unchanged in the last two weeks
- Further out the curve, the 2-year note traded Friday at 3.48%, down 1 bp in the last two weeks. The 10-year note traded at 4.08%, down 12 bp in the last two weeks
- The Treasury yield curve traded Friday with 2s10s at 60 bp, flatter by 11 bp since early February. The 5s30s traded Friday at 108 bp, flatter by 2 bp
- Breakeven 10-year inflation traded Friday at 229 bp, down 4 bp in the last two weeks. The 10-year real rate finished the week at 179 bp, down 9 bp in the last two weeks
The view in spreads
Risk assets have taken their lead from the administration’s January 8 announcement that Fannie Mae and Freddie Mac would buy $200 billion in MBS. That immediately tightened the option-adjusted spread on the MBS index by 8 bp, and credit began tightening in the aftermath. Credit nevertheless began widening in the last two weeks with MBS steady.
Investment grade credit still faces a challenge this year from a sizable 9% to 11% jump in net supply in part to fund AI infrastructure. That could outstrip 5% to 7% growth in outstanding Treasury debt, widening the corporate-Treasury spread, and 2% growth in outstanding agency MBS, widening the corporate-MBS spread. Supply in MBS is even less after excluding Ginnie Mae custom pools, which are not included in the Bloomberg MBS index.
The Bloomberg US investment grade corporate bond index OAS traded on Friday at 77 bp, wider by 2 bp in the last two weeks. Nominal par 30-year MBS spreads to the blend of 5- and 10-year Treasury yields traded Friday at 101 bp, unchanged in the last two weeks. Par 30-year MBS TOAS closed Friday at 11 bp, 3 bp wider since early February.
The view in credit
Bank lending to non-bank financial institutions, including private debt funds and business development companies, has expanded at an extraordinary pace in the last few years, raising the possibility that lending has outstripped experience and infrastructure for underwriting and monitoring. Bank regulators continue to focus on that category of lending, which could eventually tighten the private credit markets. The balance sheets of smaller companies show signs of rising leverage and lower operating margins. Leveraged loans also are showing signs of stress, with the combination of payment defaults and liability management exercises, or LMEs, often pursued instead of bankruptcy, back to 2020 post-Covid peaks.
Consumer credit in the lowest tier of income continue to look vulnerable, and cuts to government programs this year should keep the pressure on.