


The Big Idea
Spreads, swaps, vol and $200 billion in MBS
Steven Abrahams | January 9, 2026
This material is a Marketing Communication and does not constitute Independent Investment Research.
The administration’s Thursday announcement of plans for Fannie Mae and Freddie Mac to buy $200 billion in MBS could lower US mortgage rates slightly, but a material drop would likely require a much bigger mandate. Regardless of ultimate purchases, the return of the Fannie Mae and Freddie Mac portfolios to rapid growth would also likely widen swap spreads and raise interest rate volatility.
Potential Fannie Mae, Freddie Mac demand and available supply
Fannie Mae and Freddie Mac clearly have capacity to buy this amount of MBS. The agencies had an aggregate $167.2 billion in cash or equivalents on their balance sheet as of September 30, presumably allowing them to get into the market on whatever schedule they want. If the agencies somehow do not currently have sufficient cash or if the mandate were to expand, they could issue debt.
To have the biggest impact on mortgage rates that borrowers see, the portfolios would likely buy MBS trading around par and backed by new loans. Currently that is 30-year 5.0% and 5.5% MBS. It would almost certainly include Fannie Mae and Freddie Mac MBS and could include Ginnie Mae, too.
The impact of purchases would obviously depend on supply and timeline. Over the last three months, the market has seen $94 billion in net new 30-year 5.0% pools and $73 billion in net new 30-year 5.5% pools (Exhibit 1). If this rate of production continued for a year, that would leave $376 billion in new 5.0% pools and $290 billion in new 5.5% pools. The longer the portfolio timeline for buying MBS, the better the market should be at accommodating the new demand. The targeted purchase would amount to 77% of recent 3-month net production in likely MBS but only 19% of annualized production. In either case, beside any impact on MBS spreads, the TBA MBS market is likely to offer special financing as dealers sell to the agency portfolios and then use financing to ensure availability of pools to deliver.
Exhibit 1: Outstanding amounts and recent net supply in newly produced MBS
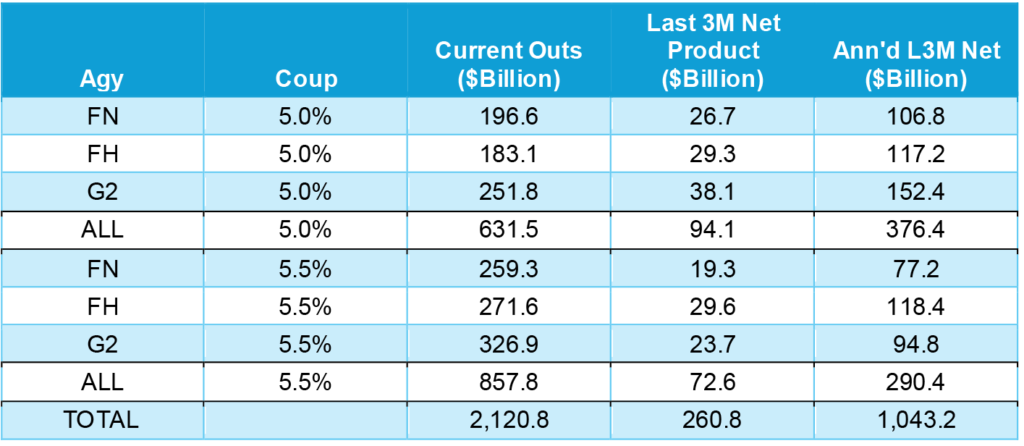
Source: eMBS, Santander US Capital Markets
New demand and special financing is likely to make production coupons rich relative to other MBS, encouraging sales from money managers and other portfolios in a position to sell. They would likely deliver pools into the TBA market. That expands the potential supply of MBS to include large parts of currently outstanding balances. That includes $631 billion in 30-year 5.0%s and $858 billion in 30-year 5.5%s. The $200 billion target amounts to only 9.4% of the combined amount.
One other factor could limit the impact of Fannie Mae and Freddie Mac demand on borrowers’ rates, and that is mortgage originators. Originators could choose to keep primary mortgage rates elevated despite the falling yield of MBS. That would increase the value of loans originated and add to origination P&L. In 2020, as the Fed started a new round of QE including MBS, the spread between the primary and secondary rate widened from around 110 bp to a peak just below 180 bp (Exhibit 2). That allowed originators to either sell loans at premium prices or sell MBS against the loans and keep more servicing income on their balance sheet.
Exhibit 2: As QE started in 2020, primary rates lagged the drop in MBS yield
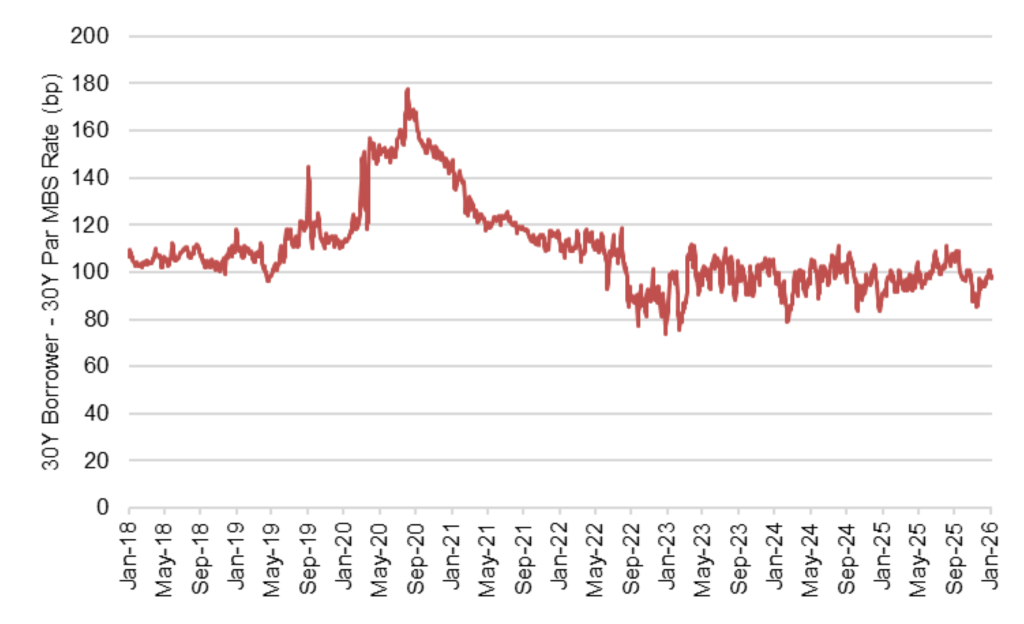
Note: 5-day moving average of the difference between the 30-year primary mortgage rates, which borrowers see, and the 30-year par MBS rate.
Source: Santander US Capital Markets
Finally, both Fannie Mae and Freddie Mac today operate under a $225 billion limit on their portfolio size included in the Preferred Stock Purchase Agreement that governs conservatorship. Fannie Mae had $99.7 billion of room under the cap at the end of November and Freddie Mac had $79.3. Freddie Mac is further limited to another $40 billion in agency MBS. In theory, these limits could prevent another $200 billion in purchases. But the only parties to the agreement are the US Treasury and the Federal Housing Finance Agency, both under executive control. Presumably, they could just redraft the PSPA.
Another $200 billion in demand may only lower MBS yields by 8 bp or less
Identifying the historical impact of another $200 billion in MBS demand is complicated by simultaneous changes in demand from other investors, in primary and secondary supply, and in market conditions including the shape of the yield curve and volatility. Nevertheless, the Federal Reserve staff in 2014 estimated the effect of QE on MBS yields during the Global Financial Crisis. That work concluded that each $50 billion invested by the Fed lowered MBS yields, all else equal, by 2 bp. The Fed’s cumulative investment of $1.21 trillion drove down yields by an estimated 55 bp. If Fannie Mae and Freddie Mac buying has the same impact as Fed buying, spreads should tighten 8 bp.
Investment from Fannie Mae, Freddie Mac or any other private portfolio, however, would likely have a smaller impact than investment from the Fed. The Fed has the unique ability to create new cash in the financial system with each purchase, driving up bank deposits, reserves or cash on other balance sheets. That cash, or a large portion of it, in turn, would likely get invested, driving up demand and further tightening spreads. With a private portfolio, that second round of demand does not show up.
Also, the Fed estimate of QE impact came in 2013, when the outstanding agency MBS market stood at $5.3 trillion. It currently stands at $9.3 trillion. The impact of any fixed amount of demand today is more diluted.
Wider swap spreads, higher volatility
Beyond impact on MBS, faster growth in the agency portfolios is also likely to show up in wider swap spreads and higher rate volatility. That is, if the portfolios hedge their portfolios as they have in the past.
Wider swap spreads follow from portfolio efforts to manage the duration of accumulating purchases. The current option-adjusted duration of a new 30-year 5.0% pass-through is 4.15 years, according to Bloomberg’s model, and a new 5.5% is 2.43 years. Assuming the portfolios would keep net duration around zero, that would involve paying in the swap market to offset the duration. The portfolios could also offset the duration by issuing debt.
Any pressure on swap spreads would likely come at different points along the yield curve as the portfolios pay fixed to neutralize some of their key rate duration. Key rate exposure arguably comes from 2-, 5-, 10- and 30-year rates, although amounts differ across coupons. A 30-year 5.0% pools, for instance, has its largest exposure to 10-year rates (Exhibit 3). A 30-year 5.5% pool, which is more exposed to prepayment and has shorter cash flows, has its largest exposure to 2-year rates.
Exhibit 3: Hedging pressure in swaps would come at different key rates
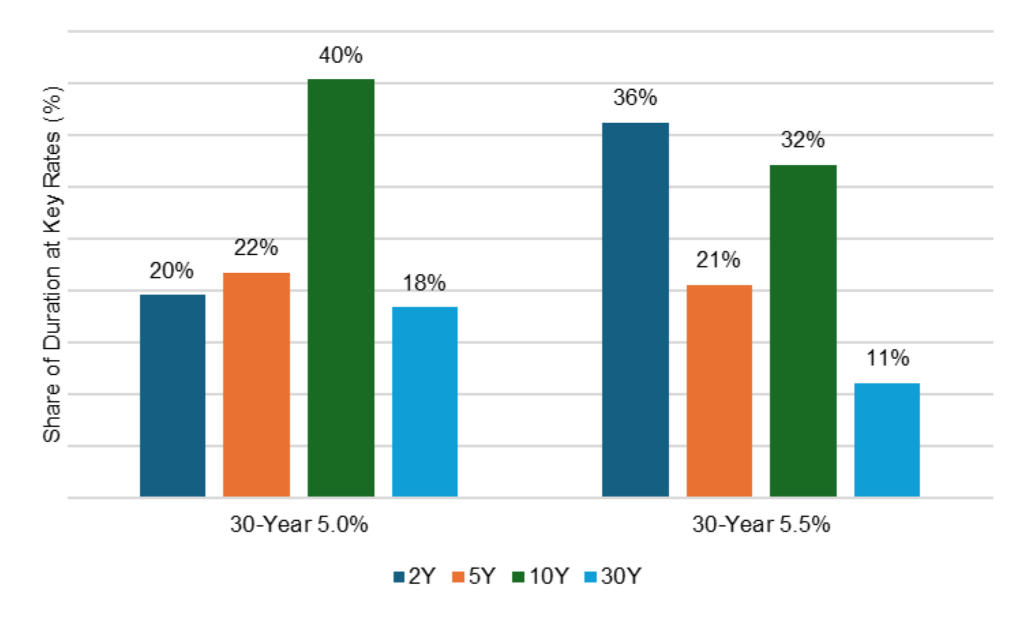
Source: Bloomberg, Santander US Capital Markets
Finally, faster growth would likely push up demand for swaptions, encourage the portfolios to issue more callable debt or require the portfolios to delta-hedge their position. After all, all MBS are short prepayment or call options to household borrowers. The portfolios either have to buy those options back in the swap or agency debt markets or recreate the options by delta-hedging. Either way, the volatility of MBS cash flows gets injected into other parts of fixed income.
Initial market response
In the immediate aftermath of the administration announcement, MBS outperformed its hedges and swap spreads in the long part of the yield curve widened. Both are directionally right. Further news from the administration or a change in the pace of Fannie Mae or Freddie Mac buying should determine how far the market moves.
* * *
The view in rates
It continues to seem better to own duration on the front of the yield curve than on the back, and the market has generally rewarded that position. The 2s10s Treasury slope broke out of its 50 bp to 60 bp range after the December FOMC and has traded as high as 71 bp in the last week, settling Friday at 63 bp. The back of the yield curve has to wrestle with Treasury supply and the prospect of weaker demand from Japan as yields on Japanese government bonds rise and draw demand away from Treasury debt.
Key market levels:
- Fed RRP balances settled on Friday at $3.3 billion as other repo rates offer much higher yields
- Setting on 3-month term SOFR traded Friday at 365 bp, down 4 bp since late December
- Further out the curve, the 2-year note traded Friday at 3.53%, up 5 bp since mid-December. The 10-year note traded at 4.16%, up 1 bp since mid-December
- The Treasury yield curve traded Friday with 2s10s at 63 bp, down 3 bp since mid-December. The 5s30s traded Friday at 106 bp, flatter by 7 bp
- Breakeven 10-year inflation traded Friday at 228 bp, up 4 bp since mid-December. The 10-year real rate finished the week at 186 bp, down 3 bp since mid-December
The view in spreads
For investment grade corporate debt, the challenge next year looks like a sizable 9% to 11% jump in net supply in part to fund AI infrastructure. That could outstrip 5% to 7% growth in outstanding Treasury debt, widening the corporate-Treasury spread, and 2% growth in outstanding agency MBS, widening the corporate-MBS spread. Supply in MBS is even less after excluding Ginnie Mae custom pools, which are not included in the Bloomberg MBS index. The Bloomberg US investment grade corporate bond index OAS traded on Friday at 77 bp, tighter by 2 bp since mid-December. Nominal par 30-year MBS spreads to the blend of 5- and 10-year Treasury yields traded Friday at 94 bp, down by 21 bp since mid-December partly on lower volatility but sharply after the administration announced interest in having Fannie Mae and Freddie Mac buy $200 billion in MBS. Par 30-year MBS TOAS closed Friday at -1 bp, tighter by 17 bp largely on the administration announcement.
The view in credit
Bank lending to non-bank financial institutions, including private debt funds and business development companies, has expanded at an extraordinary pace in the last few years, raising the possibility that lending has outstripped experience and infrastructure for underwriting and monitoring. Bank regulators could ask banks next year to tap the breaks on that lending, tightening the private credit markets. Consumers in the lowest tier of income look vulnerable, and cuts to government programs next year should keep the pressure on. The balance sheets of smaller companies show signs of rising leverage and lower operating margins. Leveraged loans also are showing signs of stress, with the combination of payment defaults and liability management exercises, or LMEs, often pursued instead of bankruptcy, back to 2020 post-Covid peaks.