


The Big Idea
Heavy inflows to fixed income funds boost the MBS bid
Steven Abrahams | February 6, 2026
This material is a Marketing Communication and does not constitute Independent Investment Research.
Fixed income ETFs and mutual funds have seen $82 billion in inflows over the last four weeks, the heaviest in at least five years. And although most of the money still goes to ETFs and gets spread neutrally across the market, the asset allocation of mutual funds points to better demand for MBS and structured products. That should bolster the case for tighter MBS spreads and relatively strong MBS returns.
The latest inflows cap a year where taxable ETFs picked up $443 billion in new assets and taxable mutual funds picked up $132 billion for a joint $575 billion gain. That stands in fresh contrast to episodes of outflows in recent years. The Fed’s aggressive 2022 effort to counter inflation led to 425 bp of hikes and nearly a year of net outflows as poor bond market returns chased investors away—mutual funds taking most of the hit (Exhibit 1). Outflows hit again in late 2023 as rates took another leg higher and spreads widened. And last year the impact of rising rates in the aftermath of Liberation Day again triggered heavy outflows, again primarily from mutual funds, that reversed after the US put the most punitive tariffs on pause. Steadily declining interest rates over the last year and tightening spreads on MBS and credit have brought investors back.
Exhibit 1: Rolling 4-week inflows to fixed income ETFs, funds hits $82 billion
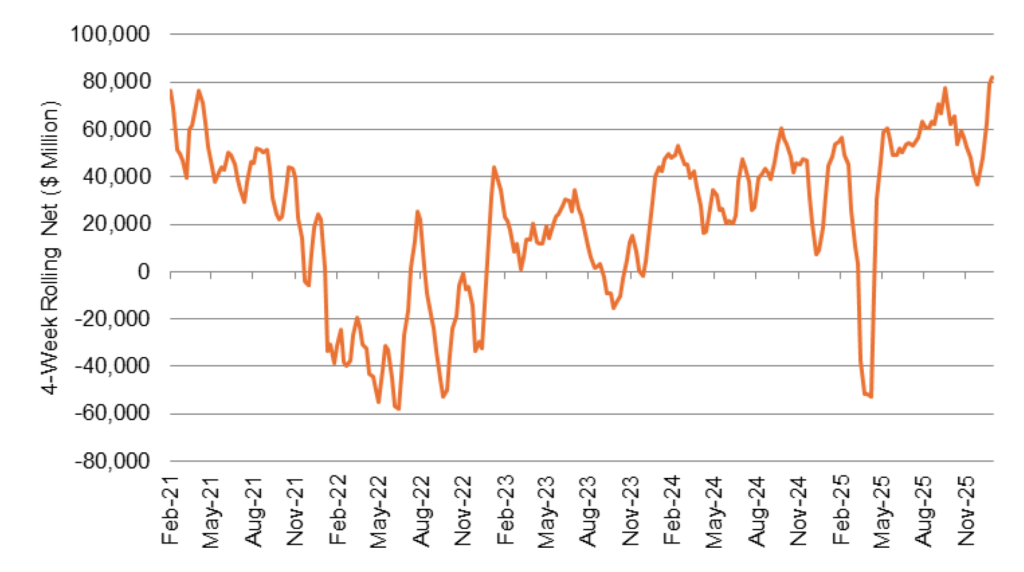
Source: Bloomberg, Santander US Capital Markets
Although ETFs still dominate fixed income inflows, the magnitude has weakened lately. ETFs have captured a median 71% of inflows in the last two years, but that has dropped lately to 55% (Exhibit 2). That likely signals a tilt toward individual retail investors, who tend to hold mutual funds rather than ETFs.
Exhibit 2: ETFs have captured a median 71% share of fixed income inflows
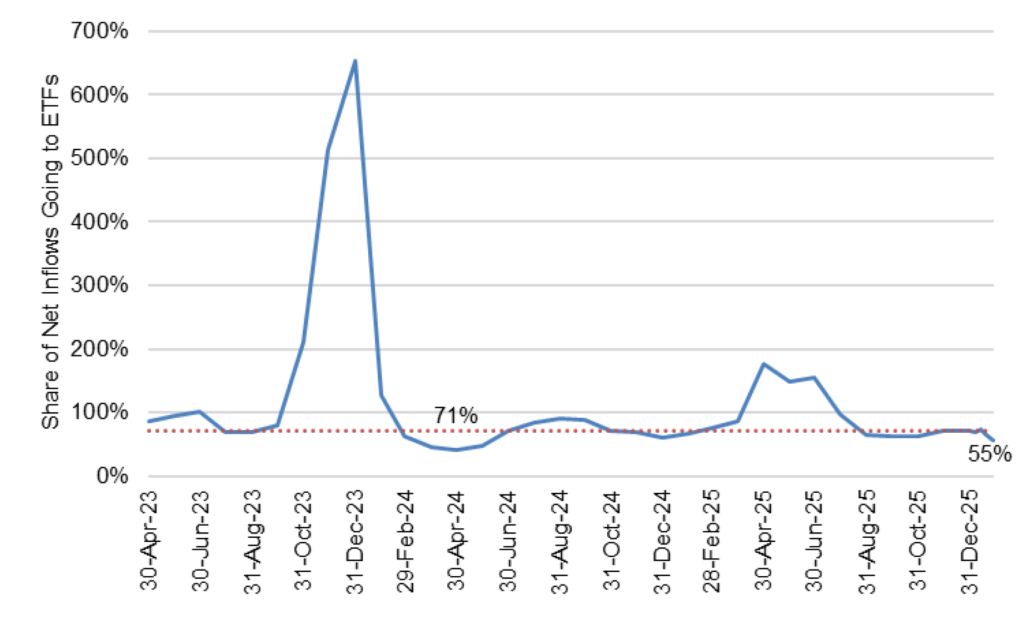
Note: The share of inflows going to ETFs has varied considerably over the last two years, especially in late 2023 and after Liberation Day when ETFs gained assets and mutual funds lost them, pushing ETF share well above 100%.
Source: ICI, Santander US Capital Markets.
To some extent, the source of the inflows could matter. If the new cash is coming out of bank accounts, then it indirectly may be reducing demand for assets typically held in bank portfolios, such as Treasury debt and agency MBS. If it is coming out of money market mutual funds, then it may be reducing demand for repo, Treasury bills and other instruments in money fund portfolios. The sources of the cash are unclear.
The reallocation of the cash matters, too. ETFs in aggregate should spread it in proportion to the current market value of index-eligible Treasury debt (48%), MBS and structured products (26%) and investment grade corporate debt (26%). That should have no marginal effect on spreads between sectors.
Although mutual funds could allocate according to current relative value, their most recent asset allocation is probably a good guide to where the cash goes next. Based on the $1.5 trillion in aggregate assets held by 43 US mutual funds with $10 billion or more indexed to the Bloomberg aggregate, the cash looks most likely to go toward MBS and structured products. As of the most recent portfolio disclosures, which vary by fund from the end of September to the end of January, those funds were overweight MBS and structured products by 27 percentage points, neutral on corporate debt, slightly leveraged with a short position in cash of nine percentage points, and underweight 18 percentage points in government debt (Exhibit 3). Weighted by the amount of assets that each fund has either gained or lost over the last year, the results look qualitatively the same although the overweight in MBS rises to 35 percentage points.
Exhibit 3: Asset overweights (+) or underweights (-) compared to market index
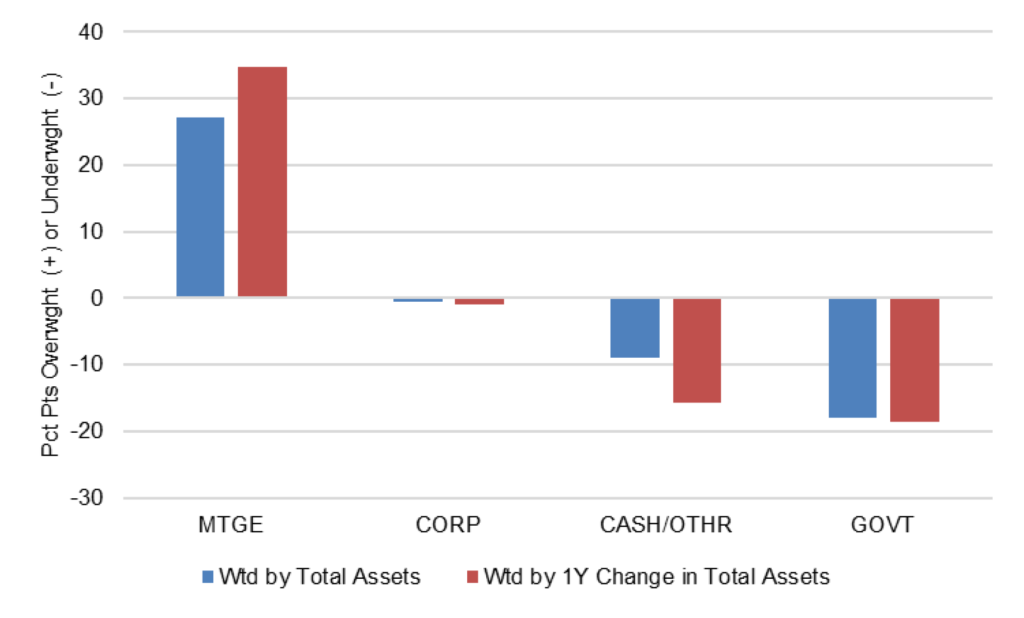
Note: Asset allocation in the 43 US-domiciled mutual funds with LBUSTRUU as primary benchmark, less than 5% in equity, and at least $10B in total assets. Allocation compared to AGG.
Source: Bloomberg, Santander US Capital Markets
It is widely reported that mutual funds sold agency MBS after the administration announced Fannie Mae and Freddie Mac would buy $200 billion in MBS. Despite the selling, it is likely that funds would still allocate within MBS and structured products, including to agency securities away from the agencies’ strongest bid, to non-agency MBS where spreads have followed agency MBS tighter, and to CMBS, ABS or CLOs that also get swept under the MBS umbrella in Bloomberg’s classification. True aggregate reallocation to corporate or government debt seems unlikely.
Besides strong MBS demand from active mutual funds and the agency portfolios, agency MBS is also getting a lift from low supply. The par value of the Bloomberg agency MBS index increased in January by only 10 bp (Exhibit 4). That compared to a rise of 47 bp in the par value of the investment grade corporate index and 74 bp in the Treasury index. Fresh demand from the agency investment portfolios and from active mutual funds is chasing a limited marginal supply of MBS.
Exhibit 4: Marginal MBS supply in January lagged corporate and Treasury debt
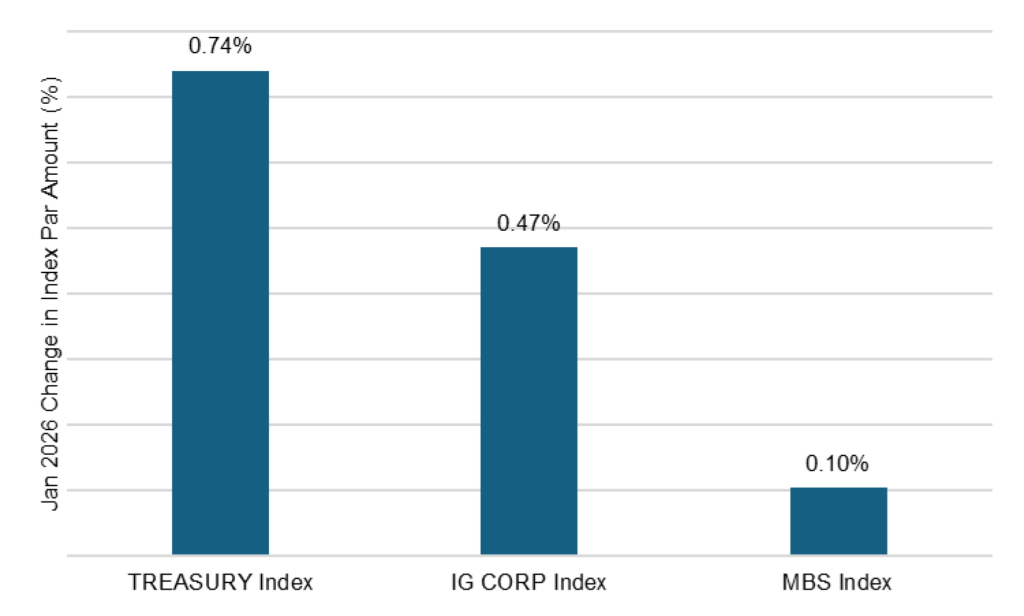
Source: Bloomberg, Santander US Capital Markets
If inflows continue to give active mutual funds more cash to deploy, the prospects look very good for option-adjusted spreads on MBS to continue tightening to the Treasury curve especially. The large mutual fund complexes are overweight MBS and structured product, neutral on corporate debt and underweight Treasury debt. That looks like a roadmap to positioning for excess return.
* * *
The view in rates
The front of the yield curve continues to look like the sweet spot for taking duration risk, with the 10-year and longer part of the curve vulnerable to both supply and demand surprises. On the supply side, the administration on January 8 proposed increasing the defense budget by 66% to $1.5 trillion. That should get resolved through the spring budget process but would boost deficits. The deficit also could rise if the Supreme Court rules against the administration on its Liberation Day tariffs. On the demand side, the recent rise in yields in Japan stands to trim incentives for Japan’s domestic portfolios to buy US Treasury debt. Japanese debt now offers higher yield that Treasury debt after hedging foreign exchange risk. Since Japan is the single largest foreign holder of Treasury debt, that could matter.
The 2s10s Treasury slope traded Friday at 71 bp, nearly the steepest slope in a year, with 5s30s at 110 bp. The news of the administration’s nomination of Kevin Warsh for Fed chair helped shorter maturities rally with longer maturities unchanged.
Key market levels:
- Fed RRP balances settled on Friday at $3.1 billion, the facility’s 3.50% yield running well below SOFR’s alternative 3.65%
- Setting on 3-month term SOFR traded Friday at 366 bp, unchanged in the last week
- Further out the curve, the 2-year note traded Friday at 3.49%, down 3 bp in the last week. The 10-year note traded at 4.20%, down 4 bp in the last week
- The Treasury yield curve traded Friday with 2s10s at 71 bp, flatter by 1 bp week-over-week. The 5s30s traded Friday at 110 bp, steeper by 2 bp
- Breakeven 10-year inflation traded Friday at 233 bp, down 1 bp in the last week. The 10-year real rate finished the week at 188 bp, down 2 bp in the last week
The view in spreads
Risk assets have taken their lead in the last few weeks from the administration’s January 8 announcement that Fannie Mae and Freddie Mac would buy $200 billion in MBS. That immediately tightened the option-adjusted spread on the MBS index by 8 bp, and credit began tightening in the aftermath.
Investment grade credit still faces a challenge this year from a sizable 9% to 11% jump in net supply in part to fund AI infrastructure. That could outstrip 5% to 7% growth in outstanding Treasury debt, widening the corporate-Treasury spread, and 2% growth in outstanding agency MBS, widening the corporate-MBS spread. Supply in MBS is even less after excluding Ginnie Mae custom pools, which are not included in the Bloomberg MBS index.
The Bloomberg US investment grade corporate bond index OAS traded on Friday at 75 bp, wider by 2 bp in the last week. Nominal par 30-year MBS spreads to the blend of 5- and 10-year Treasury yields traded Friday at 101 bp, wider by 2 bp. Par 30-year MBS TOAS closed Friday at 8 bp, unchanged week-over-week.
The view in credit
Bank lending to non-bank financial institutions, including private debt funds and business development companies, has expanded at an extraordinary pace in the last few years, raising the possibility that lending has outstripped experience and infrastructure for underwriting and monitoring. Bank regulators continue to focus on that category of lending, which could eventually tighten the private credit markets. The balance sheets of smaller companies show signs of rising leverage and lower operating margins. Leveraged loans also are showing signs of stress, with the combination of payment defaults and liability management exercises, or LMEs, often pursued instead of bankruptcy, back to 2020 post-Covid peaks.
Consumer credit in the lowest tier of income continue to look vulnerable, and cuts to government programs this year should keep the pressure on.