


The Big Idea
Different paths, different prospects for credits large and small
Steven Abrahams and Dan Bruzzo, CFA | August 8, 2025
This material is a Marketing Communication and does not constitute Independent Investment Research.
Large credits and small credits have taken different paths ever since the Fed first lifted rates in 2022. Large credits have grown earnings faster, deleveraged more, added liquidity equally, improved margins faster and had these fundamentals recognized by equity markets and rating agencies. But debt spreads do not seem to make the same, clear distinctions. Spreads on larger credits have done only modestly better than spreads on smaller. For defensive investors especially, relative value tilts toward migrating from smaller to larger names without necessarily giving up much spread at all.
A source of big picture fundamentals
It is hard to get the big picture on credit fundamentals, but equity indices offer a very accessible picture of corporate balance sheets. The members, after all, report publicly every quarter. The S&P 500 and the Russell 2000 split the equity world by size. The average S&P 500 member has a market capitalization of $112 billion, and the average Russell 2000 member has a market capitalization of $1.5 billion. Large and small. There’s obviously a distribution around each average, but the difference across those indices points in the right direction.
Widening fundamental differences across large, small companies
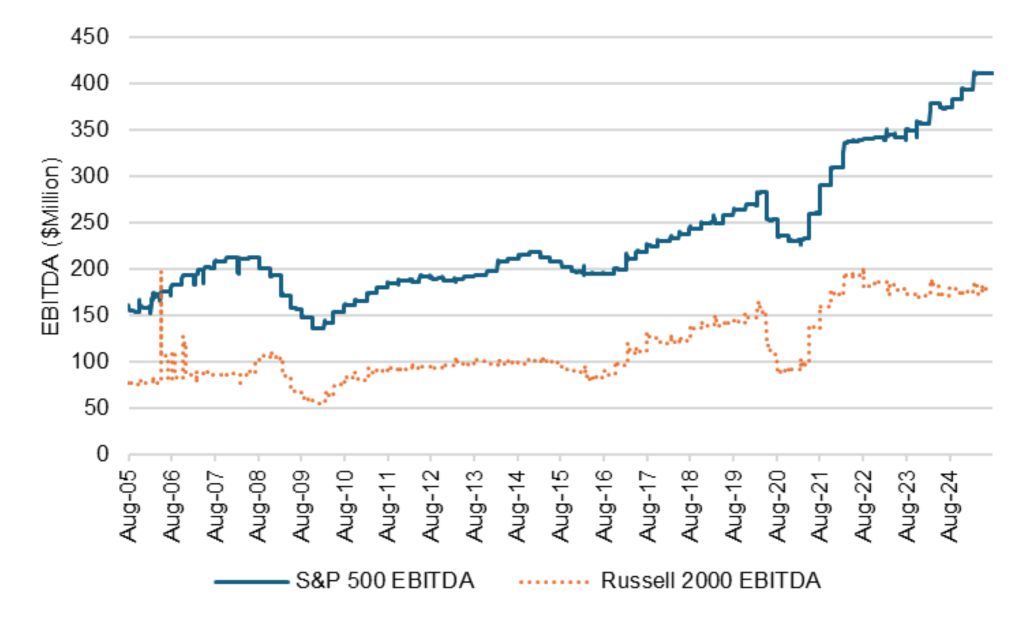
Those indices immediately put a spotlight on big differences in earnings. Earnings for the S&P 500 and the Russell 2000 moved in rough parallel from at least mid-2005 into mid-2022 with the Russell earnings actually growing faster (Exhibit 1). But in mid-2022, something changed. S&P 500 earnings have since gone up 21%, Russell 2000 earnings down 12%.
Exhibit 1: S&P 500 and Russell 2000 earnings have diverged since mid-2022
Source: Bloomberg, Santander US Capital Markets
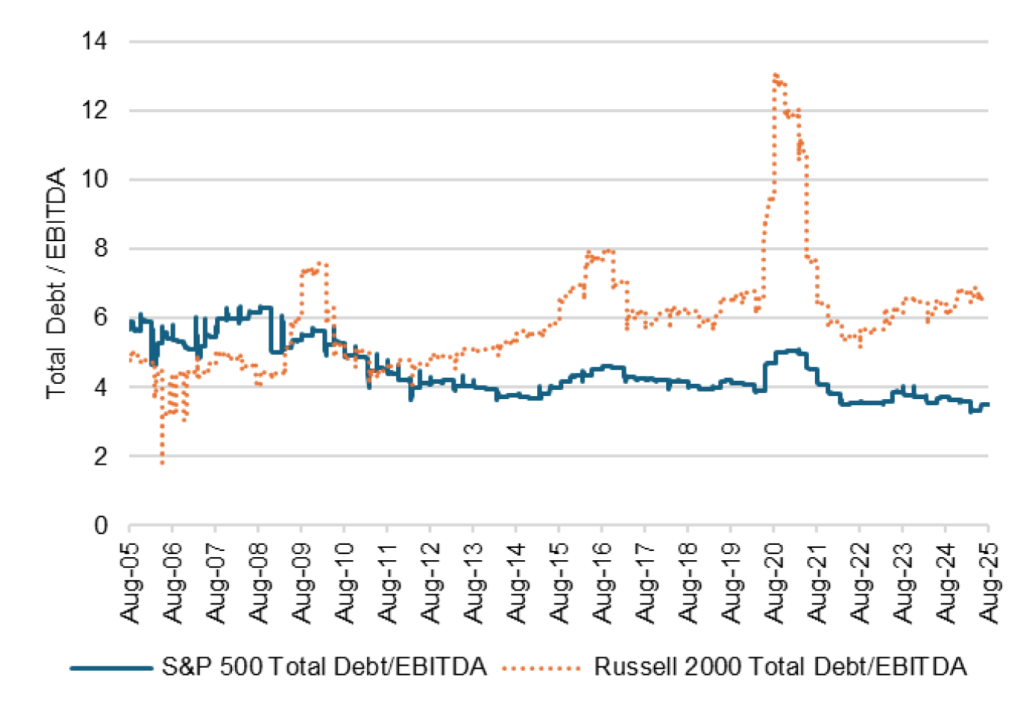
Differences in earnings not surprisingly have contributed to differences in balance sheet leverage. The S&P 500 names have generally deleveraged for the last 20 years while the Russell 2000 names have added leverage (Exhibit 2). The difference has widened since mid-2022 with debt-to-EBITDA in the S&P 500 down 2% and in the Russell 2000 up 28%.
Exhibit 2: Leverage falls across the S&P 500, rises across the Russell 2000
Source: Bloomberg, Santander US Capital Markets
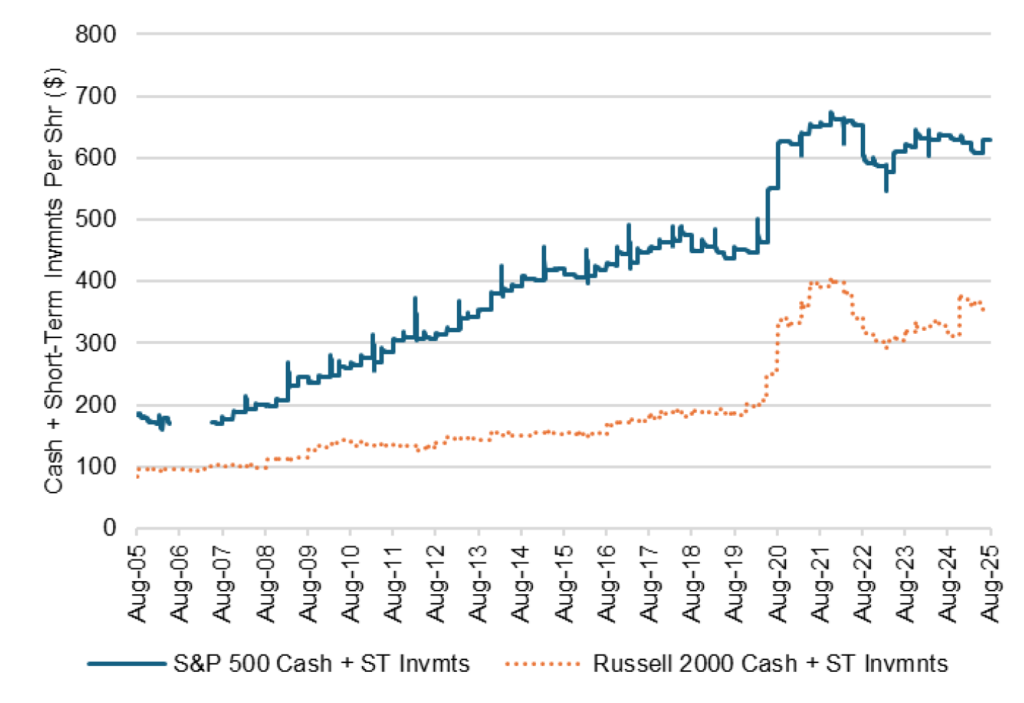
Balance sheet liquidity in the form of cash or short-term securities per share differed more before Covid than after. Companies in the S&P 500 built liquidity much faster than in the Russell 2000 until Covid and then the smaller companies closed the gap (Exhibit 3). From roughly 2014 through 2018, larger companies held more than 2.5 times the liquidity per share as smaller. But in 2020 that declined to less than 2 times and the proportional gap has remained there or dropped further since. Large companies still have more liquidity than small.
Exhibit 3: S&P 500 companies have more liquidity though the proportion shifts
Source: Bloomberg, Santander US Capital Markets
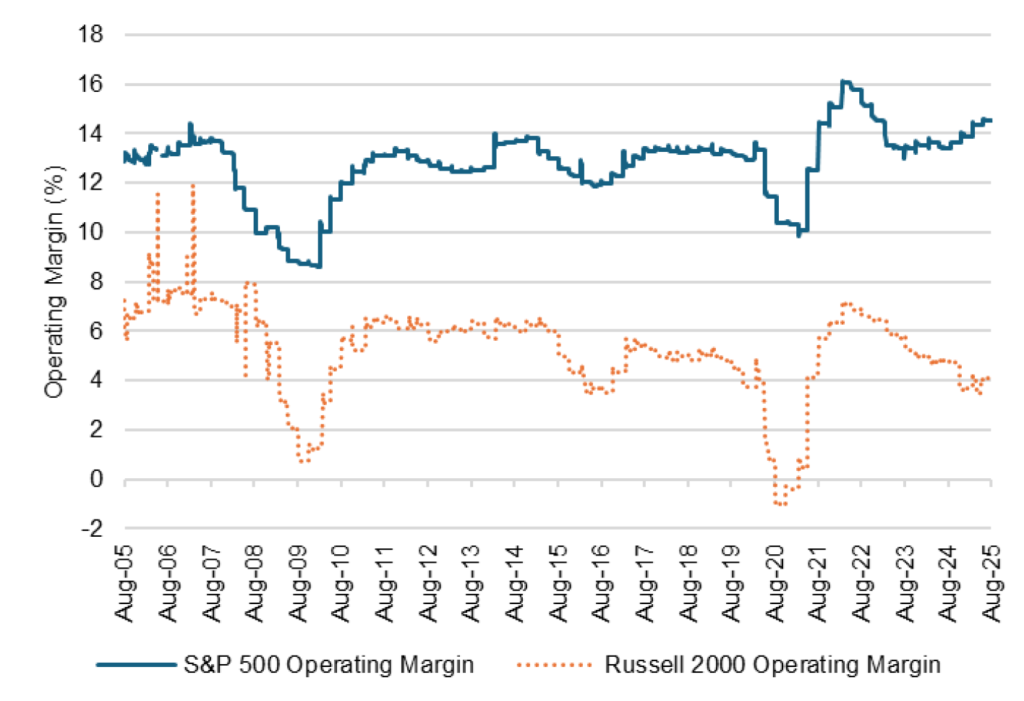
Operating margins have also headed in opposite directions. Margins at large and small companies roughly tracked each other before 2022 with smaller companies lagging slightly (Exhibit 4). In mid-2022 again, something happened. Margins at large companies initially declined before rebounding in the last year while margins at small companies declined and kept on going. Since mid-2022, margins at S&P 500 companies are down 8%, at Russell 2000 companies down 40%.
Exhibit 4: Rising margins lately at S&P 500 companies, falling at Russell 2000
Source: Bloomberg, Santander US Capital Markets
Equity markets and rating agencies have noticed
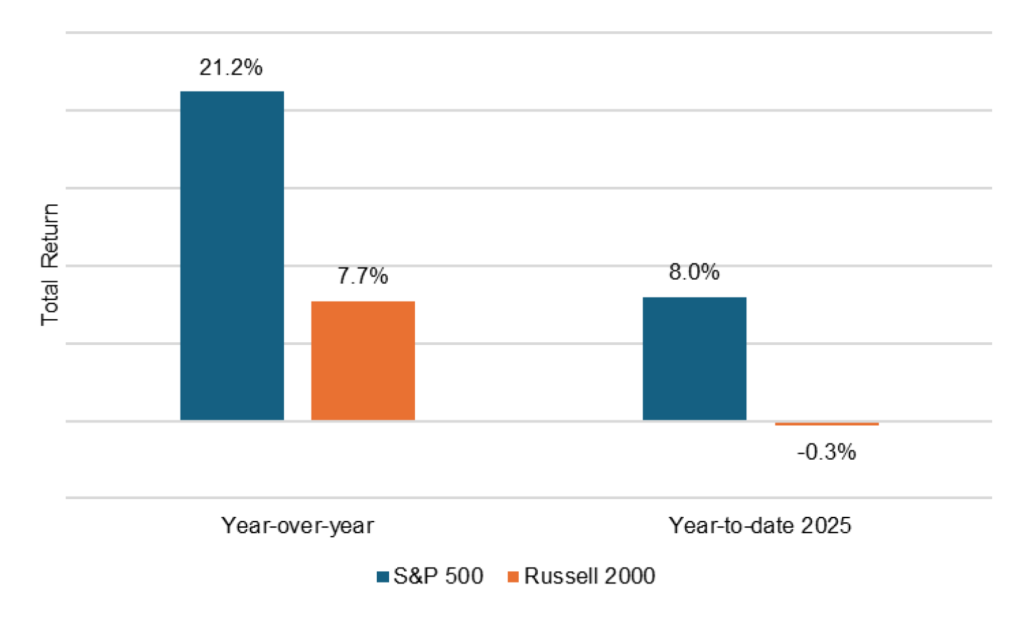
One longstanding predictor of credit quality (for example, here) is equity market returns. Better returns, better fundamental credit. Again, a clear difference in at least the last year in returns on larger and smaller companies. Over last year, the S&P 500 has returned 21.2% and the Russell 2000 7.7% (Exhibit 5). Year-to-date, with all the changes that have come with the new administration, the S&P 500 is up 8.0% and the Russell 2000 down 0.3%. Equity returns seem to imply better prospects for large than small companies.
Exhibit 5: Equity market imply better prospects for large than small companies
Source: Bloomberg, Santander US Capital Markets
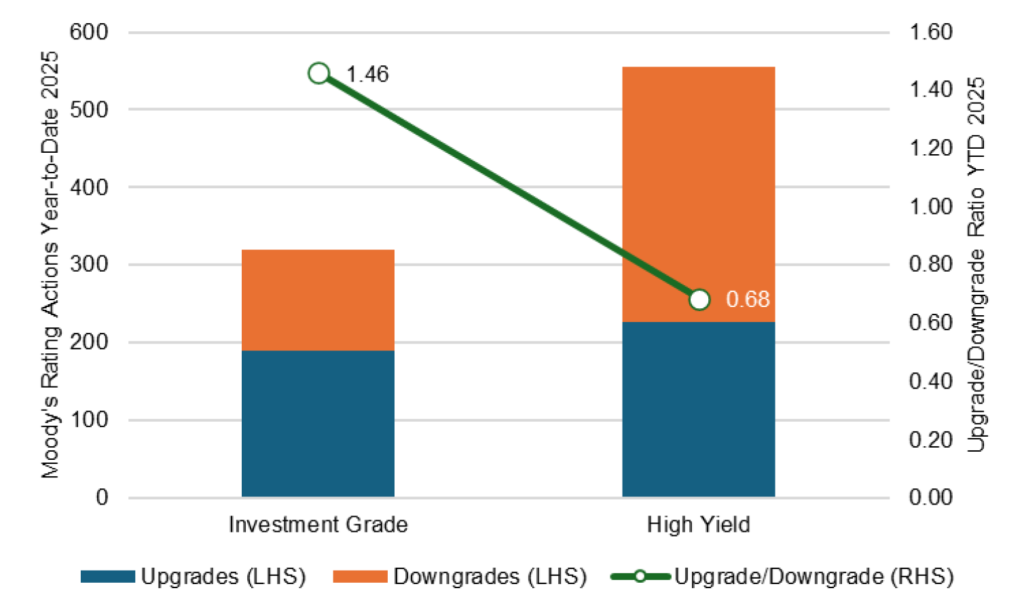
Differences in company size do not always translate into differences in rating, but larger companies with diversified bases of customers, suppliers and revenues along with appropriately leveraged balance sheets tend to be investment grade. Smaller companies with less room to diversify and more leverage tend to be high yield. That makes it interesting to look at rating agency actions so far this year. Moody’s has upgraded 190 investment grade names and downgraded 130 for a ratio of 1.45:1 (Exhibit 6). By comparison, it has upgraded 226 high yield names and downgraded 330 for a ratio of 0.68:1. Rating agency views of credit across the segments seemed headed in opposite directions.
Exhibit 6: More positive ratings actions in investment grade than high yield
Source: Bloomberg, Santander US Capital Markets
Spreads between investment grade and high yield
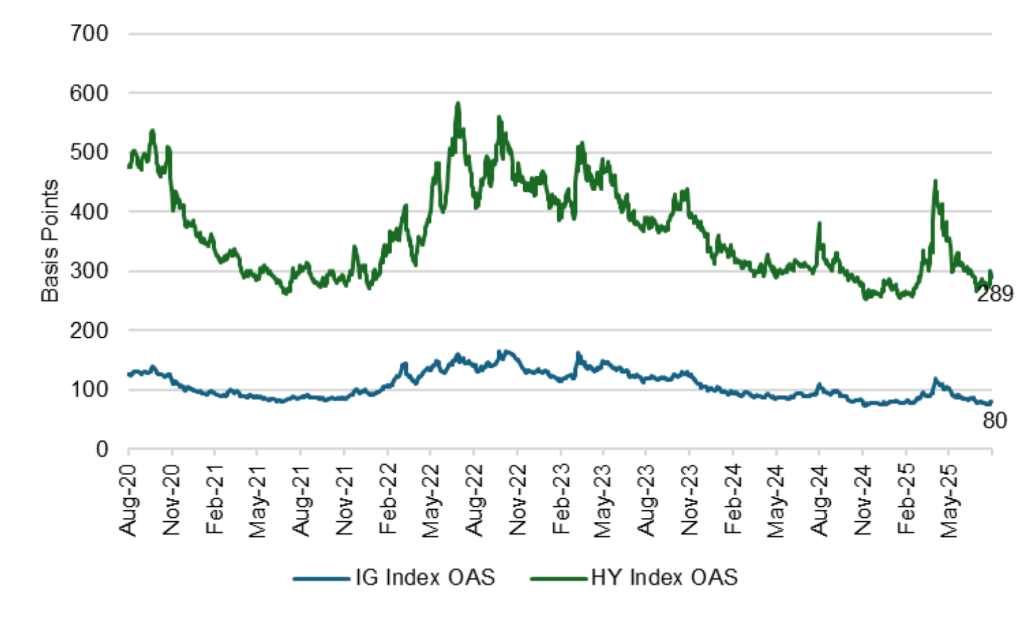
The fundamentals for large (IG) companies might justify current spreads at the 7th percentile of its 5-year range, but it is harder to justify small companies (HY) at the 18th percentile of its 5-year range (Exhibit 7). All else equal, own the debt of larger companies, not smaller companies.
Exhibit 7: Investment grade sits at the 7th percentile, high yield at the 18th
Source: Bloomberg, Santander US Capital Markets
Opportunities to go up-in-quality based on size
The reasons for the different prospects of large and small credits almost certainly revolves around the greater diversification and scale of larger names, all else equal. Typically that means greater diversification in customers, suppliers, market segments, geography and revenues. Larger companies by definition also have greater scale, lowering marginal fixed costs and often broadening the range of available resources. As US policy starts to remake global trade flows, diversification should definitely help. Size could cut both ways, limiting company ability to change quickly but giving it more resources to do that if company culture allows. On balance, size is probably a net good.
The total amount of debt issued by any subsector of the investment grade index broadly tracks the size of the companies in the subsector. Based on current size and spreads, a few ways stand out to migrate from the debt of smaller to larger companies (Exhibit 8):
- From REITs at a 79 bp OAS into banking at a 73 bp OAS
- From natural gas at 98 bp OAS into 96 bp OAS
- From basic materials at 89 bp OAS to energy at 96 bp OAS
Exhibit 8: Size, spread and relative value across the investment grade index
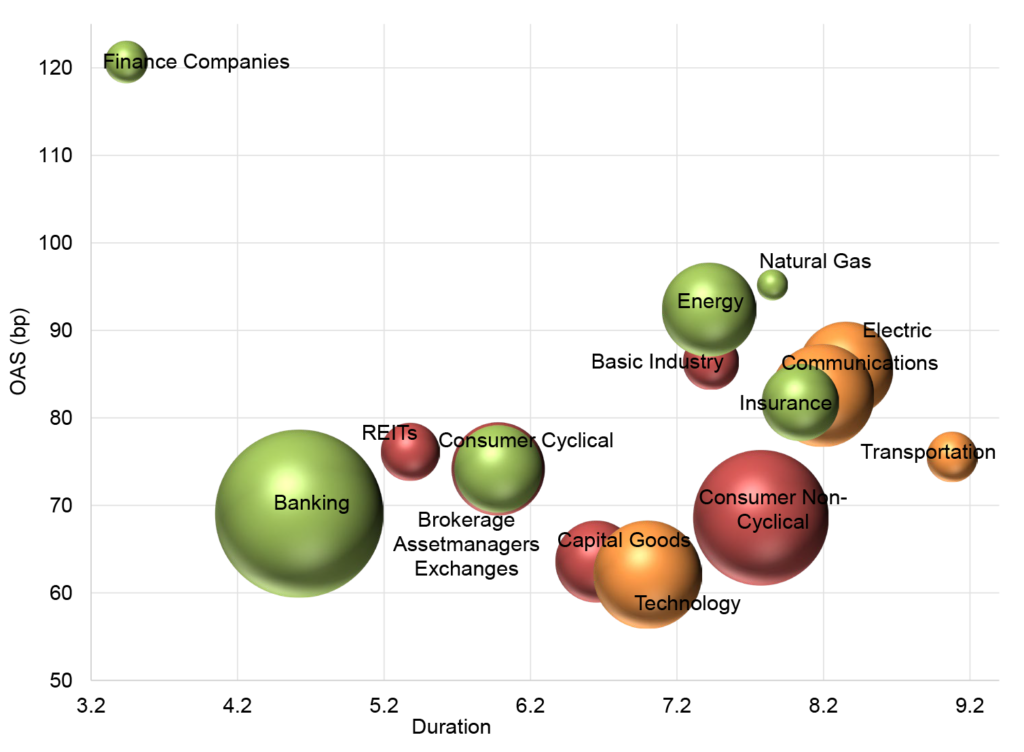
Source:Santander US Capital Markets LLC, Bloomberg/Barclays US Corp Index. Color = recommendation: Green – stronger relative value, Red – weaker relative value, Yellow – neutral relative value. Size = Market Value within the IG Index
With most economists projecting a slowing economy as both restrictive monetary policy and tariffs weigh on growth, going from smaller to larger names is a way to play defense without losing significant spread.
* * *
The view in rates
The fed funds market has changed little in the last week. The weak July employment report and its now infamous heavy downward revisions to May and June payrolls led the market to price in another 15 bp of easing by the end of the year, leaving fed funds priced at 3.73%. Little has changed since. That is roughly 14 bp below the Fed’s June dots. The market is undoubtedly looking at the Bowman and Waller dissents at the last FOMC and the Kugler resignation on Friday and seeing a board with economic and political reasons to get easier. On the other hand, the first signs of tariffs in the inflation numbers also showed up in June, and the possibility of a fresh round of tariffs could give inflation momentum. The Fed is not off the hook yet and still has to navigate possible stagflation.
Other key market levels:
- Fed RRP balances settled on Friday at $80 billion, down $17 billion on the week
- Setting on 3-month term SOFR closed Friday at 423 bp, down 7 bp in the last week and the biggest move since Liberation Day
- Further out the curve, the 2-year note traded Friday at 3.76%, up 11 bp in the last week. The 10-year note traded at 4.28%, up 6 bp in the last week.
- The Treasury yield curve traded Friday with 2s10s at 52 bp, flatter by 1 bp in the last week. The 5s30s traded Friday at 102 bp, flatter by 5 bp over the same period
- Breakeven 10-year inflation traded Friday at 240 bp, up 7 bp in the last week. The 10-year real rate finished the week at 188 bp, up 1 bp in the last week.
The view in spreads
Spreads look relatively tight against the Treasury curve. That seems to give a lot of weight to a benign outcome to the tariff standoff between the US and dozens of its trading partners. That helps risk assets continue to hold their ground against the Treasury curve. Net supply is also light, or in the case of investment grade corporate debt, negative. The Bloomberg US investment grade corporate bond index OAS traded on Friday at 78 bp, wider by 2 bp in the last week. Nominal par 30-year MBS spreads to the blend of 5- and 10-year Treasury yields traded Friday at 140 bp, tighter by 7 bp in the last week. Par 30-year MBS TOAS closed Friday at 32 bp, tighter by 3 bp in the last week.
The view in credit
A wide range of specific industries and individual companies still have exposure to tariff risk, but fundamentals for the average of the distribution continue to look stable. Most investment grade corporate and most consumer balance sheets have fixed-rate funding so falling rates have limited immediate effect. Consumer debt service coverage is roughly at 2019 levels. However, serious delinquencies in FHA mortgages and in credit cards held by consumers with the lowest credit scores have been accelerating. Consumers in the lowest tier of income look vulnerable, and renewed student payments and cuts to government programs should keep the pressure on. The balance sheets of smaller companies show signs of rising leverage and lower operating margins. Leveraged loans also are showing signs of stress, with the combination of payment defaults and liability management exercises, or LMEs, often pursued instead of bankruptcy, back to 2020 post-Covid peaks. If the Fed only eases slowly this year, fewer leveraged companies will be able to outrun interest rates, and signs of stress should increase. LMEs are very opaque transactions, so a material increase could make important parts of the leveraged loan market hard to evaluate.