The Big Idea
Growth in corporate debt accelerates
This material is a Marketing Communication and does not constitute Independent Investment Research.
The first numbers on growth this year in all forms of US debt show nonfinancial corporate debt not only outstripping its pace in recent years but even topping growth in US Treasury debt. New tax incentives for capital investment and the race for AI supremacy are likely behind it. Although the average investment grade corporate bond nevertheless trades near the tightest spread to the Treasury curve since the late 1990s, technology has lagged significantly. It may take time to change that.
Part of the story of the first quarter and likely first half of the year is the extraordinary growth in outstanding US nonfinancial corporate debt and the pressure that has put on debt spreads. The Fed’s Financial Accounts of the United States, released June 11, showed nonfinancial corporate debt up in the first quarter by an annualized 8.8% (Exhibit 1). Corporate bonds grew by 6.1% to $8.0 trillion and corporate loans grew by 12.3% to $5.5 trillion. That combined growth outstripped the pace in federal government debt for the first time in years and—depending on the year—was two to four times the rate of growth in nonfinancial corporate debt in trailing years.
Exhibit 1: Nonfinancial corporate debt led growth in the first quarter this year
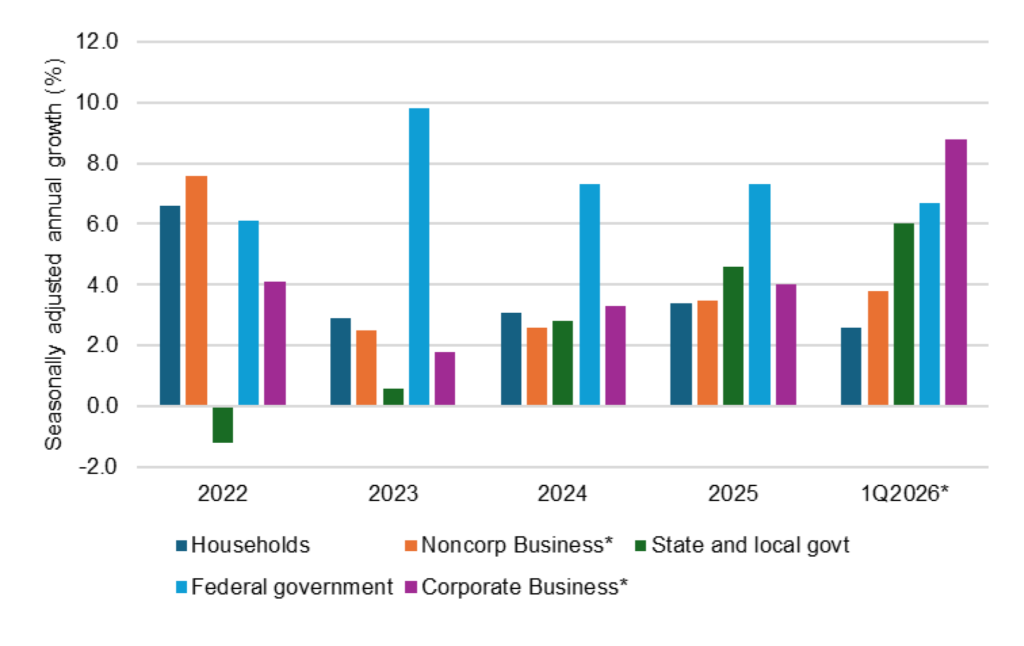
Note: Business debt shown here includes publicly traded and privately owned nonfinancial businesses.
Source: Federal Reserve, Santander US Capital Markets
At least two things have changed this year:
- The One Big Beautiful Bill Act’s new incentives for capital investment
- The frenzied buildout of AI and technology infrastructure
The OBBBA made some provisions permanent and temporarily expanded others allowing businesses this year to start deducting 100% of the cost of machinery, equipment, software and certain property the year they go into service. Coincidentally or not, bank commercial and industrial lending started accelerating sharply in January as businesses arguably started looking to fund capital investments. That jump in C&I lending certainly is consistent with the first quarter rise in loans to nonfinancial corporate business.
The funding of data centers and related technology has also accelerated this year, with a handful of companies—Alphabet (Google), Amazon, Meta, Microsoft and Oracle—trying to fund an expected $656 billion of capital expenses. These companies and others have tapped US investment grade and high yield bond markets, leveraged loans, private debt, ABS and CMBS for debt funding. That is consistent with the first quarter rise in bond debt.
Although spreads in corporate bank debt are not visible, spreads in corporate bond debt are and they show notable weakness in technology. As Dan Bruzzo points out, aggregate investment grade spreads to the Treasury curve now trade within a few basis points of their tightest levels ever. Converting the spread of each investment grade debt sector into a standard deviation from the index highlights the widening in technology starting last fall and continuing this year. The sector’s option-adjusted spread now trades 2.6 standard deviations above its average OAS to the investment grade index over the last five years.
Exhibit 2: Technology has significantly lagged other investment grade sectors
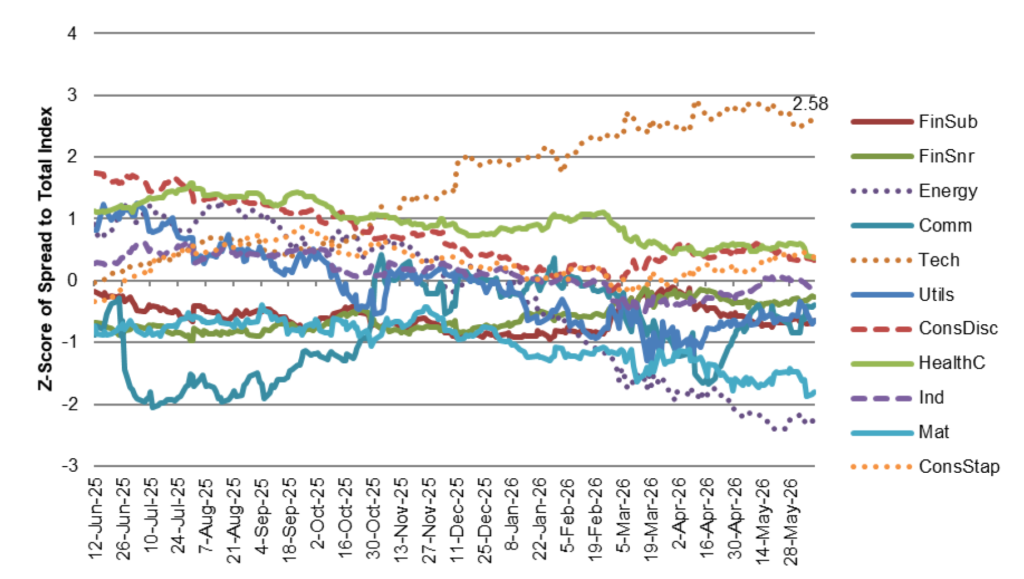
Note: Data shows the standard deviation of each investment grade sector OAS to its average OAS against the investment grade index.
Source: Bloomberg, Santander US Capital Markets
Although the wider spread in technology company bond debt is certainly consistent with supply pressure, other influences are almost certainly at play. Advances in AI have raised the possibility that some legacy technology companies will lose some or all of their market to native AI startups, to their customers’ decisions to take application development in house using AI, or to both. Although it is far too early to know the answer, the concern has contributed to the wider technology spreads.
Growth in outstanding debt encouraged by tax incentives and by historic capital investment in AI is almost certain to continue into 2027 and possibly 2028 and keep spread pressure on technology debt. Investors in that sector today will need to have patience through its likely underperformance against other parts of the investment grade index. There should come a day where tax incentives and the race for AI supremacy slow the rate of corporate debt growth generally and technology debt in particular. At that point, the supply pressure on technology debt spreads should ease.
* * *
The view in rates
The market for now has concluded that the Fed will start hiking within the next seven months, pushing rates up and flattening the yield curve. The very front end of the curve is probably stuck at a floor of 4.00% or higher through 2026 depending on US-Iran and expected short-term inflation. The 10-year note continues to look like it will spend more time above 4.40% than below it for the balance of the year. It would take a credible ceasefire in the Middle East and concrete steps toward a lasting agreement between the US and Iran for 10-year yields to drop below 4.40%.
Key market levels:
- Setting on 3-month term SOFR traded Friday at 366 bp
- Further out the curve, the 2-year note traded Friday at 4.09, down 7 bp over the week. The 10-year note traded at 4.48%, also down 7 bp.
- The Treasury yield curve traded Friday with 2s10s at 40 bp, steeper by 2 bp over the last week, with 5s30s at 76 bp, steeper by 4 bp
- Breakeven 10-year inflation traded Friday at 232 bp, down 4 bp over the last week, with 5-year forward 5-year breakeven at 221 bp, down 1 bp and still signaling confidence that the Fed target still holds. The 10-year real rate finished the week at 215 bp, down 3 bp over the last week.
The view in spreads
The supply and demand balance looks constructive for MBS and a little less so for corporate debt, especially technology debt. MBS net supply continues to run very low while Fannie Mae and Freddie Mac continue to add to their mortgage portfolios. Insurers continue to issue annuities and buy corporate and structured credit, but credit is facing significant needs to finance capital investment and the current AI buildout. MBS spreads should be able to hold their ground in most circumstances, but credit spreads look soft depending on the volume of net issuance.
The Bloomberg US investment grade corporate bond index OAS traded on Friday at 73 bp, wider by 1 bp from last week. Nominal par 30-year MBS spreads to the blend of 5- and 10-year Treasury yields traded Friday at 108 bp, tighter by 3 bp in the last week. Par 30-year MBS TOAS closed Friday at 19 bp, tighter by 4 bp in the last week.
The view in credit
Haves and have nots continue. Big companies have healthier balance sheets than smaller companies. Consumers at the middle-to-higher end of the income distribution also have liquidity and wealth. Bank lending to non-bank financial institutions, including private debt funds and business development companies continues to expand. Bank regulators continue to focus on that category of lending, which could eventually tighten the private credit markets. But for now, credit metrics for NBFI lending are strong relative to traditional bank lending such as C&I.
This material is intended only for institutional investors and does not carry all of the independence and disclosure standards of retail debt research reports. In the preparation of this material, the author may have consulted or otherwise discussed the matters referenced herein with one or more of SCM’s trading desks, any of which may have accumulated or otherwise taken a position, long or short, in any of the financial instruments discussed in or related to this material. Further, SCM may act as a market maker or principal dealer and may have proprietary interests that differ or conflict with the recipient hereof, in connection with any financial instrument discussed in or related to this material.
This message, including any attachments or links contained herein, is subject to important disclaimers, conditions, and disclosures regarding Electronic Communications, which you can find at https://portfolio-strategy.apsec.com/sancap-disclaimers-and-disclosures.
Important Disclaimers
Copyright © 2026 Santander US Capital Markets LLC and its affiliates (“SCM”). All rights reserved. SCM is a member of FINRA and SIPC. This material is intended for limited distribution to institutions only and is not publicly available. Any unauthorized use or disclosure is prohibited.
In making this material available, SCM (i) is not providing any advice to the recipient, including, without limitation, any advice as to investment, legal, accounting, tax and financial matters, (ii) is not acting as an advisor or fiduciary in respect of the recipient, (iii) is not making any predictions or projections and (iv) intends that any recipient to which SCM has provided this material is an “institutional investor” (as defined under applicable law and regulation, including FINRA Rule 4512 and that this material will not be disseminated, in whole or part, to any third party by the recipient.
The author of this material is an economist, desk strategist or trader. In the preparation of this material, the author may have consulted or otherwise discussed the matters referenced herein with one or more of SCM’s trading desks, any of which may have accumulated or otherwise taken a position, long or short, in any of the financial instruments discussed in or related to this material. Further, SCM or any of its affiliates may act as a market maker or principal dealer and may have proprietary interests that differ or conflict with the recipient hereof, in connection with any financial instrument discussed in or related to this material.
This material (i) has been prepared for information purposes only and does not constitute a solicitation or an offer to buy or sell any securities, related investments or other financial instruments, (ii) is neither research, a “research report” as commonly understood under the securities laws and regulations promulgated thereunder nor the product of a research department, (iii) or parts thereof may have been obtained from various sources, the reliability of which has not been verified and cannot be guaranteed by SCM, (iv) should not be reproduced or disclosed to any other person, without SCM’s prior consent and (v) is not intended for distribution in any jurisdiction in which its distribution would be prohibited.
In connection with this material, SCM (i) makes no representation or warranties as to the appropriateness or reliance for use in any transaction or as to the permissibility or legality of any financial instrument in any jurisdiction, (ii) believes the information in this material to be reliable, has not independently verified such information and makes no representation, express or implied, with regard to the accuracy or completeness of such information, (iii) accepts no responsibility or liability as to any reliance placed, or investment decision made, on the basis of such information by the recipient and (iv) does not undertake, and disclaims any duty to undertake, to update or to revise the information contained in this material.
Unless otherwise stated, the views, opinions, forecasts, valuations, or estimates contained in this material are those solely of the author, as of the date of publication of this material, and are subject to change without notice. The recipient of this material should make an independent evaluation of this information and make such other investigations as the recipient considers necessary (including obtaining independent financial advice), before transacting in any financial market or instrument discussed in or related to this material.
Important disclaimers for clients in the EU and UK
This publication has been prepared by Trading Desk Strategists within the Sales and Trading functions of Santander US Capital Markets LLC (“SanCap”), the US registered broker-dealer of Santander Corporate & Investment Banking. This communication is distributed in the EEA by Banco Santander S.A., a credit institution registered in Spain and authorised and regulated by the Bank of Spain and the CNMV. Any EEA recipient of this communication that would like to affect any transaction in any security or issuer discussed herein should do so with Banco Santander S.A. or any of its affiliates (together “Santander”). This communication has been distributed in the UK by Banco Santander, S.A.’s London branch, authorised by the Bank of Spain and subject to regulatory oversight on certain matters by the Financial Conduct Authority (FCA) and the Prudential Regulation Authority (PRA).
The publication is intended for exclusive use for Professional Clients and Eligible Counterparties as defined by MiFID II and is not intended for use by retail customers or for any persons or entities in any jurisdictions or country where such distribution or use would be contrary to local law or regulation.
This material is not a product of Santander´s Research Team and does not constitute independent investment research. This is a marketing communication and may contain ¨investment recommendations¨ as defined by the Market Abuse Regulation 596/2014 ("MAR"). This publication has not been prepared in accordance with legal requirements designed to promote the independence of research and is not subject to any prohibition on dealing ahead of the dissemination of investment research. The author, date and time of the production of this publication are as indicated herein.
This publication does not constitute investment advice and may not be relied upon to form an investment decision, nor should it be construed as any offer to sell or issue or invitation to purchase, acquire or subscribe for any instruments referred herein. The publication has been prepared in good faith and based on information Santander considers reliable as of the date of publication, but Santander does not guarantee or represent, express or implied, that such information is accurate or complete. All estimates, forecasts and opinions are current as at the date of this publication and are subject to change without notice. Unless otherwise indicated, Santander does not intend to update this publication. The views and commentary in this publication may not be objective or independent of the interests of the Trading and Sales functions of Santander, who may be active participants in the markets, investments or strategies referred to herein and/or may receive compensation from investment banking and non-investment banking services from entities mentioned herein. Santander may trade as principal, make a market or hold positions in instruments (or related derivatives) and/or hold financial interest in entities discussed herein. Santander may provide market commentary or trading strategies to other clients or engage in transactions which may differ from views expressed herein. Santander may have acted upon the contents of this publication prior to you having received it.
This publication is intended for the exclusive use of the recipient and must not be reproduced, redistributed or transmitted, in whole or in part, without Santander’s consent. The recipient agrees to keep confidential at all times information contained herein.