


The Big Idea
Lending into private credit markets continues to shape banks
Steven Abrahams | February 27, 2026
This material is a Marketing Communication and does not constitute Independent Investment Research.
Banks these days are posting some of the fastest asset growth in years, and most of it comes from lending into private credit markets and from traditional business loans. The growth in credit is almost certainly pulling along bank demand for securities to help keep the balance sheet liquid and to offset the risk capital consumed by the growing lending book. Demand for Treasury debt is strong and should stay that way while MBS has lagged every other major bank asset category.
A picture of growth
Lending to non-bank financial institutions has led not just the most recent bank asset growth but growth for the last year and beyond. Lending to NBFI, which includes a wide set of borrowers from insurers to mortgage originators to business development companies and private credit funds, has run up at an annualized rate of 53% in the last three months (Exhibit 1). It has increased by 32% in the last year. The pace has outstripped every other major category of bank assets.
Exhibit 1: Loans to private credit, C&I and Treasury debt lead recent bank growth
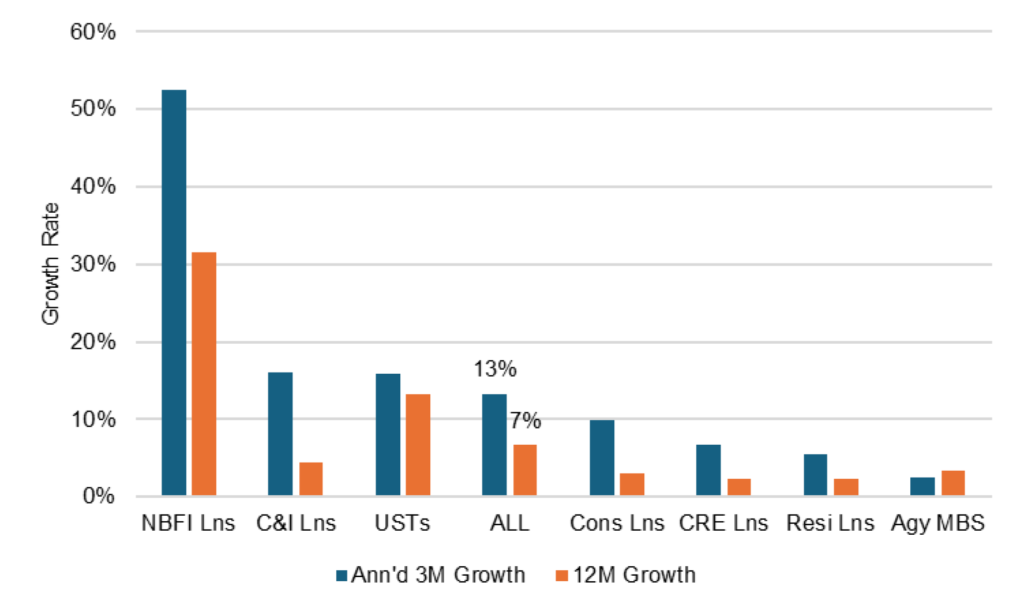
Note: Growth rate through Feb 11, 2026, in asset categories that make up at least 10% of current US commercial bank credit assets.
Source: Federal Reserve H.8, Santander US Capital Markets
Commercial and industrial lending has also contributed to the latest credit surge, up an annualized 16% in the last three months although rising by only 4% in the last year. Nearly three-fourths of the recent burst in C&I lending has come since the start of 2026, which most likely reflects new tax incentives for capital expenditure triggered this year by last July’s One Big Beautiful Bill Act.
The combination of NBFI and C&I lending is almost certainly putting pressure on bank liquidity metrics and, with a 100% risk weighting, absorbing meaningful risk-weighted capital. Treasury debt gets favorable liquidity and capital treatment under bank regulations, so the ongoing bank swing toward that debt facilitates the steady rise in NBFI and C&I loans. Treasury holdings are up an annualized 16% in the last three months, up 13% in the last year.
Growth in bank holdings of agency MBS, on the other hand, has trailed every other major bank asset category in the last three months and has lagged overall growth in loans and securities in the last year. MBS holding are up an annualized 3% in the last three months and 3% in the last year. Banks clearly remain cautious about exposure to both MBS and mortgage loans after negative convexity contributed to the 2023 collapse of Silicon Valley Bank, Signature Bank and First Republic Bank. Beyond slow MBS growth, banks also have substituted floating-rate and short fixed-rate classes of CMO for the longer duration and more negative convexity of 30-year pass-throughs as those pass-throughs have amortized and prepaid.
Bank regulators attention and constructive findings on NBFI lending
The rise in NBFI lending has attracted the steady attention of bank regulators, with the Federal Reserve, the International Monetary Fund and recently the Federal Deposit Insurance Corp. reviewing the state of lending. Although all note potential risks, they also note the strong credit performance of the NBFI loan books so far. According to the FDIC’s January 2026 review, “The NDFI (Non-Depository Financial Institutions) PDNA (past due nonaccrual) rates remain well below C&I PDNA rates across (bank) asset size groups, demonstrating that bank NDFI lending currently presents lower credit risk than traditional business loans.”
NBFI lending remains concentrated at larger banks with nearly half of the loans going to direct business lenders and private equity. The nine largest institutions hold 68% of NBFI loans, and the next 21 largest banks hold another 19% for a combined 87% share (Exhibit 2). Loans to business development companies and other direct business lenders make up 24% of current NBFI balances with loans to private equity adding 23%, a combined 47% share.
Exhibit 2: Larger banks hold 87% of NBFI loans, and in private credit
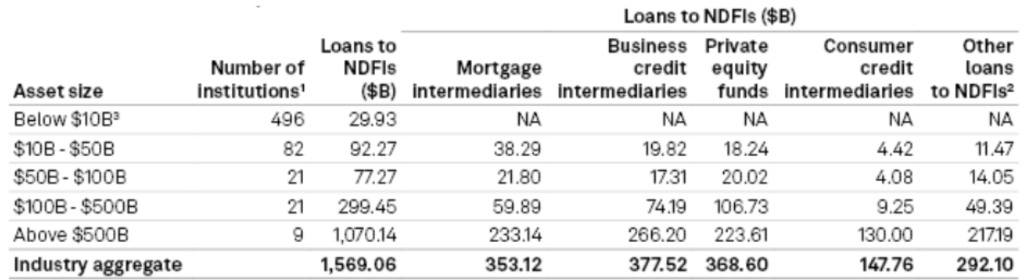
Notes: NDFI = Non-depository Financial Institution. 1. Includes institutions that reported NDFI balances greater than zero for quarter ended Dec 31, 2025. 2. Other loans include loans to holding companies, insurers, federal agencies, investment banks and broker/dealers, publicly listed investment funds, private capital funds, hedge funds, pensions, endowments, family offices, sovereign wealth funds, securitization vehicles, other investment firms, financial vehicles and advances to the bank’s own trust department.
Source: S&P Capital IQ.
Not all banks have grown NBFI lending at the same pace lately. Among the nine largest institutions, Wells Fargo, Morgan Stanley and US Bank all grew at double digits in the last quarter of 2025. Bank of America, Truist and JPMorgan grew at mid-single-digits or slower (Exhibit 3).
Exhibit 3: Not all banks have grown NBFI lending at the same pace
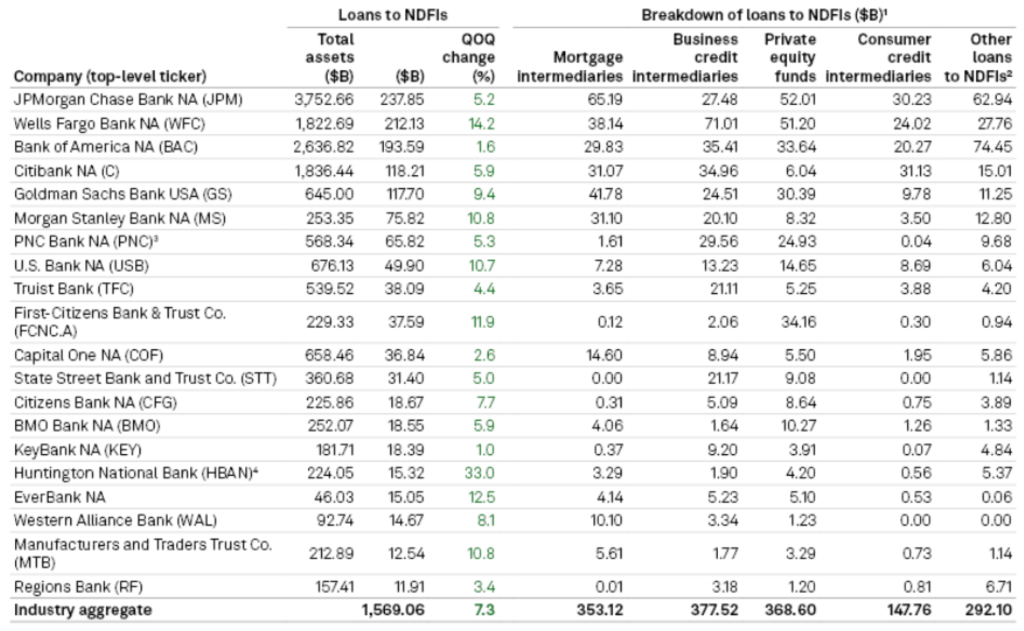
Notes: 1. Banks with $10B or less in total assets started reporting NBFI loans at the end of 2024. 2. Other loans include loans to holding companies, insurers, federal agencies, investment banks and broker/dealers, publicly listed investment funds, private capital funds, hedge funds, pensions, endowments, family offices, sovereign wealth funds, securitization vehicles, other investment firms, financial vehicles and advances to the bank’s own trust department.
Source: S&P Capital IQ.
Market implications
Regulators’ findings of better-than-average credit risk in NBFI loans likely give a green light to continued strong growth, and that should continue to pull along bank demand for Treasury debt, with most of that demand coming in the 5-year and shorter part of the curve. But that demand for Treasury debt and relative lack of interest in MBS remains sensitive to continued credit growth. If regulators or banks themselves tap the brakes, banks could swing toward MBS and other securities to at least partially replace the spread in NBFI.
* * *
The view in rates
Supply and demand continue to put relatively more pressure on yields at the long end of the curve, but rates overall are responding to fresh credit concerns. On the supply side, the Supreme Court struck down most of the tariffs imposed by the administration on Liberation Day. Those tariffs had raised monthly import duties from $7 billion in January to $30 billion by September, reducing the US primary deficit. The administration has imposed new tariffs under different laws, but those tariffs have limits on amounts, timing or both. It will likely be hard for the administration to fully replace the Liberation Day revenues. The administration on January 8 also proposed increasing the defense budget by 66% to $1.5 trillion. That should get resolved through the spring budget process but would boost deficits. On the demand side, the recent rise in yields in Japan stands to trim incentives for Japan’s domestic portfolios to buy US Treasury debt. Japanese debt now offers higher yield that Treasury debt after hedging foreign exchange risk. Since Japan is the single largest foreign holder of Treasury debt, that matters.
Fresh credit concerns have helped drag the yield curve lower, although it is too soon to know if those concerns will hold. Most of the concerns revolve around the impact of AI, which look unlikely to play out in cash flow and profits for years. The ambiguity stands to keep risk appetite low until the specifics of AI impact become clearer.
The 2s10s Treasury slope traded Friday at 57 bp, off its peak at 72 bp in early February, with 5s30s at 110 bp.
Key market levels:
- Fed RRP balances settled on Friday at $3.8 billion, the facility’s 3.50% yield running well below SOFR’s alternative 3.67%
- Setting on 3-month term SOFR traded Friday at 366 bp, unchanged in the last three weeks
- Further out the curve, the 2-year note traded Friday at 3.40%, down 8 bp in the last week. The 10-year note traded at 3.97%, down 11 bp in the last week
- The Treasury yield curve traded Friday with 2s10s at 57 bp, flatter by 3 bp in the last week. The 5s30s traded Friday at 110 bp, steeper by 2 bp
- Breakeven 10-year inflation traded Friday at 227 bp, down 2 bp in the last two weeks. The 10-year real rate finished the week at 170 bp, down 9 bp in the last week
The view in spreads
Risk assets have taken their lead from the administration’s January 8 announcement that Fannie Mae and Freddie Mac would buy $200 billion in MBS. That immediately tightened the option-adjusted spread on the MBS index by 8 bp, and credit began tightening in the aftermath. Credit nevertheless began widening in the last three weeks. MBS spreads have been steady, although news of a decline in the Freddie Mac investment portfolio in January has added uncertainty to a Fannie Mae or Freddie Mac bid.
Investment grade credit still faces a challenge this year from a sizable 9% to 11% jump in net supply in part to fund AI infrastructure. That could outstrip 5% to 7% growth in outstanding Treasury debt, widening the corporate-Treasury spread, and 2% growth in outstanding agency MBS, widening the corporate-MBS spread. Supply in MBS is even less after excluding Ginnie Mae custom pools, which are not included in the Bloomberg MBS index.
The Bloomberg US investment grade corporate bond index OAS traded on Friday at 82 bp, wider by 5 bp in the last week. Nominal par 30-year MBS spreads to the blend of 5- and 10-year Treasury yields traded Friday at 107 bp, wider by 6 bp in the last week. Par 30-year MBS TOAS closed Friday at 15 bp, 4 bp wider in the last week.
The view in credit
Bank lending to non-bank financial institutions, including private debt funds and business development companies, has expanded at an extraordinary pace in the last few years, raising the possibility that lending has outstripped experience and infrastructure for underwriting and monitoring. Bank regulators continue to focus on that category of lending, which could eventually tighten the private credit markets. But for now, credit metrics for NBFI lending are strong relative to traditional bank lending such as C&I. The balance sheets of smaller companies show signs of rising leverage and lower operating margins. Leveraged loans also are showing signs of stress, with the combination of payment defaults and liability management exercises, or LMEs, often pursued instead of bankruptcy, back to 2020 post-Covid peaks.
Consumer credit in the lowest tier of income continue to look vulnerable, and cuts to government programs this year should keep the pressure on.