


The Big Idea
Fannie Mae, Freddie Mac grow portfolio balance and risk
Steven Abrahams | January 30, 2026
This material is a Marketing Communication and does not constitute Independent Investment Research.
Even before the White House asked Fannie Mae and Freddie Mac in January to buy $200 billion in MBS, the agencies had accelerated growth in their investment portfolios and increased portfolio risk. The agencies’ newest disclosures show a $24.6 billion jump in mortgages and MBS for December and a continuing rise in their duration gap, an interest rate risk measure. While the December pace would let the portfolios easily top the White House target, tighter MBS spreads could encourage more risk if the portfolios come under pressure to deliver targeted returns.
Portfolio balances jump and have room to grow
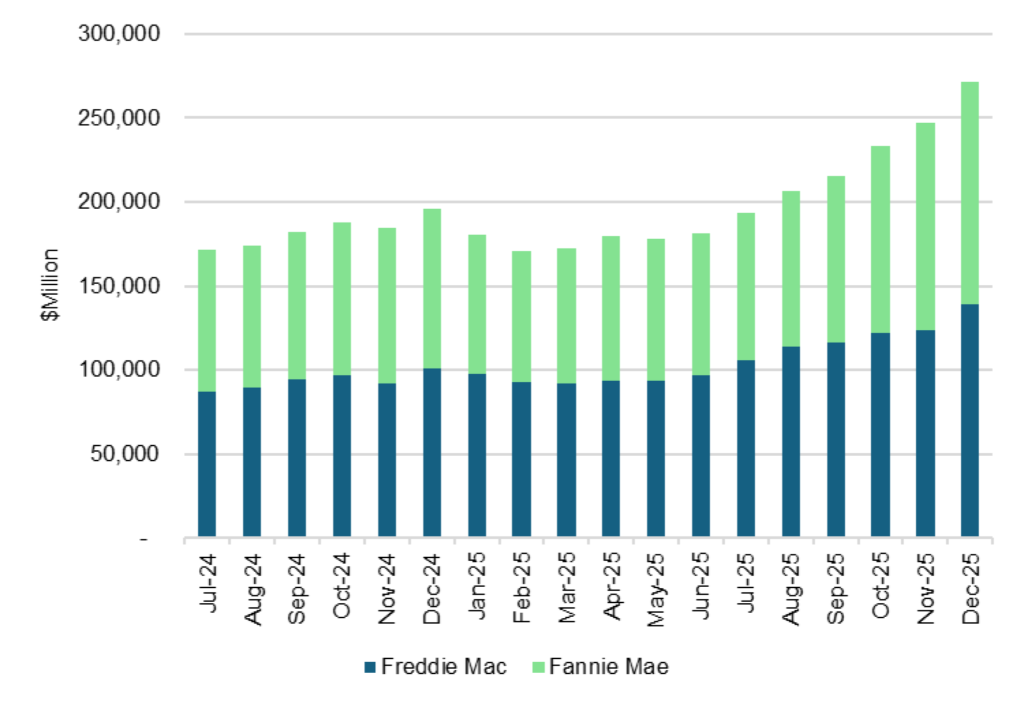
Most of the December growth came from Freddie Mac where portfolio balances rose $15.6 billion or nearly 13%. Fannie Mae rose $8.9 billion or nearly 6% (Exhibit 1). That left the Freddie Mac portfolio at $139 billion and Fannie Mae at $132 billion.
Exhibit 1: Fannie Mae, Freddie Mac portfolios rose $24.6 billion in December
Source: Fannie Mae, Freddie Mac, Santander US Capital Markets
Each agency faces a $225 billion portfolio asset cap under the Preferred Stock Purchase Agreement governing conservatorship. That gives them room to grow, but the Federal Housing Finance Agency and the US Treasury, the parties to the agreement, will almost certainly have to lift the cap if the $200 billion White House target means purchases beyond balances at the end of December.
Fannie Mae, Freddie Mac take different approaches
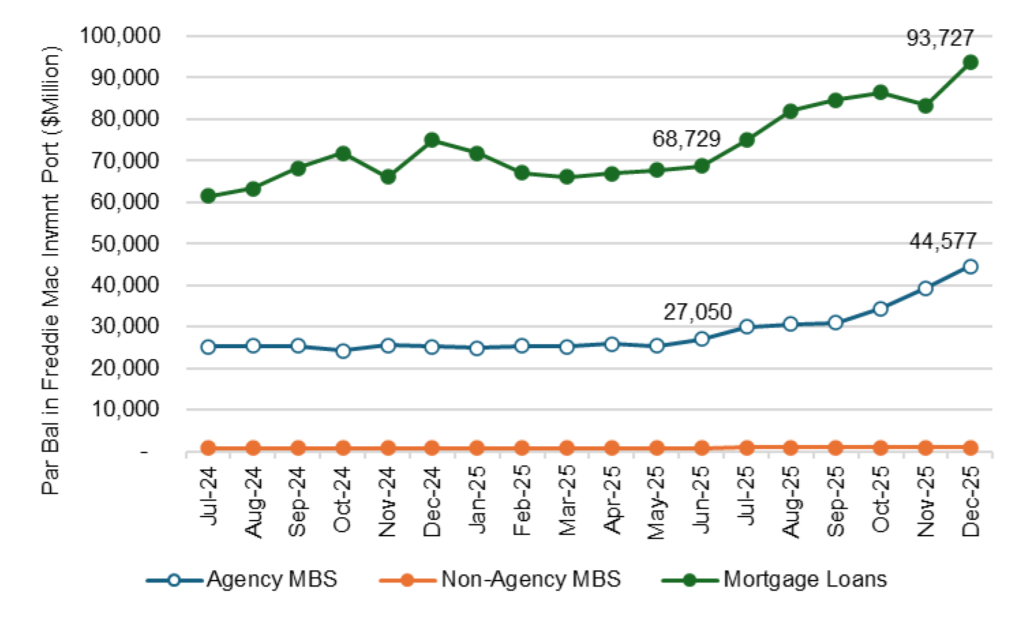
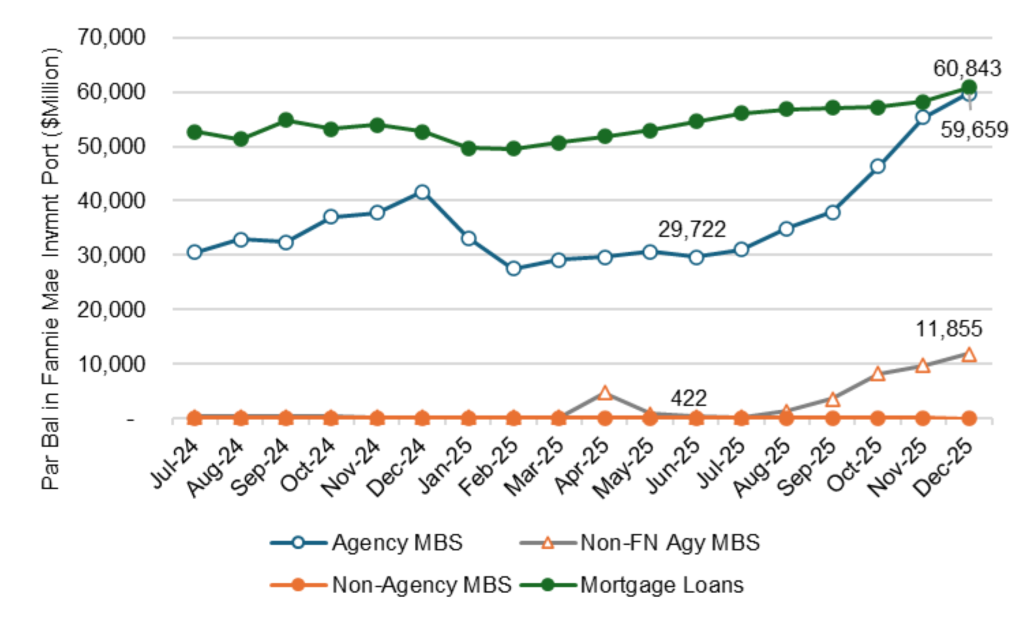
The agency portfolios are not growing the same way. Freddie Mac has been adding mortgage loans more aggressively than mortgage securities while Fannie Mae has been adding both its own and other federal agency securities faster than mortgage loans (Exhibit 2A, 2B). Each agency can source loans from their cash window, where originators sell their newest production, or MBS from the secondary market. Both loans and securities should have equal impact on agency profitability and on MBS spreads.
Exhibit 2A: Freddie Mac has added more loans than MBS
Source: Freddie Mac, Santander US Capital Markets
Exhibit 2B: Fannie Mae has added its own and other agency MBS
Source: Fannie Mae, Santander US Capital Markets
A rise in portfolio risk
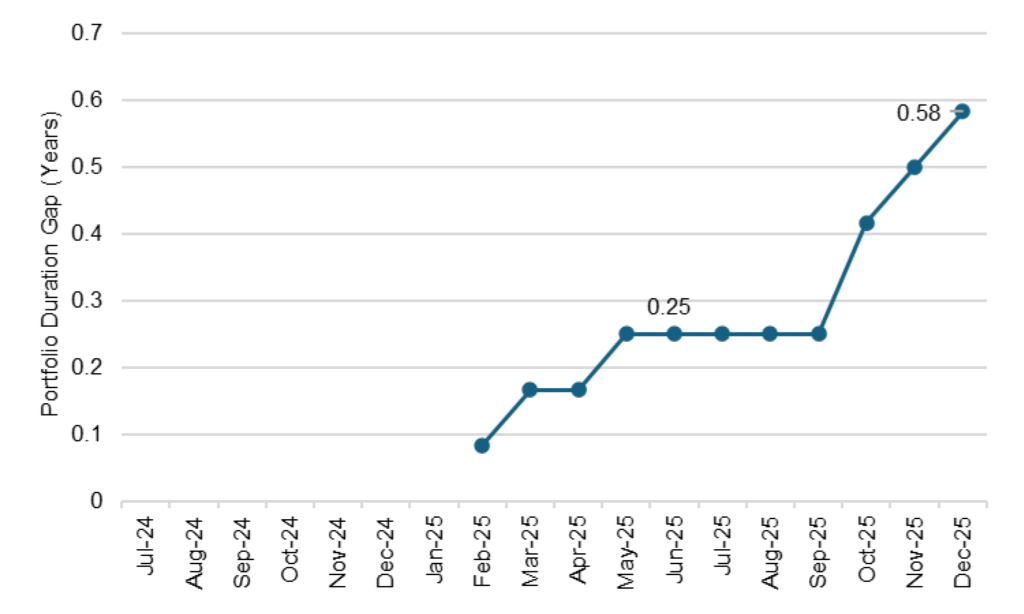
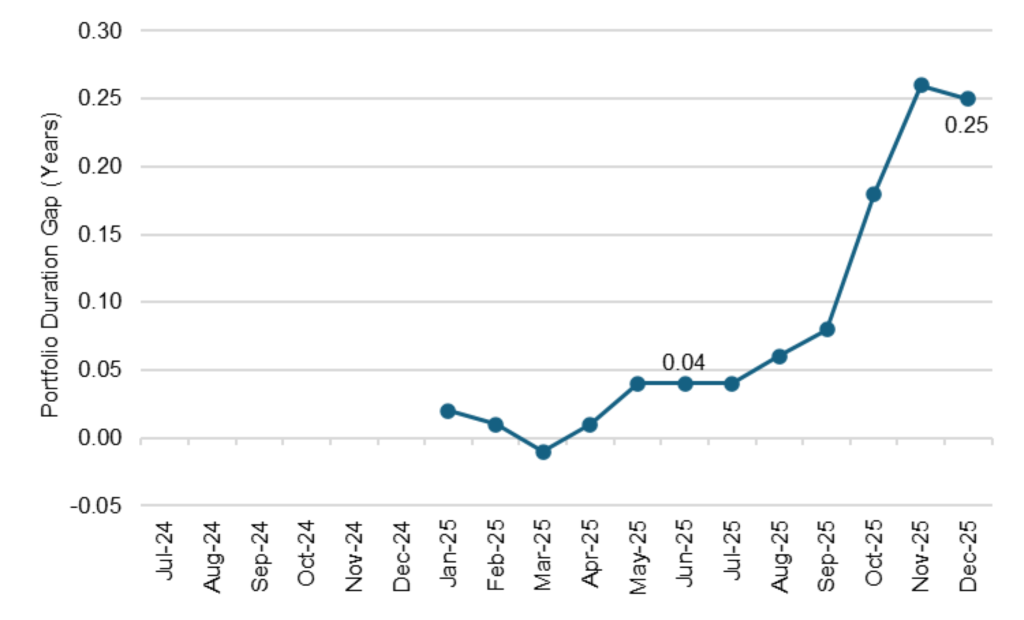
Both portfolios have also noticeably increased interest rate risk since growth accelerated in mid-2025. Each reports a monthly duration gap measuring the expected percentage change in portfolio net worth if interest rates shift. The Freddie Mac duration gap has moved from 0.25 years in June to 0.58 years in December, meaning an instantaneous 100 bp rise in the yield curve would reduce portfolio value by 0.58%, or $812 million (Exhibit 3A). The Fannie Mae duration gap has moved from 0.04 years in June to 0.25 years in December, meaning an instantaneous jump would hit portfolio value by 0.25%, or $331 million (Exhibit 3B).
Exhibit 3A: Freddie Mac’s portfolio duration gap shows rising rate exposure
Source: Freddie Mac, Santander US Capital Markets
Exhibit 3B: Fannie Mae’s duration gap is smaller but rising, too
Source: Fannie Mae, Santander US Capital Markets
These potential losses seem small given the size of the portfolios, but their importance depends on the amount of capital ultimately used to support portfolio investment. Both agencies today operate with a capital shortfall—Fannie Mae with $215 billion less capital than needed under the FHFA regulatory capital framework, according to its latest 10-Q, and Freddie Mac with $163 billion less. But one day the agencies could emerge from conservatorship fully capitalized. That would require allocating capital across businesses. If the agencies allocated only a small amount of capital against investments in recognition of their own existing guarantees and limited spread and operational risk, a small duration gap could become a much larger portfolio duration of equity. For example, before the Global Financial Crisis, the agencies held as much as $2.50 in capital for every $100 in portfolio MBS. In that case, a 0.58% loss in the portfolio could wipe out ($0.58/$2.50) or 23% of allocated capital. Small gaps can pose substantial risk to the solvency of a highly leveraged portfolio.
The tension between profits and policy
Option-adjusted spreads on 30-year MBS had run around 25 bp over the Treasury curve from mid-September to mid-December when the Fannie Mae and Freddie Mac portfolios presumably accumulated the purchases that settled in December. Since the White House instruction to buy $200 billion, that has collapsed to 6 bp. But that is probably not the best benchmark for understanding portfolio profitability.
In today’s market, the portfolios look likely to fund by issuing SOFR floaters. In fact, on January 29, Fannie Mae issued a $5 billion floater at SOFR + 9 bp. The agency would then likely swap the funding into a mix of SOFR bullet and possibly callable exposures. The relevant OAS consequently becomes the spread to the SOFR curve, which ran around a much more attractive 60 bp through the fall (Exhibit 4). Bloomberg currently shows the SOFR OAS in the par 30-year pass-through at a healthy 43 bp.
Assuming heroically the portfolios continue to fund at SOFR + 9 bp, decide to hold a shadow 2.5% capital against the purchases and hedge out all the duration and option risk in par 30-year MBS, the SOFR OAS through the fall would promise a return on equity of around 25%. After the White House instruction to buy $200 billion, today’s tighter SOFR spread still promises a return on equity of around 17% (see appendix for details).
Exhibit 4: OAS on 30-year MBS is wider to SOFR than it is to the Treasury curve
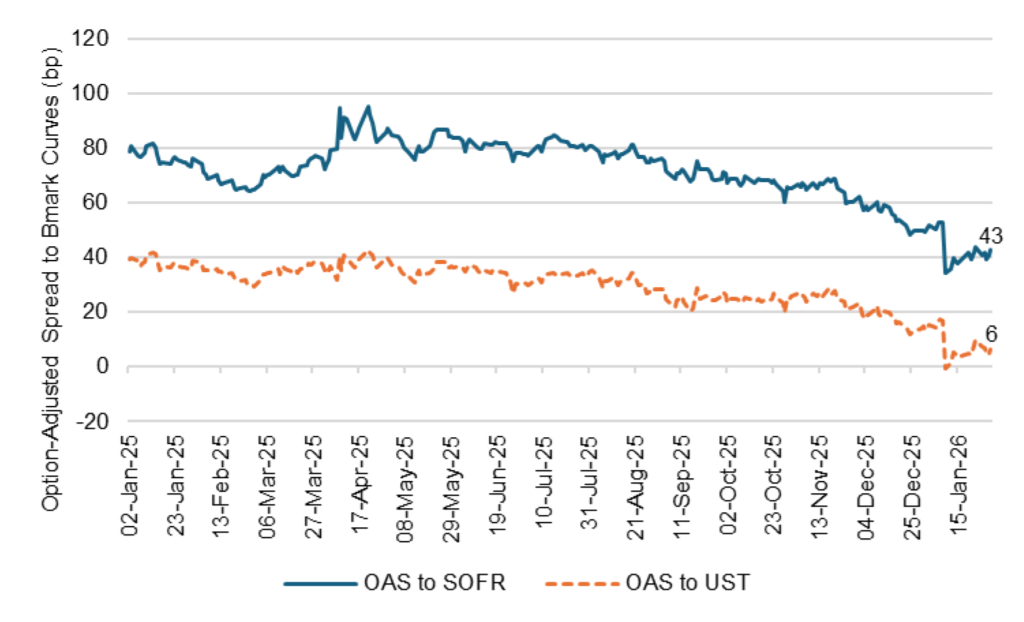
Note: OAS on the par 30-year conventional pass-through.
Source: Bloomberg, Santander US Capital Markets
The agency portfolios may eventually face a tough choice. Investing for a fully hedged return of 17% probably covers a fair market cost of capital for now, assuming that’s the goal. But the portfolios could continue to invest, focusing on a policy goal of driving down the cost of mortgage funding. Eventually, ROE would likely fall below fair value. If the portfolios have an eye on eventually leaving conservatorship, they have incentives to show potential return on equity. One way to do that would be to leave some of the MBS risks unhedged, like duration or convexity, reducing the cost of hedges and allowing more income to flow to the bottom line. More risk, more return. To see whether that happens in the months ahead, just do what any prudent rider on the London Tube would do: mind the gap.
APPENDIX: Calculating potential ROE on an MBS portfolio. One simple calculation of return on equity from income for a leveraged portfolio of debt is (Income on Asset – Cost of Debt)/Equity. If a portfolio funded $100 in assets with $97.50 in debt and $2.50 of equity, the calculation becomes ((Asset Yield x $100) – (Debt Yield x $97.50)/$2.50. OAS provides a useful measure of the spread left after funding at a benchmark rate of interest and hedging out all duration and convexity risk. However, OAS assumes the position is fully funded. To correct for that, a bit of algebra leads to the formula of ROE = OAS x (Asset Value/Equity) + The Riskless Floating Rate (SOFR). For the example of a $100 30-year pass-through with a 43 bp OAS to SOFR, funded with debt at SOFR + 9 bp and $2.50 in equity, the calculation becomes (43 bp – 9 bp) x ($100/$2.50) + 3.66% = 17.26%.
* * *
The view in rates
The front of the yield curve continues to look like the sweet spot for taking duration risk, with the 10-year and longer part of the curve vulnerable to both supply and demand surprises. On the supply side, the administration on January 8 proposed increasing the defense budget by 66% to $1.5 trillion. That should get resolved through the spring budget process. On the demand side, the recent rise in yields in Japan stands to trim incentives for Japan’s domestic portfolios to buy US Treasury debt. Japanese debt now offers higher yield that Treasury debt after hedging foreign exchange risk. Since Japan is the single largest foreign holder of Treasury debt, that could matter.
The 2s10s Treasury slope traded Friday at 72 bp, the steepest slope in a year, with 5s30s at 108 bp. The news of the administration’s nomination of Kevin Warsh for Fed chair helped shorter maturities rally with longer maturities unchanged.
Key market levels:
- Fed RRP balances settled on Friday at $9.6 billion, largely reflecting month-end bank balance sheet pressure, as its 3.50% yield on cash lags well behind SOFR’s 3.64%
- Setting on 3-month term SOFR traded Friday at 366 bp, down 1 bp in the last week
- Further out the curve, the 2-year note traded Friday at 3.52%, down 8 bp in the last week. The 10-year note traded at 4.24%, down 1 bp in the last week
- The Treasury yield curve traded Friday with 2s10s at 72 bp, steeper by 7 bp week-over-week. The 5s30s traded Friday at 108 bp, steeper by 8 bp
- Breakeven 10-year inflation traded Friday at 234 bp, up 3 bp in the last week. The 10-year real rate finished the week at 190 bp, down 4 bp in the last week
The view in spreads
Risk assets have taken their lead in the last few weeks from the administration’s January 8 announcement that Fannie Mae and Freddie Mac would buy $200 billion in MBS. That immediately tightened the option-adjusted spread on the MBS index by 8 bp, and credit began tightening in the aftermath. The demand for risk assets has continued in the last week, too.
Investment grade credit still faces a challenge this year from a sizable 9% to 11% jump in net supply in part to fund AI infrastructure. That could outstrip 5% to 7% growth in outstanding Treasury debt, widening the corporate-Treasury spread, and 2% growth in outstanding agency MBS, widening the corporate-MBS spread. Supply in MBS is even less after excluding Ginnie Mae custom pools, which are not included in the Bloomberg MBS index.
The Bloomberg US investment grade corporate bond index OAS traded on Friday at 73 bp, wider by 2 bp in the last week. Nominal par 30-year MBS spreads to the blend of 5- and 10-year Treasury yields traded Friday at 99 bp, wider by 1 bp. Par 30-year MBS TOAS closed Friday at 8 bp, tighter by 1 bp week-over-week.
The view in credit
Bank lending to non-bank financial institutions, including private debt funds and business development companies, has expanded at an extraordinary pace in the last few years, raising the possibility that lending has outstripped experience and infrastructure for underwriting and monitoring. Bank regulators continue to focus on that category of lending, which could eventually tighten the private credit markets. The balance sheets of smaller companies show signs of rising leverage and lower operating margins. Leveraged loans also are showing signs of stress, with the combination of payment defaults and liability management exercises, or LMEs, often pursued instead of bankruptcy, back to 2020 post-Covid peaks.
Consumer credit in the lowest tier of income continue to look vulnerable, and cuts to government programs this year should keep the pressure on.