


The Big Idea
Higher yields in Japan pose new competition for US assets
Steven Abrahams | January 23, 2026
This material is a Marketing Communication and does not constitute Independent Investment Research.
Longer Japanese government bonds in the last week have posted the highest yields since the late 1990s, and that could cool the appetite of a key investor in US markets. US Treasury figures show Japanese portfolios with $1.1 trillion in Treasury debt through November, $326 billion in corporate debt and structured credit and $282 billion in agency MBS and debentures. JGB yields suddenly look much more competitive.
New competition from JGB yields
JGBs now top the yield on comparable US Treasury debt after hedging out currency risk. Japan’s 2-year note beats the hedged yield of the same US maturity by 15 bp, the 5-year note by 21 bp and the 10-year note by 34 bp (Exhibit 1). Yield alone is not the only draw of Treasury debt—liquidity, safety and other things also show up on the list—but it is a big one.
Exhibit 1: Japan’s government bonds currently outyield hedged US Treasuries
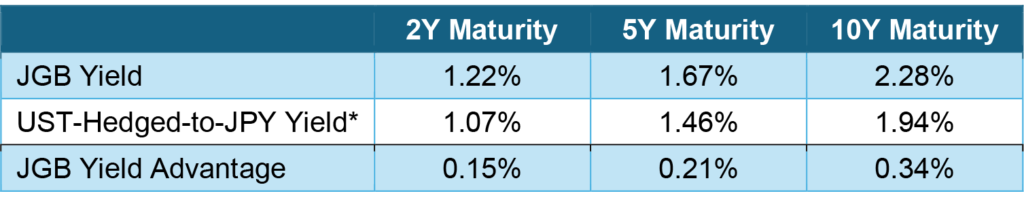
Note: IRR after hedging UST coupon and principal to JPY with forward contracts as of 21 Jan 2026. UST and JGB cash flows assume constant-maturity instruments.
Source: Bloomberg, Santander US Capital Markets
My colleagues in G10 rates strategy point out that JGBs may not be the only game in town for Japanese investors. The 7-year and longer parts of the Belgian, French and Italian government curves still offer better yields than JGBs after hedging out currency risk. But these government markets are much smaller than either the US or Japanese.
The higher JGB yields line up with comments at a Tokyo investor conference in November from insurers noting more attractive yield on domestic debt. That could matter in US markets. Japan’s holdings make up 3.6% of marketable Treasury debt, 4.3% of outstanding investment grade corporate debt and 3.0% of agency MBS. The holdings make the country the largest foreign investor in the Treasury and agency markets and the fifth largest foreign investor in corporate debt and structured credit.
Some US markets will likely need all sources of demand this year. Initial Street projections have outstanding investment grade corporate debt growing by 9% to 11% this year based significantly on new funding for data centers and other technology infrastructure. That would mark the fastest growth in investment grade corporate debt in at least a decade. Projected US deficits would raise outstanding Treasury debt by 6%. And projections for agency MBS have balances up a smaller 2% or less.
Background on higher yields in Japan
Higher yields in Japan have followed in the wake of Sanae Takaichi’s rise to prime minister in October and her introduction in December of the largest government budget ever of more than ¥122 trillion, equivalent to $775 billion. It tops the prior year’s record ¥115 trillion budget in part from a ¥9 trillion increase in defense. The prime minister on January 19 then called a snap election for the House of Representatives on February 8 to get voter support for more spending, tax cuts and a new defense strategy. Japan’s 10-year rate rose the next day by 9 bp, the 30-year rate by 27 bp and the 40-year rate by 29 bp (Exhibit 2). They have since reversed more than half the initial jump.
Exhibit 2: Japanese yields jumped after the recent call for snap elections
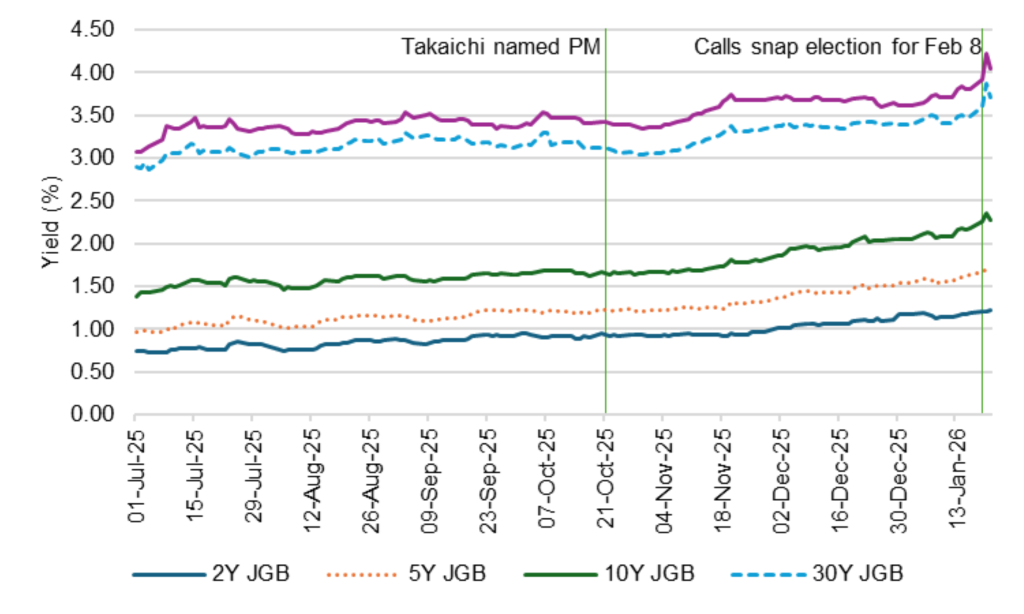
Source: Bloomberg, Santander US Capital Markets
Part of the market sensitivity comes from the amount of debt Japan already has outstanding. At 237% of GDP, it is the largest by far of the G7 economies (Exhibit 3). The 2026 budget already anticipates spending ¥31.3 trillion to pay interest on the debt, 25% of total outlays. Japan has been able to grow its debt much faster than GDP in part due to a high public savings rate and domestic investors’ willingness to hold the debt. Japanese portfolios hold 88% of outstanding JGBs, according to Japan’s Ministry of Finance. That compares to 69% of US Treasury debt held domestically.
Exhibit 3: Japan has the highest debt-to-GDP among G7 economies
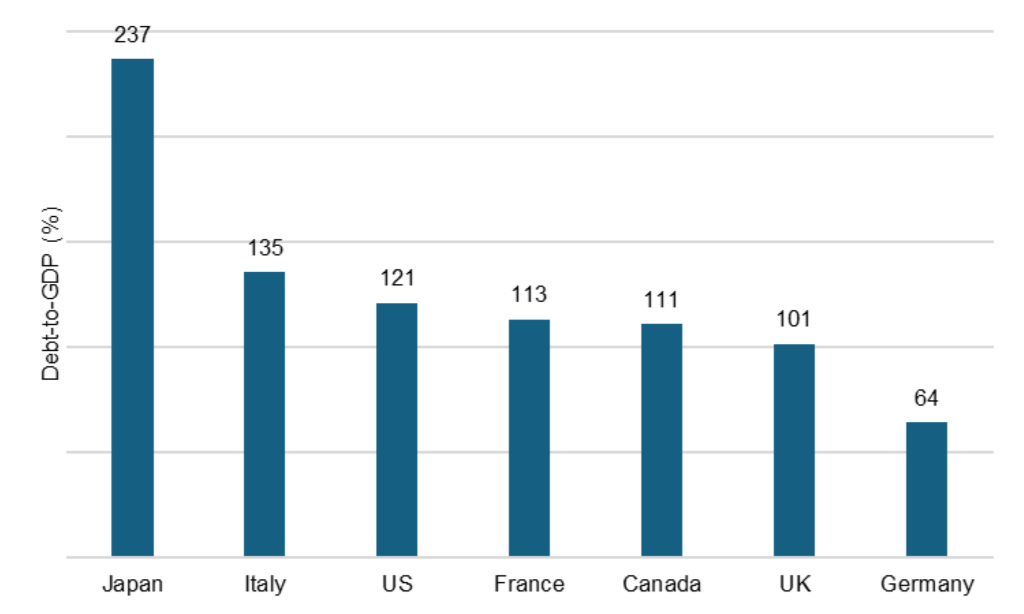
Note: Ratio of both marketable and nonmarketable central government debt-to-GDP at the end of 2024.
Source: International Monetary Fund, Santander US Capital Markets
High debt-to-GDP and high debt service could limit government flexibility to meet future economic, security or other demands and create incentives for the country to inflate its way out of the problem. Japan’s year-over-year CPI currently is running at 2.9%, also among the highest rates since the 1990s. Debt with longer maturities would be especially sensitive to this risk.
The Treasury market looks most vulnerable
Of the major debt markets in the US, the Treasury market looks most vulnerable. Investors in Japan have clear yield incentives to prefer JGBs, and even US investors stand to profit by rotating out of US debt into JGBs. Japanese investors may not sell Treasury debt, but the marginal bid may weaken. MBS and corporate debt look more insulated, in part because it is harder to hedge those cash flows into Japanese yen—especially MBS—and in part because the Japanese market really has no direct sizable substitute for US MBS or corporate risk profiles. Japan’s new higher yields set up US markets for higher yields in the longer end of the Treasury curve and in risk instruments that trade off that part of the curve.
* * *
The view in rates
Continue to own duration more on the front of the yield curve than on the back. The 2s10s Treasury slope continues to trade lately in the 65 bp to 70 bp range with 5s30s just above 100 bp. The back of the yield curve has to wrestle with Treasury supply, periodic policy volatility in the US and the prospect of weaker demand from Japan as yields on Japanese government bonds rise and draw demand away from Treasury debt.
Key market levels:
- Fed RRP balances settled on Friday at $2.1 billion as its 3.50% yield on cash lags well behind SOFR’s 3.64%
- Setting on 3-month term SOFR traded Friday at 367 bp, up 2 bp in the last two weeks
- Further out the curve, the 2-year note traded Friday at 3.60%, up 7 bp in the last two weeks. The 10-year note traded at 4.25%, up 9 bp in the last two weeks
- The Treasury yield curve traded Friday with 2s10s at 65 bp, steeper by 2 bp since early January. The 5s30s traded Friday at 100 bp, flatter by 6 bp
- Breakeven 10-year inflation traded Friday at 231 bp, up 3 bp in the last two weeks. The 10-year real rate finished the week at 194 bp, up 6 bp in the last two weeks
The view in spreads
Risk assets have taken their lead in the last two weeks from the administration’s January 8 announcement that Fannie Mae and Freddie Mac would buy $200 billion in MBS. That immediately tightened the option-adjusted spread on the MBS index by 8 bp, and credit began tightening in the aftermath.
Investment grade credit still faces a challenge this year from a sizable 9% to 11% jump in net supply in part to fund AI infrastructure. That could outstrip 5% to 7% growth in outstanding Treasury debt, widening the corporate-Treasury spread, and 2% growth in outstanding agency MBS, widening the corporate-MBS spread. Supply in MBS is even less after excluding Ginnie Mae custom pools, which are not included in the Bloomberg MBS index.
The Bloomberg US investment grade corporate bond index OAS traded on Friday at 71 bp, tighter by 6 bp in the last two weeks. Nominal par 30-year MBS spreads to the blend of 5- and 10-year Treasury yields traded Friday at 98 bp, wider by 4 bp in a partial correction of its initial response to the administration’s $200 billion MBS announcement. Par 30-year MBS TOAS closed Friday at 9 bp, wider by 10 bp also largely correcting its initial response to the administration’s announcement.
The view in credit
Bank lending to non-bank financial institutions, including private debt funds and business development companies, has expanded at an extraordinary pace in the last few years, raising the possibility that lending has outstripped experience and infrastructure for underwriting and monitoring. Bank regulators continue to focus on that category of lending, which could eventually tighten the private credit markets. The balance sheets of smaller companies show signs of rising leverage and lower operating margins. Leveraged loans also are showing signs of stress, with the combination of payment defaults and liability management exercises, or LMEs, often pursued instead of bankruptcy, back to 2020 post-Covid peaks.
Consumer credit in the lowest tier of income continue to look vulnerable, and cuts to government programs this year should keep the pressure on.