The Long and Short
Breakdown of recent IG issuance and maturities
This material is a Marketing Communication and does not constitute Independent Investment Research.
Total investment grade corporate bond issuance stands at $1.66 trillion for the year with only a few issuers likely to tap the market in the days ahead. This ranks second only to the more than $1.90 trillion bonanza of 2020. While projections for both gross and net supply for 2026 vary, most anticipate another banner year. As the new year rapidly approaches, it helps to examine issuance in recent years to gauge potential trends ahead, as well as understand how upcoming maturities compare to the recent past.
One of the most notable trends in new issue for much of 2025 was the lack supply in the long end of the curve (Exhibit 1). Most notably, new issue volume of 30-year or longer maturities is finishing around 11%. That compares with nearly 15% in the prior year and recent peaks of roughly 20% during the heights of Covid when rates were artificially low and government assistance helped backstop the market, enabling more issuers to move out the curve. Even new issue 10-year paper at 27% was down materially from the previous two years. The noteworthy late push of jumbo debt launches in technology was not enough to balance the lack of supply during the first three quarters. The bid for longer paper remained technically strong throughout most of the year. With AI infrastructure buildout expected to be a continuing theme in 2026, look for the balance of 30-year and longer debt to return to more typical levels.
Exhibit 1: Annual new issue volume by maturity
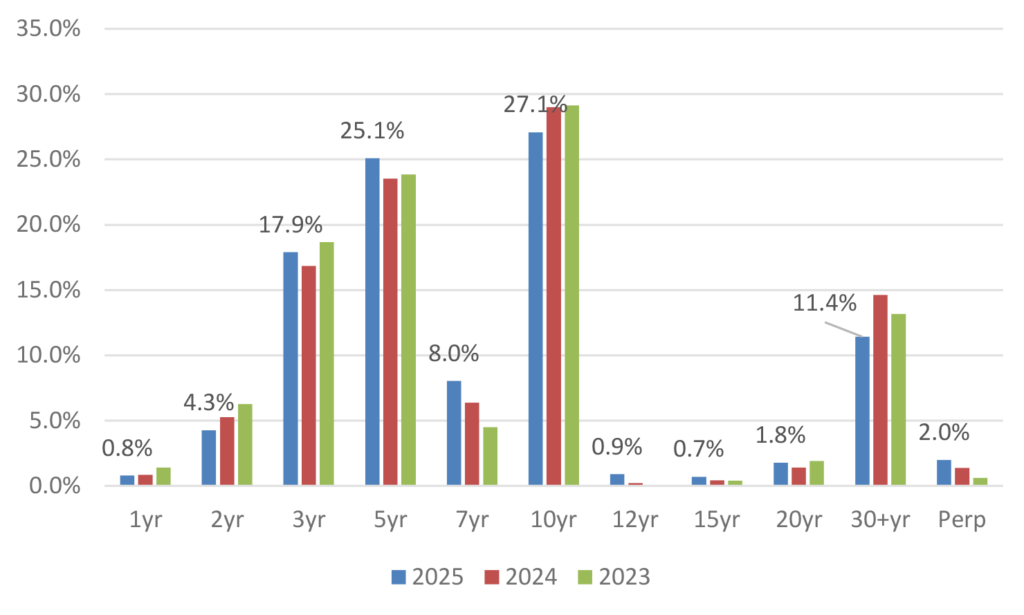
Source: Santander US Capital Markets LLC, Bloomberg LP
Looking at the new issue calendar by rating category, the percentage of new debt issued in the lowest two rating categories (‘BBB’, ‘BBB-‘) was down slightly from the prior two years at 17.6% and 11.7%, respectively (Exhibit 2). Meanwhile, debt issued in the ‘BBB+’, ‘A-‘ and ‘AA-‘ categories were all on the rise throughout the year. Again, the expectation for large-scale, jumbo debt launches in the broader TMT space in 2026 could keep these trends progressing and add technical pressure to the lower rated categories for index investors.
Exhibit 2: Annual new issue volume by rating
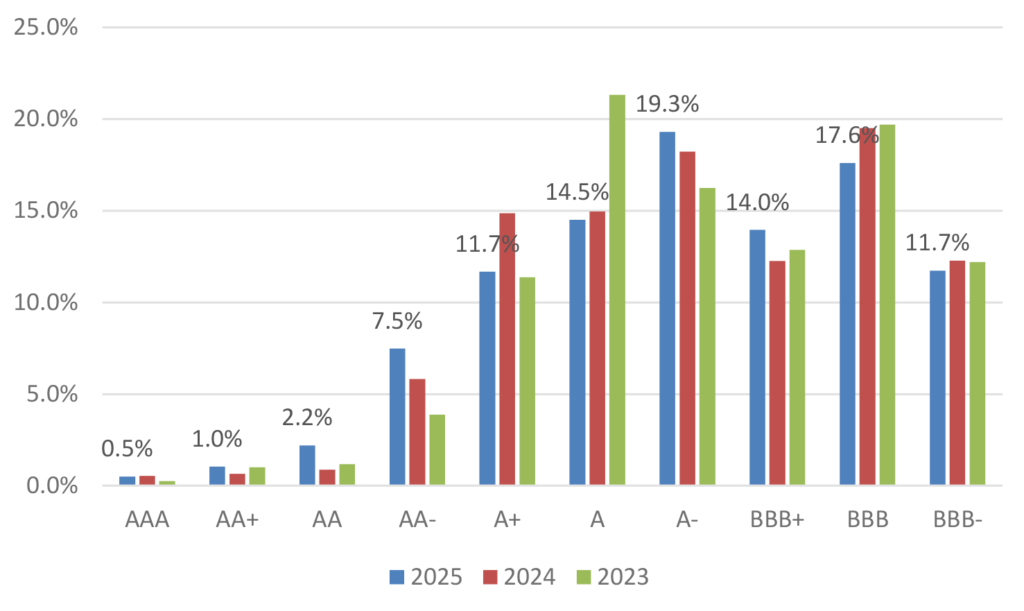
Source: Santander US Capital Markets LLC, Bloomberg LP
New issue volume in the tech sector reached 10.4% in 2025 (Exhibit 3). That compares with a year-end index weighting of about 9.5% and is double the relative amount issued just two years ago. Comparatively, percentage issuance in the utilities, banking and consumer non-cyclicals have all been trending downward over the past three years. There was also a considerable year-over-year drop in insurance issuance by percentage.
Exhibit 3: Annual new issue volume by sector
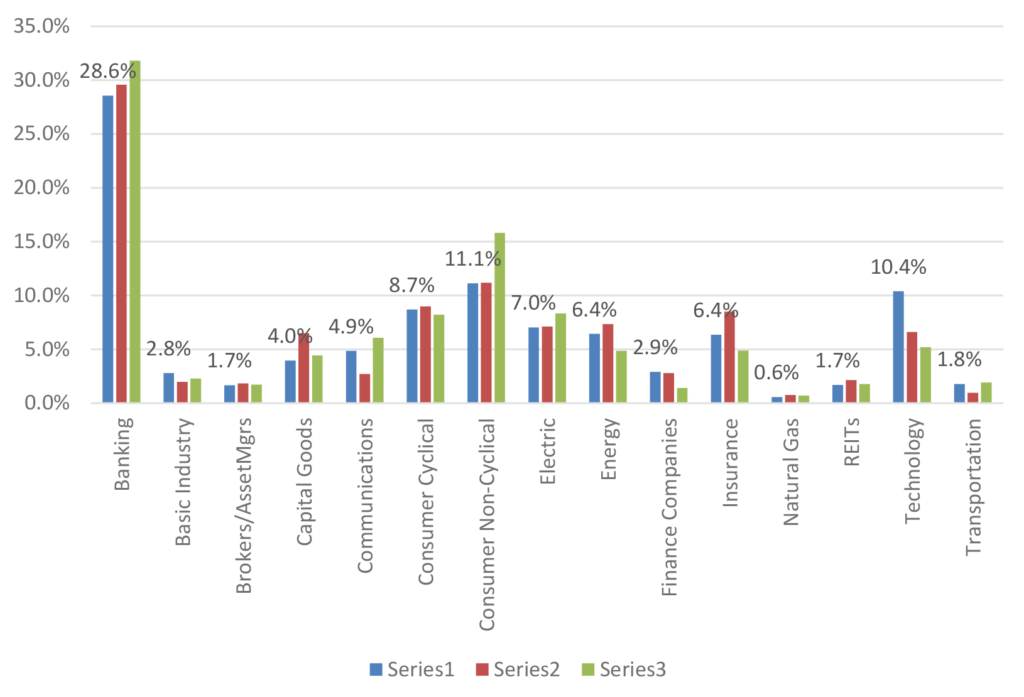
Source: Santander US Capital Markets LLC, Bloomberg LP
Much attention was made about the notable maturity wall in 2025 as a result of all the 5-year debt issued during the 2020 boom of new issue volume, and the prospect for significant issuance leading into the year. Still, with over $800 billion in approaching debt maturities in 2026, there is a considerably large maturity burden approaching that has projections for gross issuance inflated for the coming year as well. A breakdown of the original tenors of that debt coming due over the next twelve months versus the previous two years demonstrates a considerably large portion of 10-year debt reaching maturity (Exhibit 4). Comparatively, the percentage of 3-year debt reaching maturity is down significantly over the prior two years.
Exhibit 4: Upcoming and recent debt maturities by original tenor
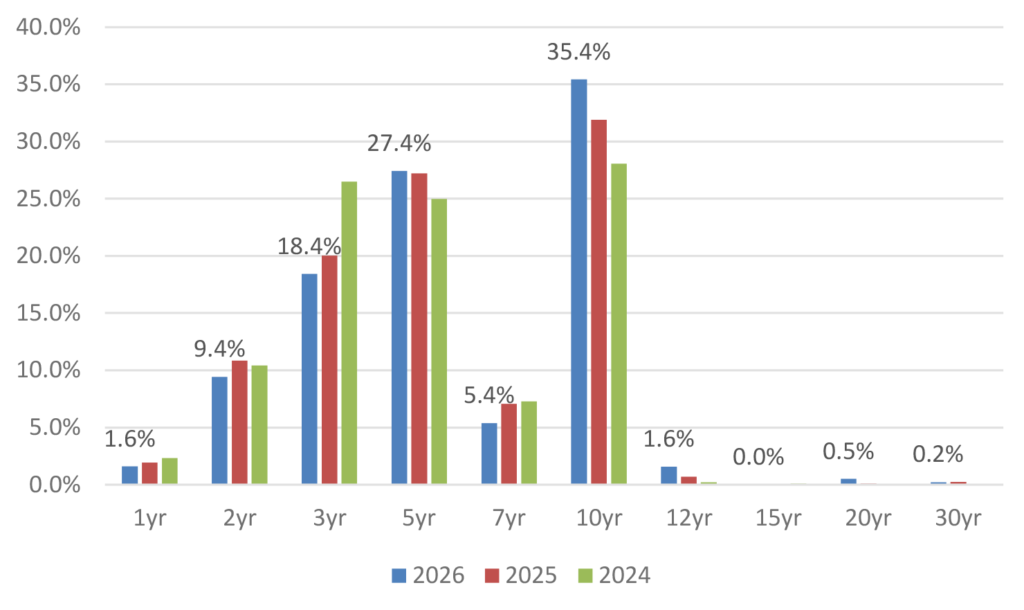
Source: Santander US Capital Markets LLC, Bloomberg LP
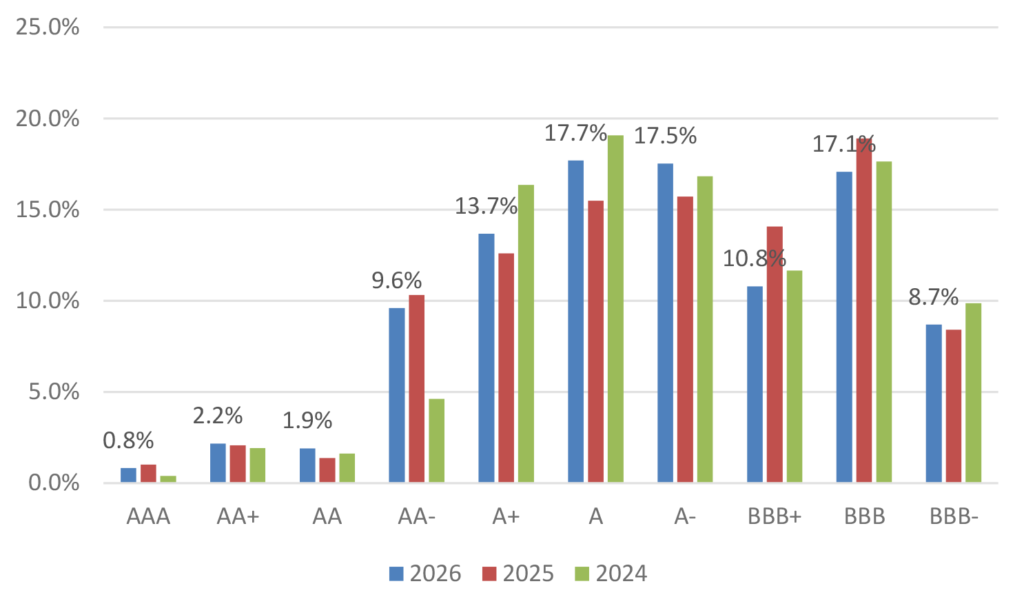
Looking at the maturity schedule on ratings basis, the percentage amount of debt in all three ‘BBB’ rating categories appears to be coming down off higher levels from the previous two years (Exhibit 5). Meanwhile, all three categories of single-A debt are up significantly versus the schedule at the same time last year. Given the relative drought of lower-rated paper demonstrated above in the previous year, this conceivably keep technical pressure among BBBs relative to the rest of the market.
Exhibit 5: Upcoming and recent debt maturities by rating
Source: Santander US Capital Markets LLC, Bloomberg LP
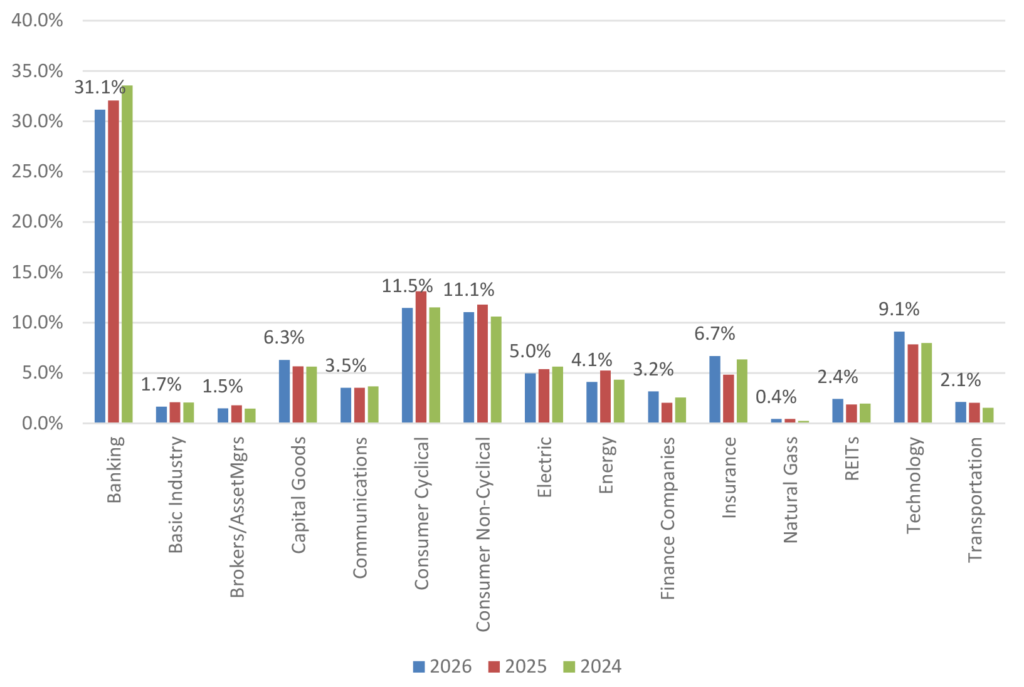
The last breakdown of the upcoming maturity schedule for 2026 demonstrates broad sectors on a percentage basis (exhibit 6). Not surprisingly, tech maturities are on the rise commensurate with recent new issue growth, and a higher share of the overall index. Beyond a slight stepdown in consumer for next year and slight rise in insurance, the balance of upcoming debt maturities remains remarkably similar for 2026 versus the two prior years.
Exhibit 6: Upcoming and recent debt maturities by sector
Source: Santander US Capital Markets LLC, Bloomberg LP
This material is intended only for institutional investors and does not carry all of the independence and disclosure standards of retail debt research reports. In the preparation of this material, the author may have consulted or otherwise discussed the matters referenced herein with one or more of SCM’s trading desks, any of which may have accumulated or otherwise taken a position, long or short, in any of the financial instruments discussed in or related to this material. Further, SCM may act as a market maker or principal dealer and may have proprietary interests that differ or conflict with the recipient hereof, in connection with any financial instrument discussed in or related to this material.
This message, including any attachments or links contained herein, is subject to important disclaimers, conditions, and disclosures regarding Electronic Communications, which you can find at https://portfolio-strategy.apsec.com/sancap-disclaimers-and-disclosures.
Important Disclaimers
Copyright © 2026 Santander US Capital Markets LLC and its affiliates (“SCM”). All rights reserved. SCM is a member of FINRA and SIPC. This material is intended for limited distribution to institutions only and is not publicly available. Any unauthorized use or disclosure is prohibited.
In making this material available, SCM (i) is not providing any advice to the recipient, including, without limitation, any advice as to investment, legal, accounting, tax and financial matters, (ii) is not acting as an advisor or fiduciary in respect of the recipient, (iii) is not making any predictions or projections and (iv) intends that any recipient to which SCM has provided this material is an “institutional investor” (as defined under applicable law and regulation, including FINRA Rule 4512 and that this material will not be disseminated, in whole or part, to any third party by the recipient.
The author of this material is an economist, desk strategist or trader. In the preparation of this material, the author may have consulted or otherwise discussed the matters referenced herein with one or more of SCM’s trading desks, any of which may have accumulated or otherwise taken a position, long or short, in any of the financial instruments discussed in or related to this material. Further, SCM or any of its affiliates may act as a market maker or principal dealer and may have proprietary interests that differ or conflict with the recipient hereof, in connection with any financial instrument discussed in or related to this material.
This material (i) has been prepared for information purposes only and does not constitute a solicitation or an offer to buy or sell any securities, related investments or other financial instruments, (ii) is neither research, a “research report” as commonly understood under the securities laws and regulations promulgated thereunder nor the product of a research department, (iii) or parts thereof may have been obtained from various sources, the reliability of which has not been verified and cannot be guaranteed by SCM, (iv) should not be reproduced or disclosed to any other person, without SCM’s prior consent and (v) is not intended for distribution in any jurisdiction in which its distribution would be prohibited.
In connection with this material, SCM (i) makes no representation or warranties as to the appropriateness or reliance for use in any transaction or as to the permissibility or legality of any financial instrument in any jurisdiction, (ii) believes the information in this material to be reliable, has not independently verified such information and makes no representation, express or implied, with regard to the accuracy or completeness of such information, (iii) accepts no responsibility or liability as to any reliance placed, or investment decision made, on the basis of such information by the recipient and (iv) does not undertake, and disclaims any duty to undertake, to update or to revise the information contained in this material.
Unless otherwise stated, the views, opinions, forecasts, valuations, or estimates contained in this material are those solely of the author, as of the date of publication of this material, and are subject to change without notice. The recipient of this material should make an independent evaluation of this information and make such other investigations as the recipient considers necessary (including obtaining independent financial advice), before transacting in any financial market or instrument discussed in or related to this material.
Important disclaimers for clients in the EU and UK
This publication has been prepared by Trading Desk Strategists within the Sales and Trading functions of Santander US Capital Markets LLC (“SanCap”), the US registered broker-dealer of Santander Corporate & Investment Banking. This communication is distributed in the EEA by Banco Santander S.A., a credit institution registered in Spain and authorised and regulated by the Bank of Spain and the CNMV. Any EEA recipient of this communication that would like to affect any transaction in any security or issuer discussed herein should do so with Banco Santander S.A. or any of its affiliates (together “Santander”). This communication has been distributed in the UK by Banco Santander, S.A.’s London branch, authorised by the Bank of Spain and subject to regulatory oversight on certain matters by the Financial Conduct Authority (FCA) and the Prudential Regulation Authority (PRA).
The publication is intended for exclusive use for Professional Clients and Eligible Counterparties as defined by MiFID II and is not intended for use by retail customers or for any persons or entities in any jurisdictions or country where such distribution or use would be contrary to local law or regulation.
This material is not a product of Santander´s Research Team and does not constitute independent investment research. This is a marketing communication and may contain ¨investment recommendations¨ as defined by the Market Abuse Regulation 596/2014 ("MAR"). This publication has not been prepared in accordance with legal requirements designed to promote the independence of research and is not subject to any prohibition on dealing ahead of the dissemination of investment research. The author, date and time of the production of this publication are as indicated herein.
This publication does not constitute investment advice and may not be relied upon to form an investment decision, nor should it be construed as any offer to sell or issue or invitation to purchase, acquire or subscribe for any instruments referred herein. The publication has been prepared in good faith and based on information Santander considers reliable as of the date of publication, but Santander does not guarantee or represent, express or implied, that such information is accurate or complete. All estimates, forecasts and opinions are current as at the date of this publication and are subject to change without notice. Unless otherwise indicated, Santander does not intend to update this publication. The views and commentary in this publication may not be objective or independent of the interests of the Trading and Sales functions of Santander, who may be active participants in the markets, investments or strategies referred to herein and/or may receive compensation from investment banking and non-investment banking services from entities mentioned herein. Santander may trade as principal, make a market or hold positions in instruments (or related derivatives) and/or hold financial interest in entities discussed herein. Santander may provide market commentary or trading strategies to other clients or engage in transactions which may differ from views expressed herein. Santander may have acted upon the contents of this publication prior to you having received it.
This publication is intended for the exclusive use of the recipient and must not be reproduced, redistributed or transmitted, in whole or in part, without Santander’s consent. The recipient agrees to keep confidential at all times information contained herein.


