


The Big Idea
Supply points toward shifting from corporates to MBS
Steven Abrahams | December 12, 2025
This material is a Marketing Communication and does not constitute Independent Investment Research.
The investment grade corporate market looks set for a big year of growth next year with a boost from the need to fund data centers and AI infrastructure. And while estimates of Treasury market growth vary, the MBS market looks set to grow at the slowest pace of them all. Supply matters for spreads. If growth comes as expected, corporates should widen to MBS.
Big differences in expected net issuance in corporates, Treasuries, MBS
A range of analysts expect outstanding investment grade corporate debt to grow faster next year than any other major part of the debt market. Estimates of net issuance range from $670 billion to $800 billion with a sizable share used to finance data centers and other AI infrastructure. And that does not include AI infrastructure debt raised through ABS and CMBS. That would grow current outstanding par indexed investment grade debt by somewhere between 8.8% and 10.5%—the fastest pace in more than a decade (Exhibit 1).
Exhibit 1: Heavy net issuance expected in corporate debt, light net in MBS
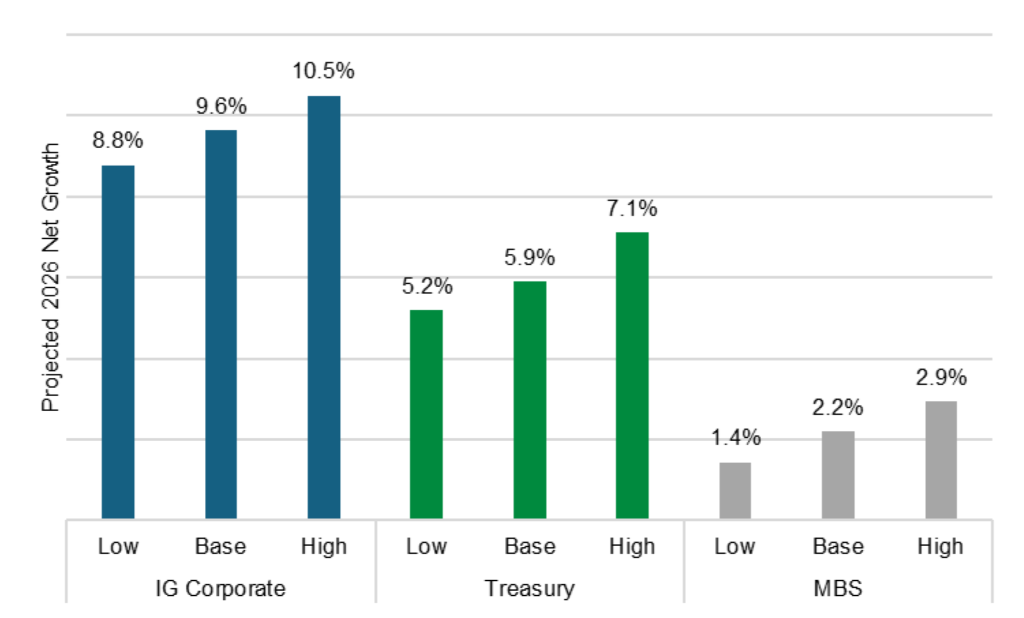
Source: Net IG corporate projections reflect the range of specific 2026 estimates across the Street and the par IG market index amount outstanding on Dec 10, 2025. Net Treasury projections reflect CBO federal deficit estimates adjusted for OBBB and tariffs and reflect estimates from the Committee for Responsible Federal Budget. Net MBS projections reflect Santander estimates of growth in outstanding agency MBS.
If that corporate growth shows up, it would be much faster than likely growth in outstanding marketable Treasury debt, a turnaround from recent years. Based on projections from the Congressional Budget Office along with the impact of the One Big Beautiful Bill and recent tariff revenue, the base US fiscal deficit looks like it could add 5.9% to current outstanding Treasury debt with a range of between 5.2% and 7.1%.
Some analysts expect net Treasury issuance will still outstrip net investment grade corporate growth next year, and that includes my colleague Dan Bruzzo. The US has faced relentless deficits since Covid, and deficits could go well beyond CBO projections.
If both corporate and Treasury growth show up in the ranges outlined, both would look much faster than agency MBS growth. New and existing home sales and a rise in mortgage balances stand to leave net issuance in agency MBS up somewhere between 1.4% and 2.9% of outstanding par MBS—a step up from the 1.6% growth this year. Growth in par indexed MBS could be even smaller since the index excludes Ginnie Mae custom pools, nearly 88% of this year’s net MBS issuance and a likely significant part of growth next year. The index this year grew 0.5%, well below the overall pace.
Spreads should reflect differences in net issuance
Relatively heavy net issuance in investment grade corporate debt should leave it vulnerable to widening against Treasury debt and MBS, all else equal. If Dan Bruzzo is right, corporate debt could still hold its ground against the Treasury curve while widening to MBS. And relatively light net issuance in agency MBS should leave it tighter to corporate and Treasury debt, all else equal.
Different rates of growth have clearly mattered for investment grade corporate debt and MBS, for example. When the corporate and MBS markets grow at the same pace, the corporate market over the last 10 years has traded at an average 82 bp OAS above the MBS market. But when the corporate market grows faster than MBS, the spread widens. And when it grows slower, the spread tightens (Exhibit 2). It’s a noisy relationship, but the trend is clear.
Exhibit 2: When corporate debt grows faster than MBS, the spread gap widens
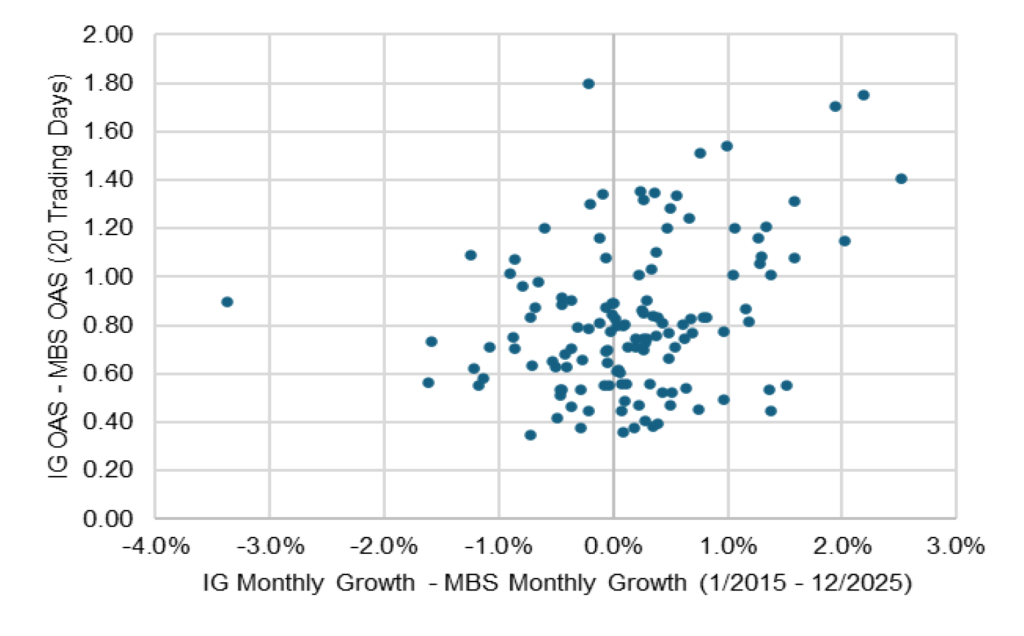
Note: Data reflects monthly percentage growth in the outstanding par amount of the Bloomberg US corporate bond index, the Bloomberg US MBS index and the 20-day average of the corporate and MBS index OAS.
Source: Bloomberg, Santander US Capital Markets
All else equal
The obvious caveat to focusing only on supply is the little thing called demand, but demand for corporate and Treasury debt and MBS is likely to be sticky in the short run. A minority of debt capital—mainly mutual funds and hedge funds—is set up to move quickly across sector lines to take advantage of shifting relative value. If corporate spreads widen, for example, money may not flow easily into the sector to take advantage and tighten spreads.
The other obvious caveat is fundamentals. If corporate fundamentals weaken or strengthen, or if MBS becomes more or less negatively convex, spreads should change. Changes in fundamentals look more plausible next year than changes in demand.
Absent significant changes in either demand or fundamentals, investment grade corporate debt looks set to widen to the Treasury and MBS markets next year under supply pressure, and the MBS market looks likely to tighten to the Treasury and corporate markets. Next year could be a big challenge for corporate performance after a consistently strong run since 2020, and a good year for MBS after inconsistent performance since 2020.
* * *
The view in rates
After months of handwringing and swings in market expectations, the December FOMC has come and gone. We are 25 bp lower in fed funds and moving into 2026. My colleague Stephen Stanley continues to expect no more cuts through 2026 as inflation continues to run above the Fed’s 2% target and the economy strengthens. It becomes hard for the Fed to cut under those circumstances.
It also seems better to own duration on the front of the yield curve than on the back, and the market has rewarded that positioning recently. The 2s10s Treasury slope broke out of its 50 bp to 60 bp range after the FOMC and is now trading at 66 bp. The back of the yield curve has to wrestle with Treasury supply and the prospect of weaker demand from Japan as yields on Japanese government bonds rise and draw demand away from Treasury debt.
Key market levels:
- Fed RRP balances settled on Friday at less than $1 billion as other repo rates offer much higher yields
- Setting on 3-month term SOFR traded Friday at 372 bp
- Further out the curve, the 2-year note traded Friday at 3.52%, down 4 bp in the last week. The 10-year note traded at 4.18%, up 4 bp in the last week
- The Treasury yield curve traded Friday with 2s10s at 66 bp, steeper by 9 bp in the last week. The 5s30s traded Friday at 111 bp, steeper by 3 bp
- Breakeven 10-year inflation traded Friday at 228 bp, up 1 bp in the last week. The 10-year real rate finished the week at 189 bp, up 4 bp in the last week
The view in spreads
Credit markets remain nervous. For investment grade corporate debt, the challenge next year looks like a sizable 9% to 11% jump in net supply. That could outstrip the 5% to 7% rate of growth in outstanding Treasury debt, widening the corporate-Treasury spread. Fundamentals for investment grade debt, however, still look strong. Smaller and more leveraged corporate balance sheets look more vulnerable, although without the supply risk of the investment grade market. Supply in MBS promises to be a relatively light 1% to 3%, or even less after excluding Ginnie Mae custom pools. That sets up MBS to tighten to both corporate and Treasury curves. The Bloomberg US investment grade corporate bond index OAS traded on Friday at 77 bp, tighter by 1 bp in a week. Nominal par 30-year MBS spreads to the blend of 5- and 10-year Treasury yields traded Friday at 122 bp, unchanged in the last week. Par 30-year MBS TOAS closed Friday at 21 bp, wider by 2 bp.
The view in credit
Bank lending to non-bank financial institutions, including private debt funds and business development companies, has expanded at an extraordinary pace in the last few years, raising the possibility that lending has outstripped experience and infrastructure for underwriting and monitoring. Bank regulators could ask banks next year to tap the breaks on that lending, tightening the private credit markets. Consumers in the lowest tier of income look vulnerable, and renewed student payments and cuts to government programs should keep the pressure on. The balance sheets of smaller companies show signs of rising leverage and lower operating margins. Leveraged loans also are showing signs of stress, with the combination of payment defaults and liability management exercises, or LMEs, often pursued instead of bankruptcy, back to 2020 post-Covid peaks.