


The Big Idea
Markets take leveraged loan stress in stride
Steven Abrahams | May 3, 2024
This material is a Marketing Communication and does not constitute Independent Investment Research.
While households and investment grade companies have largely funded with fixed-rate debt and insulated themselves for now from the direct impact of higher rates, borrowers in the leveraged loan market have not. Almost all the debt there floats, and the cost has gone up 482 bp since the end of 2021. As a case study in Fed impact, the market is showing clear signs of stress. Loans spreads nevertheless have tightened. Chalk it up to a market that has arguably anticipated stress but still likes the expected loss-adjusted yield.
Defaults and distressed exchanges show signs of stress
Arguably the most important thing to know for now about borrowers funded in the leveraged loan market is that they are showing clear signs of stress. Outright defaults over the last 12 months now hover around 2%, only slightly above the median since 1998 (Exhibit 1). But the combination of defaults and distressed exchanges—where investors exchange one loan for a smaller amount of a second loan to avoid larger losses from bankruptcy and liquidation—now stand at 4.33%. To put the larger number in context, that stands at the 80th percentile of the range of reported defaults since 1998—lower than 20% of periods but higher than 80% of periods. With the Fed likely on hold until late 2024, the incidence of defaults and distressed exchanges is likely to rise.
Exhibit 1: Total defaults and distressed exchanges shows pressure on the sector
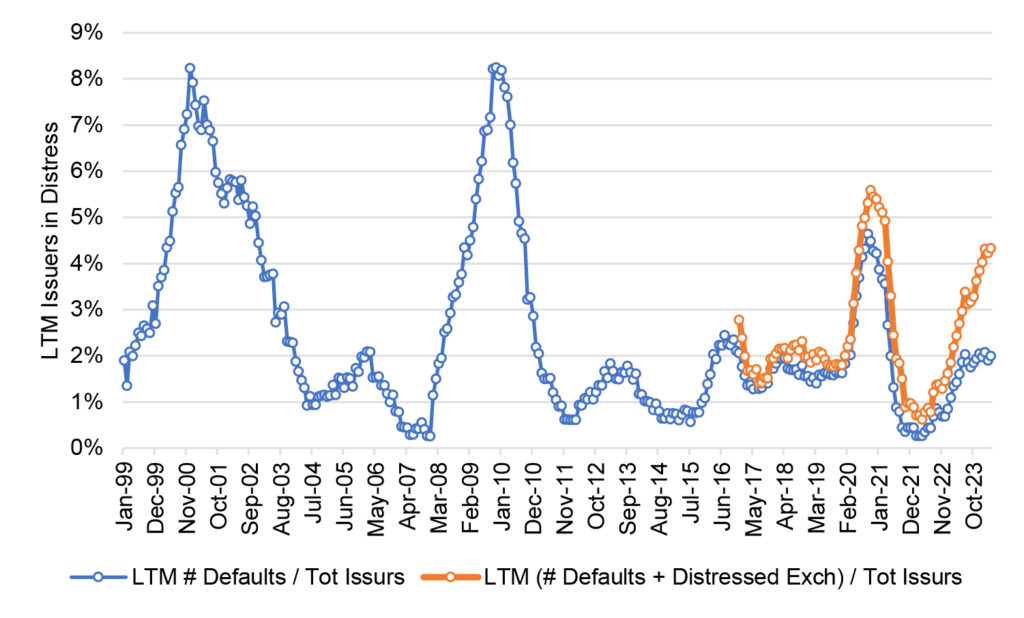
Note: LTM shows last 12 months.
Source: Pitchbook LCD, Santander US Capital Markets
Rating actions show a little less
Rating agency actions also reflect stress, but not as much as the default and distressed exchange numbers. Downgrades now run ahead of upgrades, a change since the Fed started tightening (Exhibit 2). For the three months ending in December 2021, before tightening, rating agencies upgraded 3.17% of outstanding issuers and downgraded 1.69%. For the three months ending in April this year, rating agencies had upgraded 3.11% of issuers but downgraded 5.66%. To put those numbers in context, the rate of upgrade is at the 53rd percentile of its distribution since early 2000—lower than 47% of reporting periods, higher than 53%. The downgrade rate is at the 65th percentile—lower than 35%, higher than 65%. In other words, the upgrade rate is typical, the downgrade rate is slightly elevated. A typical rate of upgrade and a slightly elevated rate of downgrade does not seem to paint a picture of distress although it does reflect pressure on sector credit.
Exhibit 2: Rates of upgrade look typical, downgrade look slightly elevated
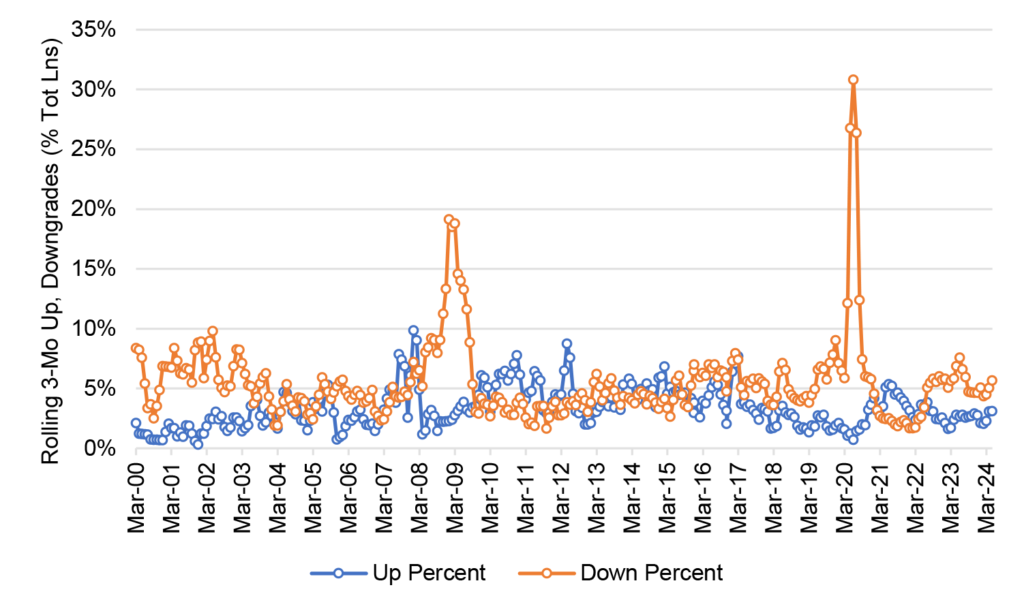
Source: Pitchbook LCD, Santander US Capital Markets
The pressure reflects higher funding costs—although spreads have tightened
The pressure on leveraged loans in part reflects the direct impact of Fed tightening. The average new loan in the $1.39 trillion leverage loan market carried an 8.90% coupon at the end of last year. That reflected a 3-month SOFR rate of 5.32% and a margin of 3.58% (Exhibit 3). Things have clearly changed with Fed action. The SOFR rate has jumped 5.16% since the end of 2021 while the margin has actually declined by 0.34%. The higher SOFR rate is clearly the Fed’s handiwork. The lower margin is the net result of the usual mix of supply, demand and fundamentals. More on that later.
Exhibit 3: Rates on new leveraged loans since 2021 have jumped 482 bp
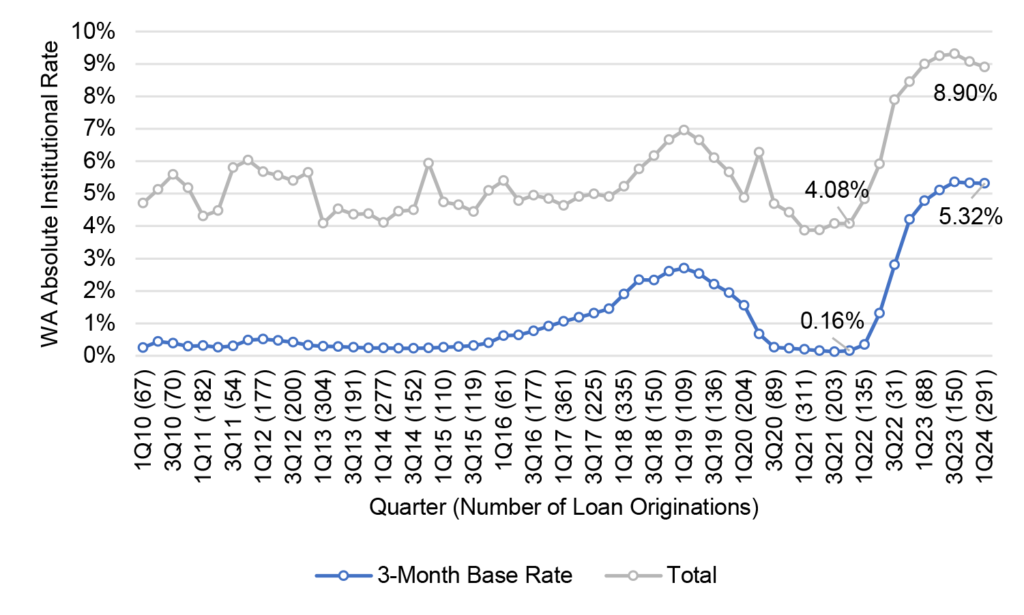
Note: Index is quarterly average 3mLIBOR through 2022, 3mSOFR afterwards.
Source: Pitchbook LCD, Santander US Capital Markets.
Higher rates have prompted some deleveraging
Borrowers in the leveraged loan market have tried to offset rising rates by deleveraging. At the end of 2021, the average leveraged borrower had $5.28 of debt for every $1 of earnings (Exhibit 4). By the end of 2023, that had dropped to $4.54 of debt for every $1 of earnings. Of course, that could reflect a mix of factors including less debt, higher earnings or even migration of more leveraged borrowers into private credit or other markets. So far this year, debt-to-earnings has bounced a little higher. Nevertheless, this broad measure of leverage is still down through the hiking cycle so far.
Exhibit 4: Debt-to-earnings leverage has dropped since 2021
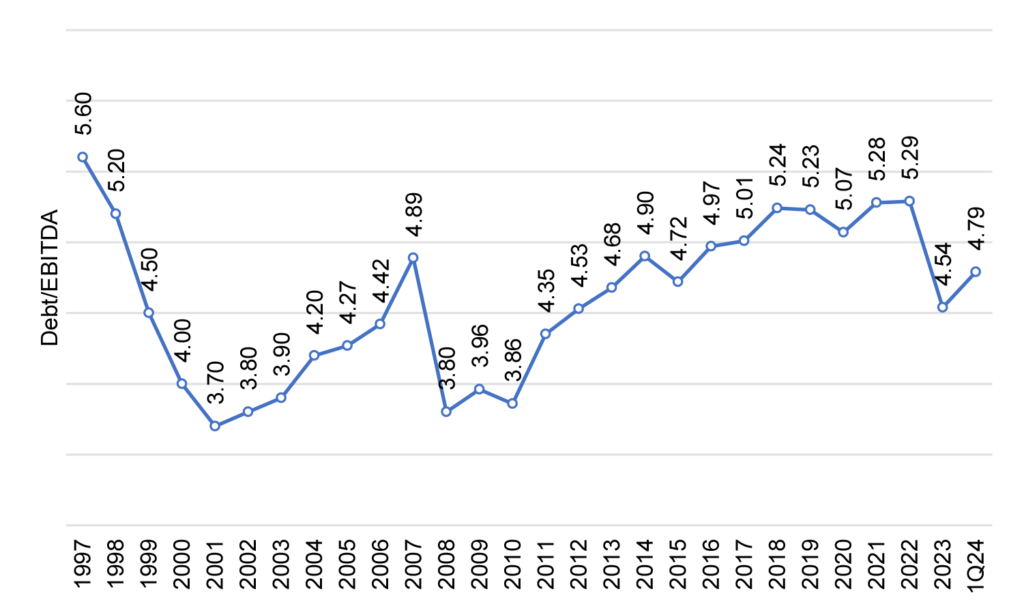
Source: Pitchbook LCD, Santander US Capital Markets
But despite deleveraging, funding cost has outstripped earnings
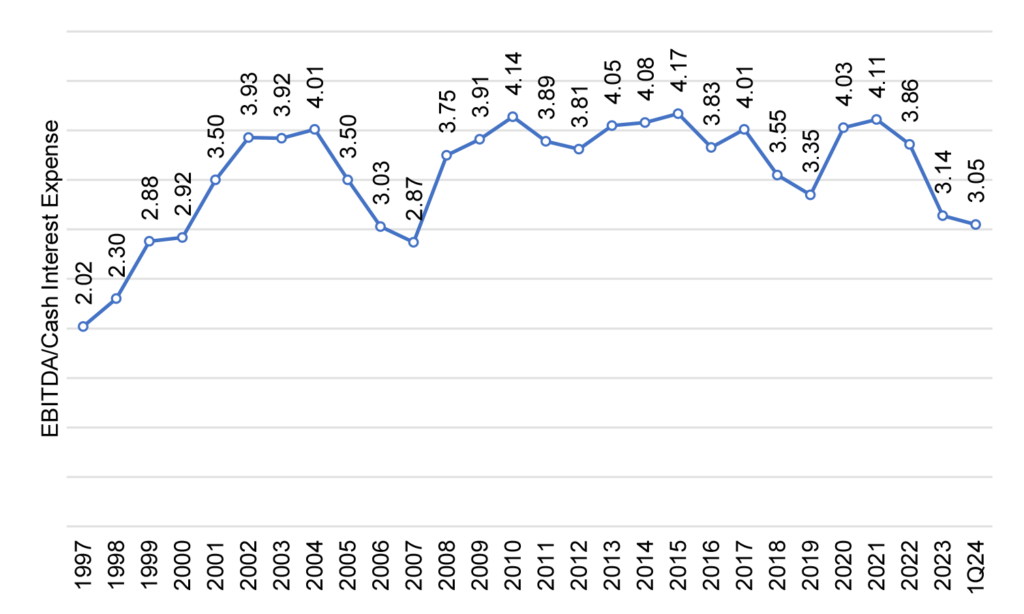
But despite reducing debt for every $1 of earnings, earnings have not kept up with rising interest expense. At the end of 2021, the averaged leveraged borrower had $4.11 in earnings for every $1 of interest paid, one of the highest readings since the late 1990s (Exhibit 5). At that end of March, that stood at $3.05 in earnings for every $1 of interest paid. That is the lowest level since 2007. It also reflects the pattern of every prior round of Fed tightening—including 2004 to 2006 and 2015 to 2018—where debt service coverage drops. By this measure, the more important of the two since it directly reflects ability to pay, borrowers have become more leveraged.
Exhibit 5: Interest coverage has dropped since 2021
Source: Pitchbook LCD, Santander US Capital Markets
Demand nevertheless remains robust
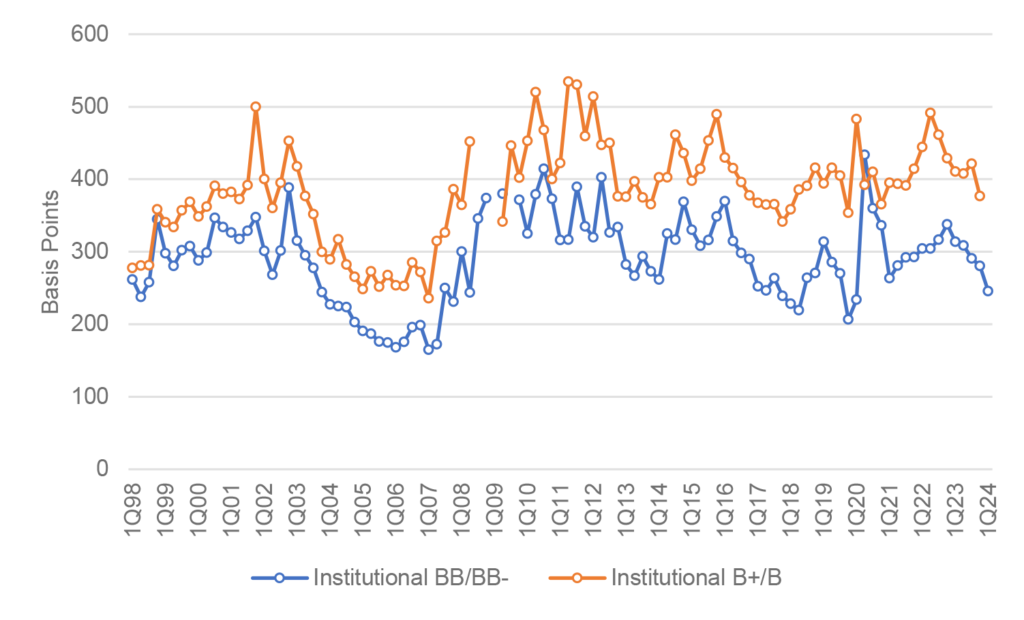
Despite the stress among leveraged borrowers—anticipated here and elsewhere ever since the Fed started hiking—spreads on ‘BB/BB-‘ and ‘B+/B’ loans have nevertheless tightened since late 2021 (Exhibit 6). Part of that is due to a leveraged loan market that has slightly contracted since 2021 while the CLO market has grown. From that angle, supply has lagged demand and spreads consequently should tighten. But that begs the question of why demand has been robust while credit fundamentals have deteriorated.
Exhibit 6: New issue spreads on leveraged loans have tightened since 2021
Source: Pitchbook LCD, Santander US Capital Markets
Loss-adjusted yields look attractive
That answer to robust demand may be in expected loss-adjusted yields on leveraged loans. Historical recovery rates have run between 70% and 80%, although changes in loan covenants in recent years have led many investors to assume potential recoveries as low as 50%. Even at that low recovery rate, losses on defaults or distressed exchanges would have to reach nearly 7.20% to breakeven to a riskless SOFR return. That rate of distress would be in the neighborhood of default rates that prevailed through the bursting of the Internet bubble in 2000 or the Global Financial Crisis in 2010. That seems inconsistent with reasonable prospects for a soft landing at the end of the current Fed hiking cycle. In other words, investors in leveraged loans anticipated the current stress and expect to take losses on loans, but not losses large enough to offset the returns in a diversified portfolio relative to alternative uses of their capital.
The case study of leveraged loans shows the Fed having exactly its intended effect—driving up interest costs and eliminating the weakest fringe of growth. It also shows investors aware of the likely risk-adjusted return to a diversified asset class. That return still looks attractive.
* * *
The view in rates
Fed funds futures anticipate 34 bp of easing this year as of the Friday close, up 1 bp from a week ago. A week ago, not a single meeting has an implied probability of a cut greater than 40%. Now the market sees a 48% chance of September and a 54% chance of December. It’s still all about sticky inflation. Work by staff at the San Francisco Fed implies that tighter policy already has driven down inflation in price categories quick to respond to policy and may have a diminishing effect on remaining categories. In the aftermath of the latest FOMC, implied rate volatility has dropped.
Other key market levels:
- Fed RRP balances closed Friday at $450 billion, down $14 billion in the last week. RRP balances have bounced between $400 billion and $500 billion since the start of March. That range has held despite yields on most Treasury bills running well above the RRP’s 5.30% rate. One explanation could be the rise in balances at money market mutual funds. Those funds need to keep their weighted average life short, and RRP may be the best overnight game in town. The funds could be allocating some of their new inflows to RRP.
- Setting on 3-month term SOFR closed Friday at 533 bp, unchanged on the week
- Further out the curve, the 2-year note closed Friday near 4.82%, down 17 bp this week. The 10-year note closed at 4.51%, down 15 bp this week.
- The Treasury yield curve closed Friday afternoon with 2s10s at -31, steeper by 2 bp this week. The 5s30s closed Friday at 17 bp, steeper by 8 bp over the same period.
- Breakeven 10-year inflation traded Friday at 236 bp, down 7 bp this week. The 10-year real rate finished the week at 215 bp, down 9 bp this week.
The view in spreads
Lower implied volatility after the latest FOMC should create room for spreads in all risk assets to tighten a little further. But credit still has the most momentum with a strong bid from insurers and mutual funds, the former often funded with annuities and the later getting strong inflows in 2024. The broad trend to higher Treasury supply also helps in the background.
The Bloomberg US investment grade corporate bond index OAS closed Friday at 87 bp, tighter by 2 bp this week. Nominal par 30-year MBS spreads to the blend of 5- and 10-year Treasury yields traded Friday at 142 bp, tighter by 6 bp this week but volatile lately. Par 30-year MBS TOAS closed Friday at 38 bp, tighter by 5 bp this week. Both nominal and option-adjusted spreads on MBS look rich. Fair value in MBS is likely closer to 70 bp in OAS, so widening toward fair value looks reasonable.
The view in credit
Higher interest rate should raise concerns about the credit quality of the most leverage corporate balance sheets and commercial office properties. Most investment grade corporate and most consumer sheets have fixed-rate funding and look relatively well protected against higher interest rates—even if Fed easing comes late this year. Healthy stocks of cash and liquid assets also allow these balance sheets to absorb a moderate squeeze on income. Consumer balance sheets also benefit from record levels of home equity and steady gains in real income. Consumer delinquencies show no clear signs of stress. Less than 7% of investment grade debt matures in 2024, so those balance sheets have some time. But other parts of the market funded with floating debt continue to look vulnerable. Leveraged and middle market balance sheets are vulnerable. At this point, mainly ‘B-‘ loans show clear signs of cash burn. Commercial office real estate looks weak along with its mortgage debt. Credit backing public securities is showing more stress than comparable credit on bank balance sheets. As for the consumer, subprime auto borrowers and younger households borrowing on credit cards, among others, are starting to show some cracks with delinquencies rising quickly. The resumption of payments on government student loans should add to consumer credit pressure.