


The Big Idea
The clash of private credit and syndicated lending continues
Steven Abrahams | April 12, 2024
This document is intended for institutional investors and is not subject to all of the independence and disclosure standards applicable to debt research reports prepared for retail investors. This material does not constitute research.
The competition between private credit and broadly syndicated lending continues, although the outlines of a steady state are getting clearer. Private credit seems to dominate when the borrower needs quick turnaround and certainty of pricing and execution. Syndicated lending competes more effectively when rate and ability to call the debt matter more. As market conditions and borrower needs change, so change the relative fortunes of these competing sources of funds.
While the differences between private credit and syndicated lending keep evolving, the simplest difference is that private credit involves a direct loan from one or a few non-bank lenders while syndicated lending involves participation from dozens or even hundreds of banks. Private lenders often can underwrite the corporate borrower faster, can commit to final deal size and pricing instead of committing to best-efforts and typically do not need the loan rated. The tradeoff comes in interest rate and other terms. Borrowers that left the syndicated loan market in 2023 to get a private loan on average paid 260 bp more, according to Fitch’s CreditSights group. And private loans come with higher penalties for prepaying the loans. Syndicated loans often come with soft call protection for six months with a 1% penalty. But more than 80% of 2022 private deals included hard call protection for 24 months with 1% to 2% penalties, according to Proskauer, with the balance often including non-call periods with make-whole provisions.
It is no surprise that private credit dominates LBO financing. An LBO sponsor often is in competition with others and needs fast and certain loan pricing to finalize its bid and win a deal. Private credit has steadily taken share of LBO financings from syndicated lenders since at least the end of 2020 and in the first quarter of this year funded roughly seven LBOs for every single LBO funded by syndicated lenders (Exhibit 1).
Exhibit 1: Private credit has come to dominate LBO financing
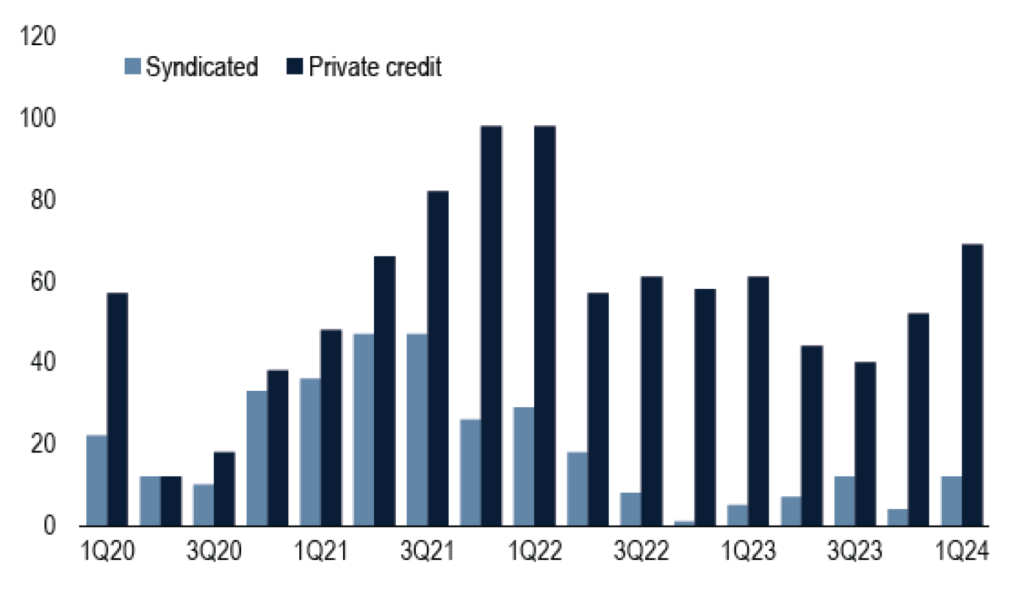
Note: Data shows counts of LBO deals by type of financing through March 31, 2024.
Source: PitchBook | LCD.
In deals away from LBOs such as refinancings, M&A and other uses of proceeds, syndicated loans compete more effectively. Syndicated loans lost market share to private credit in 2022 and 2023 but have regained share this year, almost certainly because of tightening spreads in syndicated loans and an increasing interest rate advantage (Exhibit 2). For every non-LBO deal funded by private credit in the first quarter this year, syndicated lending roughly matched it.
Exhibit 2: More parity between private credit and BSLs away from LBOs
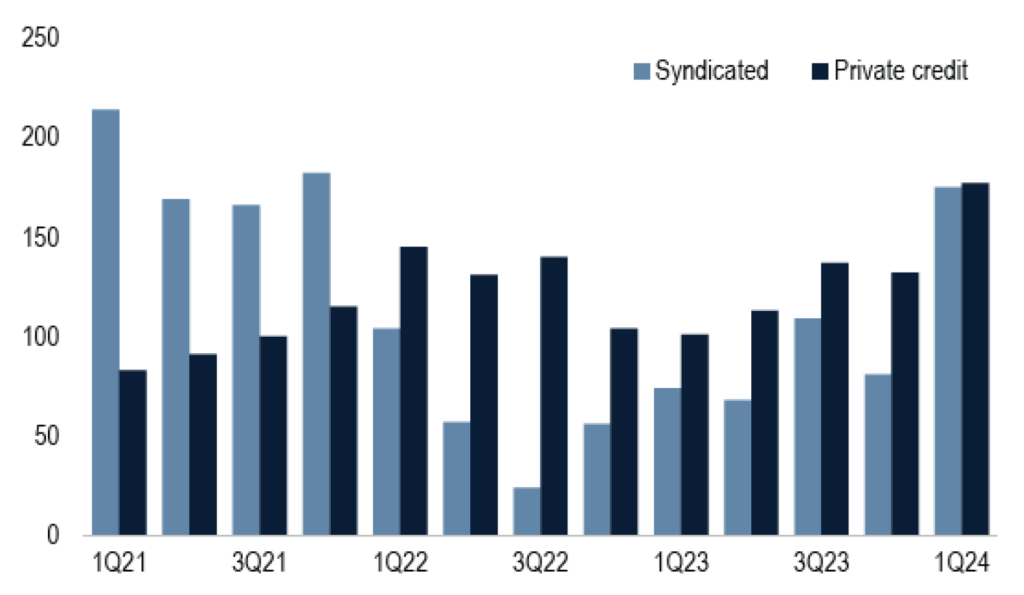
Note: Data shows count of non-LBO deals by type of financing through March 31, 2024.
Source: PitchBook | LCD.
It seems likely that private and syndicated lending will end up in a type of peaceful coexistence in the long run, as least on loans large enough where bank syndicates would have interest. Private lending should continue to dominate LBO financing where speed, certainty, tolerance for leverage and flexibility of terms are paramount. But as the business and balance sheet of the leveraged firm matures and presumably strengthens, syndicated loans seem a natural source of refinancing for the private debt despite longer timelines and more standardized terms. Private debt funds already anticipate their loans will have average lives around three years in part because many refinance into syndicated loans.
The competition between private credit and syndicated lending is almost certain to continue because of the roughly $1 trillion of undeployed capital sitting in private equity funds (Exhibit 3). That is split roughly equally between middle market private equity and funds that target bigger transactions. Plenty of that capital should find its way into LBOs that need private credit to win the deal, but the syndicated loan market should be waiting a few years down the road to refinance the private loan and fund the company through its next phase.
Exhibit 3: Nearly $1 trillion in undeployed private equity capital
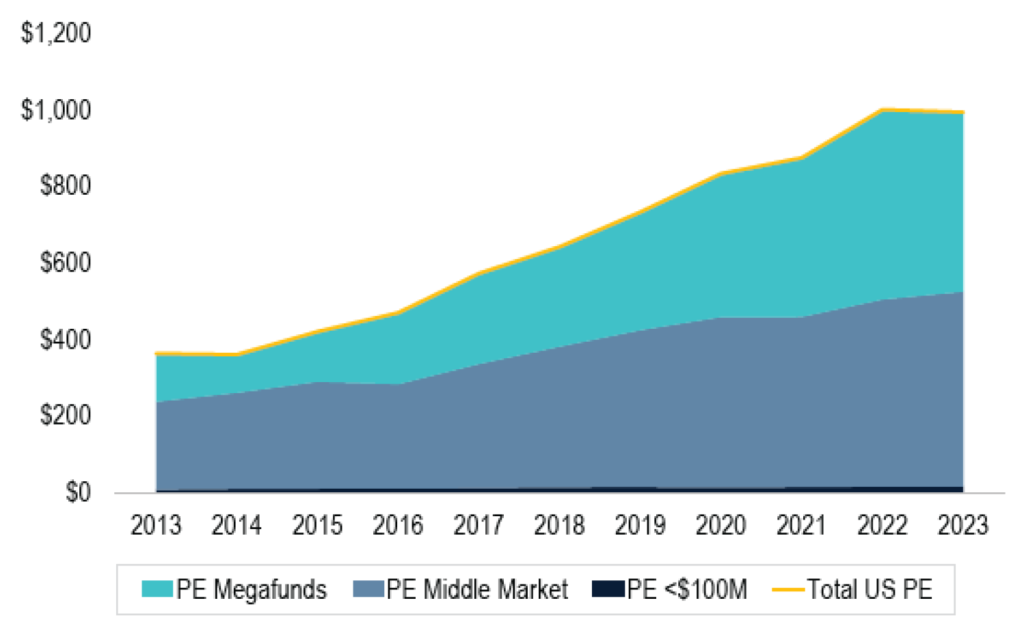
Note: Figures in $ billion through December 31, 2023.
Source: PitchBook
* * *
The view in rates
Signs of persistent inflation in the latest CPI numbers have led fed funds futures to revise anticipated 2024 easing from 65 bp a week ago to 39 bp as of the Friday close. The implied probability of a cut in June has dropped from 50% to nearly 25%. And as Stephen Stanley points out, time is running out for the Fed to begin a campaign of easing without appearing to exert political influence ahead of US elections in November. Work by staff at the San Francisco Fed implies that tighter policy already has driven down inflation in price categories quick to respond to policy and may have a diminishing effect on remaining categories. The Fed increasingly looks like it will wait until late this year for its first cut. With the latest inflation numbers and repricing of the Fed path, implied rate volatility has quickly jumped from the lower end of the range so far this year to above average.
Other key market levels:
- Fed RRP balances closed Friday at $407 billion. RRP balances have bounced between $400 billion and $500 billion since the start of March. That range has held despite yields on most Treasury bills running above the RRP’s 5.30% rate. One explanation could be the rise in balances at money market mutual funds, which hit a record $6.11 trillion as of April 3. Those funds need to keep their weighted average life short, and RRP may be the best overnight game in town. The funds could be allocating some of their new inflows to RRP.
- Setting on 3-month term SOFR closed Friday at 533 bp, up 4 bp on the week
- Further out the curve, the 2-year note closed Friday near 4.90%, up 15 bp this week. The 10-year note closed at 4.52%, up 12 bp this week.
- The Treasury yield curve closed Friday afternoon with 2s10s at -38, steeper by 3 bp this week. The 5s30s closed Friday at 7 bp, flatter by 9 bp over the same period.
- Breakeven 10-year inflation traded Friday at 240 bp, higher by 3 bp this week. The 10-year real rate finished the week at 213 bp, up 10 bp this week.
The view in spreads
Little has changed here in the last week. Credit has momentum and a strong bid from insurers and mutual funds, the former often funded with annuities and the later getting strong inflows in 2024. The broad trend to higher Treasury supply also helps in the background. Credit spreads should trade stable to tighter for the foreseeable future. The fact that markets have now priced to the Fed dots also looks bullish for credit spreads.
The Bloomberg US investment grade corporate bond index OAS closed Friday at 89 bp, tighter by 1 bp this week. Nominal par 30-year MBS spreads to the blend of 5- and 10-year Treasury yields traded Friday at 148 bp, wider by 10 bp this week but volatile lately. Par 30-year MBS TOAS closed Friday at 43 bp, wider by 8 bp this week. Both nominal and option-adjusted spreads on MBS look rich. Fair value in MBS is likely closer to 70 bp in OAS, so widening toward fair value looks reasonable.
The view in credit
Higher interest rate will raise concerns about the credit quality of the most leverage corporate balance sheets and commercial office properties. Most investment grade corporate and most consumer sheets have fixed-rate funding and look relatively well protected against higher interest rates—even if Fed easing comes late this year. Healthy stocks of cash and liquid assets also allow these balance sheets to absorb a moderate squeeze on income. Consumer balance sheets also benefit from record levels of home equity and steady gains in real income. Consumer delinquencies show no clear signs of stress. Less than 7% of investment grade debt matures in 2024, so those balance sheets have some time. But other parts of the market funded with floating debt continue to look vulnerable. Leveraged and middle market balance sheets are vulnerable. At this point, mainly ‘B-‘ loans show clear signs of cash burn. Commercial office real estate looks weak along with its mortgage debt. Credit backing public securities is showing more stress than comparable credit on bank balance sheets. As for the consumer, subprime auto borrowers and younger households borrowing on credit cards, among others, are starting to show some cracks with delinquencies rising quickly. The resumption of payments on government student loans should add to consumer credit pressure.