The Big Idea
More Treasury supply, tighter risk spreads
This material is a Marketing Communication and does not constitute Independent Investment Research.
The Treasury market continues to grow faster than nominal GDP while risk assets grow more slowly. If that trend continues and if the US gets a soft landing with falling market volatility, risk spreads in the next few years could reach some of their tightest levels ever. For evidence, just look to swap spreads.
Work by the Treasury Borrowing Advisory Committee, the World Bank and others consistently finds that Treasury supply affects swap spreads. Heavy supply, measured either directly as outstanding debt as a share of GDP or indirectly as the federal deficit as a share of GDP, tends to coincide with tighter spreads. In other words, Treasury yields rise relative to swaps. And light or falling supply coincides with wide spreads as Treasury yields falls relative to swaps. Some of the widest spreads in the history of the swap markets, for example, came in the late 1990s as the US ran a federal surplus and outstanding Treasury supply fell.
Other things matter, too, of course. Credit spreads matter for LIBOR swaps, reflecting the creditworthiness of the banks setting LIBOR rates, but likely not for SOFR swaps collateralized by Treasury debt. The steepness of the yield curve can matter. A steeper curve encourages more demand to receive fixed and tightens swap yields relative to Treasury and a flat or inverted curve encourages more demand to pay fixed and widens spreads. Treasury repo rates and proxies for MBS hedging also influence spreads. But after accounting for these influences, shifting Treasury supply still matters, too.
The Congressional Budget Office’s latest federal budget outlook projects outstanding marketable Treasury debt as a share of GDP will climb well above 100% in the next few years and accelerate for decades (Exhibit 1). A decade is a long time, and changes in economic growth, tax rates, spending or a combination of these can have a big impact on federal deficits and Treasury supply. Nevertheless, the trend is toward more debt rather than less and tighter spreads rather than wider.
Exhibit 1: The CBO projects a significant rise in outstanding Treasury supply
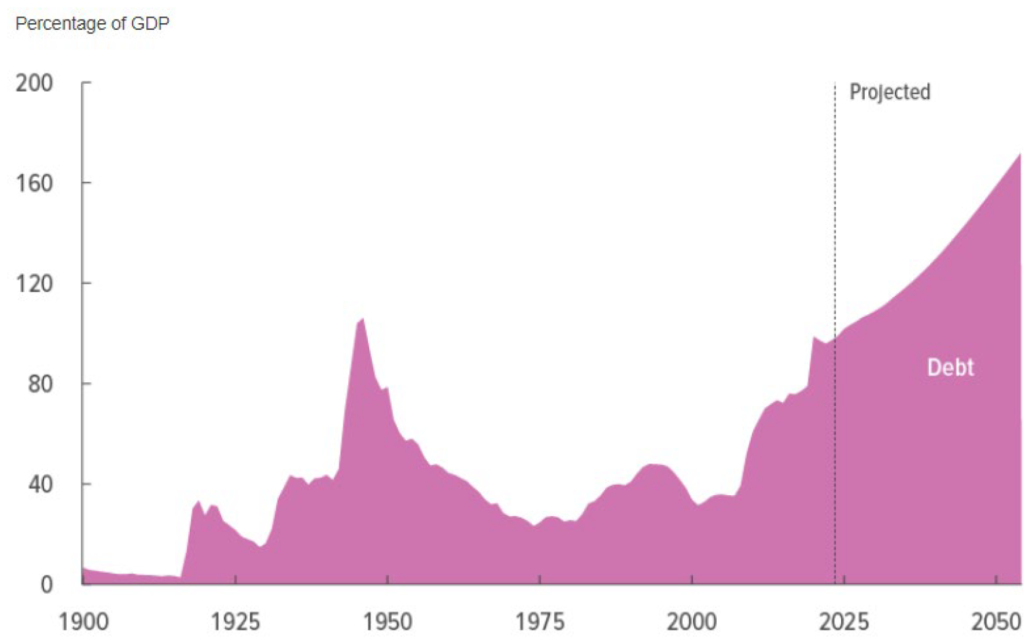
Note: Data show projected outstanding marketable Treasury debt as a percentage of GDP.
Source: Congressional Budget Office 2024, Santander US Capital Markets.
Although most of the work on Treasury supply has focused on LIBOR swap spreads—the history of SOFR swap spreads being too short—the findings should apply to most risk assets, too. As long as Treasury supply is growing faster, spreads on risk assets should tighten.
A steady bias toward tighter spreads could cloud a lot of analysis that screens for value by looking at spreads against historic levels. Showing that spreads look tight to history and calling an asset rich may not be enough. The analysis should adjust for the size of the Treasury market as a share of GDP. Only then might a little lesson in spread history offer a clear picture of relative value.
* * *
The view in rates
Fed funds futures still reflect three cuts by December, with a 50% chance that the first cut come in June. That will not happen if Stephen Stanley is right and the Fed stays on hold through the November US elections. Whether the market or Stanley wins will likely depend on the path of inflation into July. If it is down significantly, which seems unlikely, the Fed could start cutting at that month’s meeting. If not, the Fed likely waits for politics to settle. Implied rate volatility remains elevated, although now at the lowest point of the year.
Other key market levels:
- Fed RRP balances closed Thursday at $461 billion, up $47 billion this week but part of a steady trend down since April 2023. Yields on some short Treasury bills this week have dropped below the RRP’s 5.30% rate, making RRP at least temporarily more attractive. Continuing QT should keep draining cash from the financial system and bringing RRP balances down.
- Setting on 3-month term SOFR traded Friday at 532 bp, unchanged so far this week.
- Further out the curve, the 2-year note closed Friday near 4.64%, down 9 bp this week. The 10-year note closed at 4.27%, down 4 bp this week.
- The Treasury yield curve closed Friday afternoon with 2s10s at -37, steeper by 5 bp this week. The 5s30s closed Friday at 18 bp, steeper by 8 bp over the same period.
- Breakeven 10-year inflation traded Friday at 235 bp, higher by 3 bp this week. The 10-year real rate finished the week at 191 bp, down 8 bp this week.
The view in spreads
Little has changed here in the last week. Credit has momentum and a strong bid from insurers and mutual funds, the former often funded with annuities and the later getting strong inflows. The broad trend to higher Treasury supply also helps in the background. Credit spreads should trade stable to tighter for the foreseeable future. The fact that markets have now priced to the Fed dots also looks bullish for credit spreads.
The Bloomberg US investment grade corporate bond index OAS closed Friday at 88 bp, tighter by 3 bp this week. Nominal par 30-year MBS spreads to the blend of 5- and 10-year Treasury yields traded Friday at 141 bp, tighter by 9 bp this week but volatile lately. Par 30-year MBS TOAS closed Friday at 39 bp, tighter by 6 bp this week. Both nominal and option-adjusted spreads on MBS look rich. Fair value in MBS is likely closer to 70 bp in OAS, so widening toward fair value looks reasonable.
The view in credit
Credit fundamentals also look little changed in the last week. Most investment grade corporate and most consumer sheets look relatively well protected against higher interest rates, and eventual Fed easing—even if easing comes late this year—should relieve pressure from interest rate expense and falling liquidity. Fixed-rate funding has large blunted the impact of higher rates on both those corporate and consumer balance sheets, and healthy stocks of cash and liquid assets allow these balance sheets to absorb a moderate squeeze on income. Consumer balance sheets also benefit from record levels of home equity and steady gains in real income. Consumer delinquencies show no clear signs of stress. Less than 7% of investment grade debt matures in 2024, so those balance sheets have some time. But other parts of the market funded with floating debt continue to look vulnerable. Leveraged and middle market balance sheets are vulnerable. At this point, mainly ‘B-‘ loans show clear signs of cash burn. Commercial office real estate looks weak along with its mortgage debt. Credit backing public securities is showing more stress than comparable credit on bank balance sheets. As for the consumer, subprime auto borrowers and younger households borrowing on credit cards, among others, are starting to show some cracks with delinquencies rising quickly. The resumption of payments on government student loans should add to consumer credit pressure.
This material is intended only for institutional investors and does not carry all of the independence and disclosure standards of retail debt research reports. In the preparation of this material, the author may have consulted or otherwise discussed the matters referenced herein with one or more of SCM’s trading desks, any of which may have accumulated or otherwise taken a position, long or short, in any of the financial instruments discussed in or related to this material. Further, SCM may act as a market maker or principal dealer and may have proprietary interests that differ or conflict with the recipient hereof, in connection with any financial instrument discussed in or related to this material.
This message, including any attachments or links contained herein, is subject to important disclaimers, conditions, and disclosures regarding Electronic Communications, which you can find at https://portfolio-strategy.apsec.com/sancap-disclaimers-and-disclosures.
Important Disclaimers
Copyright © 2026 Santander US Capital Markets LLC and its affiliates (“SCM”). All rights reserved. SCM is a member of FINRA and SIPC. This material is intended for limited distribution to institutions only and is not publicly available. Any unauthorized use or disclosure is prohibited.
In making this material available, SCM (i) is not providing any advice to the recipient, including, without limitation, any advice as to investment, legal, accounting, tax and financial matters, (ii) is not acting as an advisor or fiduciary in respect of the recipient, (iii) is not making any predictions or projections and (iv) intends that any recipient to which SCM has provided this material is an “institutional investor” (as defined under applicable law and regulation, including FINRA Rule 4512 and that this material will not be disseminated, in whole or part, to any third party by the recipient.
The author of this material is an economist, desk strategist or trader. In the preparation of this material, the author may have consulted or otherwise discussed the matters referenced herein with one or more of SCM’s trading desks, any of which may have accumulated or otherwise taken a position, long or short, in any of the financial instruments discussed in or related to this material. Further, SCM or any of its affiliates may act as a market maker or principal dealer and may have proprietary interests that differ or conflict with the recipient hereof, in connection with any financial instrument discussed in or related to this material.
This material (i) has been prepared for information purposes only and does not constitute a solicitation or an offer to buy or sell any securities, related investments or other financial instruments, (ii) is neither research, a “research report” as commonly understood under the securities laws and regulations promulgated thereunder nor the product of a research department, (iii) or parts thereof may have been obtained from various sources, the reliability of which has not been verified and cannot be guaranteed by SCM, (iv) should not be reproduced or disclosed to any other person, without SCM’s prior consent and (v) is not intended for distribution in any jurisdiction in which its distribution would be prohibited.
In connection with this material, SCM (i) makes no representation or warranties as to the appropriateness or reliance for use in any transaction or as to the permissibility or legality of any financial instrument in any jurisdiction, (ii) believes the information in this material to be reliable, has not independently verified such information and makes no representation, express or implied, with regard to the accuracy or completeness of such information, (iii) accepts no responsibility or liability as to any reliance placed, or investment decision made, on the basis of such information by the recipient and (iv) does not undertake, and disclaims any duty to undertake, to update or to revise the information contained in this material.
Unless otherwise stated, the views, opinions, forecasts, valuations, or estimates contained in this material are those solely of the author, as of the date of publication of this material, and are subject to change without notice. The recipient of this material should make an independent evaluation of this information and make such other investigations as the recipient considers necessary (including obtaining independent financial advice), before transacting in any financial market or instrument discussed in or related to this material.
Important disclaimers for clients in the EU and UK
This publication has been prepared by Trading Desk Strategists within the Sales and Trading functions of Santander US Capital Markets LLC (“SanCap”), the US registered broker-dealer of Santander Corporate & Investment Banking. This communication is distributed in the EEA by Banco Santander S.A., a credit institution registered in Spain and authorised and regulated by the Bank of Spain and the CNMV. Any EEA recipient of this communication that would like to affect any transaction in any security or issuer discussed herein should do so with Banco Santander S.A. or any of its affiliates (together “Santander”). This communication has been distributed in the UK by Banco Santander, S.A.’s London branch, authorised by the Bank of Spain and subject to regulatory oversight on certain matters by the Financial Conduct Authority (FCA) and the Prudential Regulation Authority (PRA).
The publication is intended for exclusive use for Professional Clients and Eligible Counterparties as defined by MiFID II and is not intended for use by retail customers or for any persons or entities in any jurisdictions or country where such distribution or use would be contrary to local law or regulation.
This material is not a product of Santander´s Research Team and does not constitute independent investment research. This is a marketing communication and may contain ¨investment recommendations¨ as defined by the Market Abuse Regulation 596/2014 ("MAR"). This publication has not been prepared in accordance with legal requirements designed to promote the independence of research and is not subject to any prohibition on dealing ahead of the dissemination of investment research. The author, date and time of the production of this publication are as indicated herein.
This publication does not constitute investment advice and may not be relied upon to form an investment decision, nor should it be construed as any offer to sell or issue or invitation to purchase, acquire or subscribe for any instruments referred herein. The publication has been prepared in good faith and based on information Santander considers reliable as of the date of publication, but Santander does not guarantee or represent, express or implied, that such information is accurate or complete. All estimates, forecasts and opinions are current as at the date of this publication and are subject to change without notice. Unless otherwise indicated, Santander does not intend to update this publication. The views and commentary in this publication may not be objective or independent of the interests of the Trading and Sales functions of Santander, who may be active participants in the markets, investments or strategies referred to herein and/or may receive compensation from investment banking and non-investment banking services from entities mentioned herein. Santander may trade as principal, make a market or hold positions in instruments (or related derivatives) and/or hold financial interest in entities discussed herein. Santander may provide market commentary or trading strategies to other clients or engage in transactions which may differ from views expressed herein. Santander may have acted upon the contents of this publication prior to you having received it.
This publication is intended for the exclusive use of the recipient and must not be reproduced, redistributed or transmitted, in whole or in part, without Santander’s consent. The recipient agrees to keep confidential at all times information contained herein.


