


The Big Idea
Rounding up the usual suspects behind higher rates
Steven Abrahams | October 27, 2023
This material is a Marketing Communication and does not constitute Independent Investment Research.
The rise in longer rates since June has encouraged a lot of people to round up the usual suspects for an explanation. Supply and demand. Inflation and growth. Fed policy. Term premium. There may be others. But pull the data, run the numbers and try to get them to confess. The explanations still come up short. Something else must be going on for 10-year yields to approach 5%. We need a better theory for higher rates.
At this point, even The New York Times has started to wrestle with the conflicting forces driving longer rates:

Despite the broad debate, the relative magnitude of these effects and their day-to-day influence is still unclear and important. The rise in longer rates and their drag on the economy has started to influence the Fed, but, as Bill Nelson at the Bank Policy Institute points out, the reason for the rise matters. As Chair Powell recently suggested, if rates have moved higher because expected inflation or growth has gone up, the Fed may need to tighten more. If rates have moved because expected short rates have gone up in line with the Fed’s outlook, then the Fed only needs to deliver on expectations. If it’s a rise in perceived risk or term premium, then the Fed might lean toward easing. And if higher rates reflect expected heavy Treasury borrowing, then the next policy step is unclear.
Putting numbers on the impact these factors have on rates is notoriously hard but possible. Francis and Veronica Warnock have measured the impact of foreign investment on US rates, and their approach has become one of the most widely cited. It has the appeal of simplicity. Following their lead, it is straightforward to pull a few measures of these key factors from January 2012 through September this year:
- Monthly constant maturity 10-year Treasury rates
- Expected 10-year-ahead inflation, pulled from the Philly Fed’s quarterly Survey of Professional Forecasters and interpolated to a monthly value
- Expected 1-year-ahead real GDP growth, also pulled from the Philly Fed’s quarterly Survey of Professional Forecasters and interpolated to a monthly value
- Expected risk, measured by 5-year forward 5-year normal rate volatility implied by options on overnight index swaps
- Expected Fed policy, measured by 3-month overnight index swaps,
- The federal deficit, typically a negative value measured by the cumulative federal deficit over the last 12 months as a percent of current GDP. This measure could either proxy expected supply, if it leads the market to expect further deficits and Treasury supply, or proxy a weakening economy if the deficit signals federal stimulus
- Demand from the Fed, measured by Fed Treasury holdings as a percent of outstanding marketable debt, and
- Demand from foreign investors, measured by foreign holdings as a percent of outstanding marketable debt
Following the Warnocks and using the most ordinary of regressions on the levels of these measures leads to a fairly good picture of actual 10-year rates and the rates expected from all these influences. The 10-year rate expected from modeling the impact of these factors tracks actual 10-year rates through most markets since 2012, especially since 2020 (Exhibit 1).
Exhibit 1: Inflation, growth, risk, policy, supply, demand explain most of 10Y rates
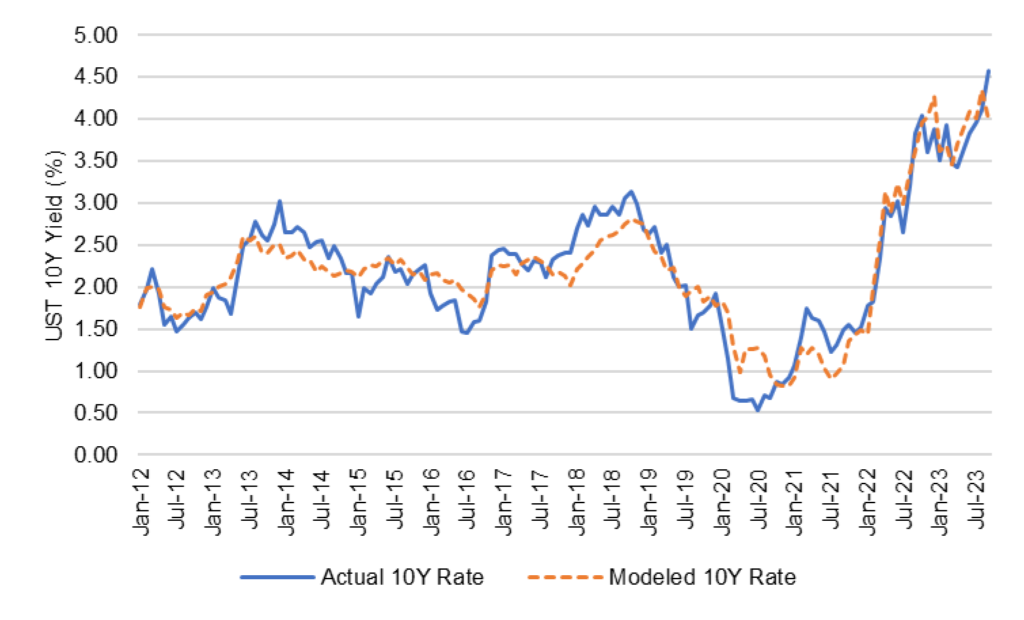
Note: data shows actual and modeled monthly constant maturity 10-year US Treasury rate. The model uses measures of inflation, growth, 10-year risk, Fed policy, trailing Treasury supply, Fed and foreign demand.
Source: Bloomberg, Philadelphia Fed Survey of Professional Forecasters, Treasury International Capital System, Santander US Capital Markets.
The statisticians in the crowd might object to using the level of these factors to model the level of the 10-year rate—correlated errors distorting the statistical tests—so a regression of changes in the 10-year rate on changes in the other variables serves as a check on the Warnock approach.
The estimated impact of each influence is largely as expected (Exhibit 2). Expected inflation and growth push rates up, for example, although changes in expected inflation shows no significant effect in this sample, as it did in Warnock. Rising risk pushes rates up. Tighter expected Fed policy pushes rates up. Fed demand pushes rates down, although the magnitude depends on the regression approach. Foreign demand also pushes rates down, although the estimated magnitude again varies by regression approach. Only trailing federal deficits have an effect that needs some untangling, with a positive coefficient in each regression. The Warnocks’ work found the same thing. That implies big deficits measured as negative GDP brings rates down. That squares with recent history. In 2020 and 2021, for example, when deficits ballooned to more than 15% of GDP and rates dropped toward zero. Deficits empirically say more about a weakening economy than they do about imminent supply. Overall, the numbers and a little judgement highlight a few factors as consistently important:
- Risk or term premium
- Fed policy
- Fed and foreign demand
Exhibit 2: Regression models of nominal 10-year rates

Note: ‘***’ 0.001 ‘**‘ 0.01 ’*‘ 0.05 ‘.’ 0.10 ‘ ‘ 1.00. Results from ordinary least squares. Changes modeled as first differences.
Source: Bloomberg, Philadelphia Fed Survey of Professional Forecasters, Treasury International Capital System, Santander US Capital Markets.
After accounting for all of these things by modeling the level of the 10-year rate, the gap between the actual and modeled 10-year rate at the end of September came in at 58 bp—with actual rates at 4.57% and modeled rates at 3.99% (Exhibit 3). The current gap is among the largest since 2012, although far from the only one. Complicated things sometimes do not give way to easy explanations.
Exhibit 3: But fundamentals still fall 58 bp short of explaining current 10Y rates

Note: data shows actual and modeled monthly constant maturity 10-year US Treasury rate. The model uses measures of inflation, growth, 10-year risk, Fed policy, trailing Treasury supply, Fed and foreign demand.
Source: Bloomberg, Philadelphia Fed Survey of Professional Forecasters, Treasury International Capital System, Santander US Capital Markets
One explanation for the latest gap could simply be noise in the measures of the fundamentals. Measuring expectations in real time is hard, with forecasts usually collected months apart and usually not from investors putting money to work. We also do not have a good measure of expected supply. Better measures might catch some of the twists and turns.
But another explanation is that we are missing something important. We could probably use a better forward-looking measure of expected Treasury supply. Maybe we need measures of concern about debt ceilings, government shutdowns, sovereign ratings.
Of the factors that do justify higher rates for now—rising expected rate volatility and term premium, a higher Fed path, falling Fed and foreign investment—only a tweak to the Fed path is in the Fed’s control. If the Fed on November 1 signals an ongoing tightening bias, it could keep longer rates up.
Without a clear Fed tightening bias, 10-year rates near 5% do not square up with the usual suspects as measured. In that case, after November 1, look for actual 10-year rates to drop toward fundamentals.
* * *
The view in rates
OIS forward rates still see almost no chance of a hike from the Fed on November 1 and an 18% chance of one in December. The same forwards then see rates roughly steady through April and then declining 70 bp through December 2024. On the expected timing of a final Fed hike has changed in the last few weeks. The risk to the market is that sticky inflation keeps the Fed at higher rates for longer than expected, which would eventually create credit problems for balance sheets funded at floating rates that already are burning cash.
Other key market levels:
- Fed RRP balances closed Friday at $1.09 trillion as the facility continues a sharp October decline, down $47 billion in the last week but down $466 billion this month. Money market funds continue to move cash out of the RRP and into higher-yielding Treasury bills.
- Setting on 3-month term SOFR traded Friday at 538 bp, down 2 bp in the last week
- Further out the curve, the 2-year note closed Friday at 5.00%, down 7 bp in the last week. Given the likely Fed path, fair value on the 2-year note is above 5.00%. The 10-year note closed at 4.83%, down 8 bp in the last week. At that yield, the 10-year note looks compelling relative to many risk assets.
- The Treasury yield curve closed Friday afternoon with 2s10s at -17, flatter by 1 bp in the last week. The 5s30s closed Friday at 25 bp, steeper by 3 bp in the last week.
- Breakeven 10-year inflation traded Friday at 242 bp, down 5 bp in the last week. The 10-year real rate finished the week at 241 bp, down 4 bp in the last week.
The view in spreads
The Bloomberg investment grade cash corporate bond index OAS closed Friday at 162 bp, tighter by 1 bp in the last week. Nominal par 30-year MBS spreads to the blend of 5- and 10-year Treasury yields traded Friday at 187 bp, tighter by 2 bp in the last week. Par 30-year MBS TOAS closed Friday at 84 bp, tighter by 2 bp in the last week. Both nominal and option-adjusted spreads on MBS have been particularly volatile since June and trending wider. And the recent start of mutual fund redemptions should make MBS spreads more sensitive to the direction of rates, widening as rates rise and eventually tightening as rates fall.
The view in credit
Most investment grade corporate and most consumer balance sheets look relatively well protected against higher interest rates, but a lot will depend on how long rates remain high. Fixed-rate funding largely blunts the impact of higher rates on both those corporate and consumer balance sheets, and healthy stocks of cash and liquid assets allow these balance sheets to absorb a moderate squeeze on income. But other parts of the market funded with floating debt continue to look vulnerable. Leveraged and middle market balance sheets are vulnerable. At this point, mainly ‘B’ and ‘B-‘ loans show clear signs of cash burn. Commercial office real estate looks weak along with its mortgage debt. Credit backing public securities is showing more stress than comparable credit on bank balance sheets. As for the consumer, subprime auto borrowers, among others, are starting to show some cracks with delinquencies rising quickly. The resumption of payments on government student loans should add to consumer credit pressure.