


The Big Idea
A midterm exam in corporate credit
Dan Bruzzo, CFA and Meredith Contente | July 14, 2023
This material is a Marketing Communication and does not constitute Independent Investment Research.
We made a series of out-of-consensus calls for the corporate bond market at the beginning of the year, and it’s time to tally midyear results. More importantly, it is time to determine whether our views have changed for the path ahead. A few themes really affected investor behavior in the first half. Among the more prominent were the significant inversion of the yield curve, lower-than-expected US corporate debt issuance and an unanticipated crisis in banking. While investment grade spreads are now tighter than where they began the year, it has been a turbulent ride for credit over the past six months.
***
A call on supply

Clearly, this prediction missed the mark (Exhibit 1). Among the critical factors that have kept new issue volume at bay so far has been the Big Six US money center banks’ decision to limit debt issuance in the first six months of the year. This has stood in stark contrast to behavior over the previous couple years, where the larger banks had mostly front-loaded their issuance needs in the first two quarters of the year, pre-funding maturities and building out their regulatory capital levels. To date, the Big Six have just issued under $37 billion compared with roughly $120 billion at this point over the past two years (Exhibit 2).
Exhibit 1. Cumulative supply for the USD IG new issue market

Source: Santander US Capital Markets, Bloomberg, LEAG tables
Exhibit 2: Big banks held back on issuance so far this year

Source: Bloomberg, LEAG tables
With approximately $85 billion in combined maturities through the end of the year, the Big Six could be more active in the second half than the market has grown accustomed. Next week, following their second-quarter earnings reports, they are likely to bring more than usual for this time of year, but probably not nearly enough to offset the absence of activity to date. On the other hand, the larger regional banks, could also be much more active than usual as their management teams begin to respond to the recently announced changes in regulatory capital requirements for regionals. Bloomberg estimates that the domestic banks with $100 billion assets or more could need to bring a combined $168 billion in holding company bonds in order to fund the shortfall in regulatory capital according to the new measures. Likewise, this could also inspire the smaller subgroup of regional banks with less than $100 billion in total assets to follow suit, even if they are not explicitly required by regulators to do so. We already began to see increased issuance from the larger regionals last quarter as concerns about the domestic banking crisis began to subside.
Another factor that has kept investment grade debt issuance at bay in the first half of the year has been the limited number of large-scale mergers that have been funded.
* * *
A call on the beneficiaries of inflation

While inflation has come down from the 6.45% at year-end 2022, it continues to remain above the Federal Reserve’s target of 2.0%. The downward move in inflation has largely come from energy prices, which are down 16.7% over the last 12 months (Exhibit 3). Food inflation currently stands at 5.7% and remains above historical average rates. For 2023, food prices are predicted to increase 6.0%, with food-at-home prices estimated to be up 5.9% and food-away-from-home predicted to increase 7.7%. One of the largest contributors to food inflation has been the cost of eggs. While retail egg prices have declined nearly 30% from their peak in January 2023, egg prices are still expected to increase 6.2% in 2023.
Exhibit 3. Consumer Price Index (12-month percentage change)

Source: U.S Bureau of Labor Statistics
For the first half of 2023, private label sales have increased 8.2%, outpacing national brand sales gains of 5.1%. This has led to a record private label dollar share of 18.8%. Furthermore, private label unit share growth was up a record 20.5% in the first half of 2023. The three largest categories for private label growth over the past year were beverages (up 19%), general food (up 16%) and refrigerated food (also up 16%). Currently, cereals and bakery products are leading food at home inflation, with an inflation growth rate of 8.8%. Cereal and bakery products is one category where there remains a significant amount of private label competition. Given the outpaced inflation of this particular category, private label will likely see continued growth.
Moving away from food, general merchandise private label sales were up 8%, followed by home care, which witnessed 7% growth. Beaty private label sales saw an increase of 5% while health products were up 3%. Once a shopper opts for a store brand over the national brand, the shopper tends to stick with the private label. That said, retailers are investing more heavily on private label product innovation in both food and non-food items. This should continue to benefit retailers such as Walmart Inc. (WMT) as they carry four of the top five private label brands from a penetration perspective.
* * *
A call on M&A

Strong balance sheets and moderate revenue growth were among the factors that we saw driving M&A activity this year in the face of higher and higher interest rates, and therefore higher funding costs. Much of that still remains true today. Corporate balance sheets remain generally well positioned and opportunities for organic revenue growth appear limited. Those factors typically serve as a catalyst for consolidation, or at least had done so during the previous near-decade of artificially low interest rates. Since the Fed began the ongoing hiking cycle, overall M&A activity has slowed considerably as the era of cheap funding came to a close (for now) (Exhibit 4).
Exhibit 4. Annual global M&A volume and deal count

Source: Bloomberg
As mentioned earlier, the domestic banking crisis that struck in the first half of this year, and resulted in the collapse of three formidable, mid-sized regional banks (SIVB, SBNY, FRC), has drawn into question the survivability of regional banks of similar size and stature. We anticipate the longer-term impact of the crisis could be increased consolidation among regional banks, but so far it has been a slowly developing trend that could be actual years in the making before we begin to see a real impact on the M&A landscape for investment grade credit. This is due in part to the fact that it is, for now, far more advantageous for potential buyers to wait for a troubled institution to go into receivership before pursuing it as an M&A candidate as the FDIC helped facilitate the purchase of all three banks that failed during the most recent crisis through various incentives, including inexpensive funding and potential loss coverage. So for now we see only limited potential for domestic banks to have any meaningful impact on the M&A landscape over the near term.
* * *
A call on technology

Technology excess returns for the first half of the year of 2.06% have outpaced the IG Index, which has returned 1.6% over the same time (Exhibit 5). In fact, technology is the third best performing sector with respect to excess returns. Cash rich balance sheets have enabled the sector to largely navigate refinancing needs and strategic investments with cash on hand.
Exhibit 5. Year-to-Date excess returns for the IG index by sector

Source: Santander US Capital Markets, Bloomberg/Barclays IG Index performance
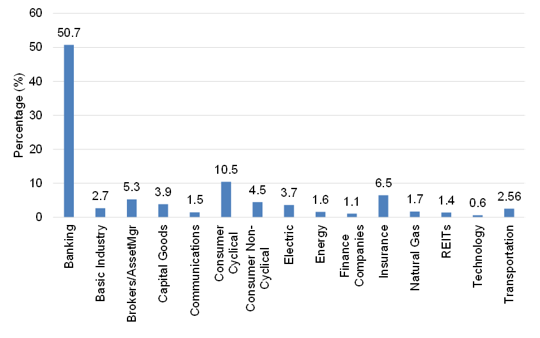
Year to date, technology issuance has been low, accounting for 6.5% of total issuance (Exhibit 6). In fact, for the month of June, technology accounted for only 0.6% of issuance in the IG universe, the smallest of any sector for the month. Minimal new supply from technology companies has enabled spreads to grind tighter, as new issuance is largely coming with concessions and repricing secondaries. Furthermore, the lack of technology issuance is creating scarcity value.
Exhibit 6. June IG issuance by sector
Source: Bloomberg LP, LEAG Tables, new debt and maturity SRCH, excludes sovereign/supra and govt-backed entities
While we do expect Broadcom Inc. (AVGO) to come with a jumbo deal in 2H23 to fund its acquisition of VMWare (VMW), we don’t foresee any further jumbo deals for the rest of the year. AVGO will likely issue between $30-$40 billion to fund the acquisition, which will put pressure on its secondaries as we anticipate the deal to come with sizeable concessions. However, the company’s strong cash flow generation will enable rapid deleveraging and keep ratings securely in the IG category. The new-issue concessions, depending on the size to get the deal done, will likely provide for some solid excess returns in the credit.
* * *
A call on telecom

Communications has delivered 2.34% in excess returns so far, making it the second-best performing sector year-to-date. Telecom companies remain focused on hitting their leverage targets with T-Mobile US Inc. (TMUS) being the closest to its target. TMUS ended the most recent quarter with net leverage of 2.7x, just two ticks shy of its target. TMUS should hit its leverage target by year-end. Verizon Communications Inc. (VZ) also ended 1Q with net leverage of 2.7x, however they are much further from their target of 1.75x-2.0x. VZ’s excess cash generation year-to-date has been minimal and net leverage has actually increased from year-end. We don’t see VZ hitting its target over the next two years, as they appear to now view it as a longer-term priority.
AT&T Corp. (T) also witnessed its net leverage increase, but explicitly stated on its earnings call that net debt would decline on a year-over year basis in this year and each year thereafter. In order to hit its 2.5x net leverage target, T needs to repay roughly $22.5 billion of debt by early 2025 (Exhibit 7). Given that T has only $17.5 billion of debt maturing through 2025, the company will likely need to conduct a tender offer to meet its leverage target. The size of that tender offer will likely be between $5 billion to $7.5 billion, depending on how T plans to address the 2025 debt that matures in the back half of that year. Furthermore, any shortfall in EBITDA generation will make it necessary for additional debt reduction if T plans to hit its leverage target. The two maturity walls in 2026 and 2027 serve as good tender candidates as it not only helps to address those maturity walls, but the majority of the debt in those years trade below par.
Exhibit 7. T Debt maturity schedule

Source: Bloomberg; Santander US Capital Markets
* * *
A call on insurance

Through July 11, the Insurance sector delivered a 1.27% excess return (total return net of treasury performance) versus the 1.60% excess return for the investment grade index, landing the sector in the bottom five performers for the first half of the year (Exhibit 8). The higher duration of the Insurance sector (option-adjusted duration of 8.49 versus 7.08 for the investment grade index) did not appear to have a significant impact on overall performance, as other high-duration sectors, such as Communications (8.57), performed well throughout the first half of the year. The current OAS for the insurance sector is +133 versus +122 for the IG index, which is in-line with other higher duration segments of the market (communications, nat gas, utilities), which we believe suggests a market performance for the near future.
Exhibit 8. Year-to-date excess returns for the IG index by sector

Source: Santander US Capital Markets, Bloomberg/Barclays IG Index performance
Industry fundamentals and operating outlook remain stable for both the life and P&C operating segments. Heightened catastrophe losses over recent years project a positive pricing environment for the P&C industry for the remainder of the 2023. While the inverted yield curve remains a challenge, gradually rising interest rates and higher overall yields should serve to benefit net investment income over time for the life insurance segment as well. Some of the more favorable relative value selections for the sector include CNA Financial (CNA: Baa2/A-/A-) in the P&C segment, and Unum Group (UNM: Baa3/BBB/BBB-) and Corebridge (CRBG: Baa2/BBB+/A-) in the unsecured life insurance segment.