


The Long and Short
Out-of-consensus calls on the 2023 corporate market
Meredith Contente and Dan Bruzzo, CFA | November 18, 2022
This material is a Marketing Communication and does not constitute Independent Investment Research.
Consensus calls for a dip in investment grade corporate issuance next year, but a wave of maturities should lift issuance above expectations. Persistent inflation should help private label packaged and consumer goods. Cash-rich balance sheets should outperform next year, likely making technology a strong performer. A continued focus on debt reduction should help to tighten spreads for telecom. And higher rates and potential price increases should make insurance one of the top performers next year, too.
All of this plays out in six out-of-consensus calls for the 2023 investment grade corporate market:
- Gross supply will increase materially year-over-year despite challenges and higher rates
- Inflation remains stubbornly high – private label the beneficiary
- Global M&A will make a strong recovery despite the obvious challenge of funding costs
- Cash is king – cash-rich technology balance sheets should support outperformance
- Back-to-basics approach in telecom should fuel spread improvement
- After a weak finish in 2022 we expect the Insurance sector to be among the top performers in 2023
Gross supply will increase materially year-over-year in 2023 despite challenges and higher rates
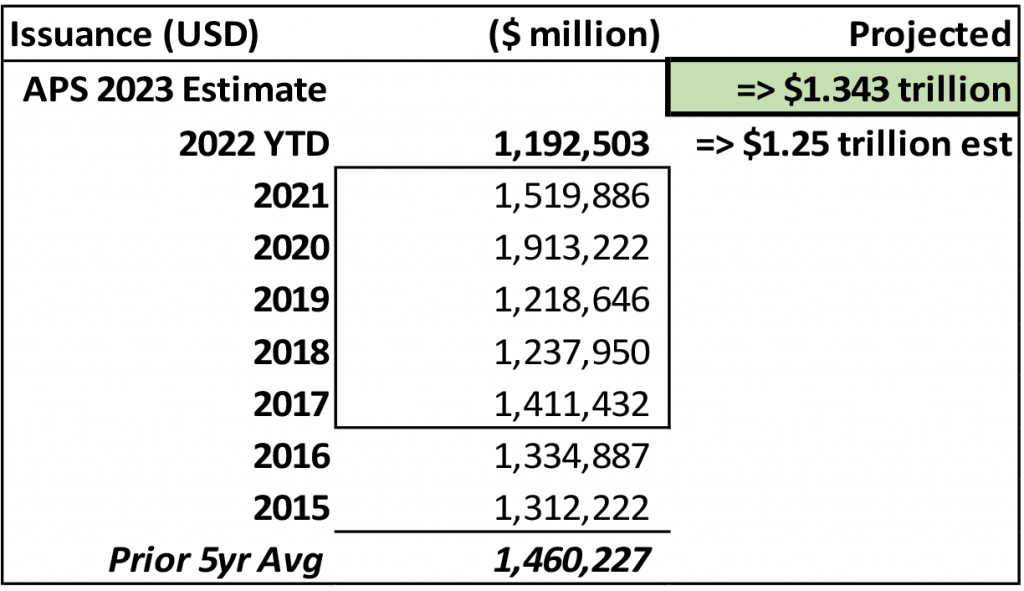
When developing a top-down outlook for the investment grade corporate bond market, it is critical to communicate your expectations for the new issue market and estimate supply for the coming year. While it is early to say exactly what the market views as the “consensus” outlook for gross supply, given early market indicators and the lingering challenges likely to carry over into the forthcoming year, we believe market watchers are anticipating a down-to-flat year for corporate debt issuance in 2023. Our expectation, however, is that the investment grade primary market will see a significant uptick in total gross volume from the current year and are projecting a 7.5% increase in gross debt issuance for next year over the expected volume for the close of 2022. This would suggest the annual volume for the investment grade primary calendar would be in the neighborhood of $1.34 trillion, which would be down from the prior 5-year average of $1.46 trillion but would exceed the totals generated in the pre-pandemic years of 2018 and 2019.
Exhibit 1: Annual investment grade corporate bond supply
Source: Amherst Pierpont, Bloomberg LP
We expect issuance estimates for 2023 to skew lower due primarily to vastly higher interest rates and a still-tightening Fed as we enter the new year. Additional factors include the extremely depressed M&A market over the past several quarters, which has reduced deal-related issuance needs over the near-term. Furthermore, inflation concerns and their impact on the already sluggish economy could keep issuers under pressure, coping with day-to-day and week-to-week swings in market sentiment that have made it particularly challenging over the past several months. An additional impediment for aggregate issuance totals for the coming year could also be the reduced new issue volume for US money center banks. The bigger banks are entering the new year with mostly excess regulatory capital levels, which can potentially enable management teams to be more selective about issuing debt in 2023. We saw this to some extent after third quarter earnings. However, large regionals appear poised to make up some of that difference with potentially sizable regulatory capital funding needs next year.
Exhibit 2: Year-to-date investment grade corporate bond issuance – 2022 closing in on 2018 and 2019 aggregate totals
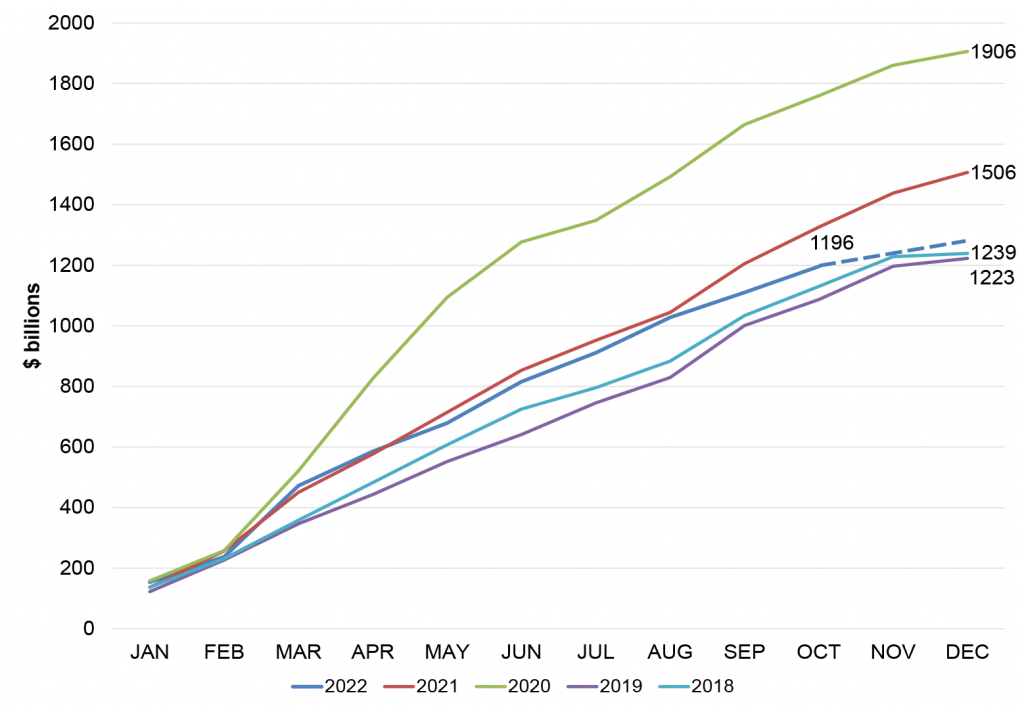
Source: Amherst Pierpont, Bloomberg LP
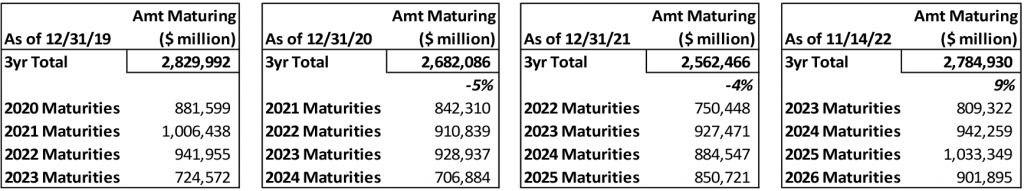
Despite these challenges, we expect a significant uptick in gross volume for the coming year. The primary contributing factor to our estimate for 2023 issuance is the maturity schedule confronting the corporate bond market over the next several years. On Exhibit 3 below we show the upcoming corporate bond maturities for the IG market, calculating the 3-year total as a proxy for issuance needs in the proceeding year. As of the current year-end, expected maturities for the next three years will jump 9% from the same point last year to an approximate level of $2.78 trillion up from $2.56 trillion. The extraordinary mid-pandemic issuance level in 2020, aided by the backstopping of the federal government, enabled corporate bond issuers to pre-fund maturity needs further out the calendar, leading to decreased total maturity schedules in both 2021 and 2022. The 3-year maturity aggregates in both of those years were down 5% and 4%, respectively. It appears that we are now moving beyond the early redemptions that were pre-funded during that period of extraordinary corporate bond issuance, and after a down year in 2022, management teams will once again need to look to the near-term horizon. Only issuers with extraordinary cash balances will have the luxury of postponing or indefinitely delaying bond issuance necessary to meet upcoming maturities in the hopes of seeing rates come down in subsequent years.
Exhibit 3. Near-term maturity schedules over the past four years.
Source: Amherst Pierpont, Bloomberg LP
Generally speaking, however, cash balances have moved back to more normalized levels after being elevated throughout the previous two years. Exhibit 4 below demonstrates corporate balance sheets’ aggregate cash positions, using the S&P 500 as a proxy. Cash and equivalents as a percentage of total assets (currently around 12%) and as a percentage of total debt (currently around 49%) have moved back to a more historical range after skyrocketing during the early phases of the pandemic. Corporate issuers initially drew down revolving credit lines and then issued debt opportunistically as the Fed back-stopped corporate credit markets. This led to elevated cash levels over the previous two years, and likely gave many issuers the flexibility to sit back more idly with upcoming debt maturities already pre-funded in 2022 as rates rose rapidly throughout the year.
One area of the corporate bond market that we believe still remains cash rich as we enter 2023 is among the big investment grade technology issuers—more on that later. We also think M&A totals are likely to increase meaningfully off the depressed levels generated in 2022. This should also put upward pressure on issuance totals as the year progresses.
Exhibit 4. Corporate cash balances compared to total debt and total assets
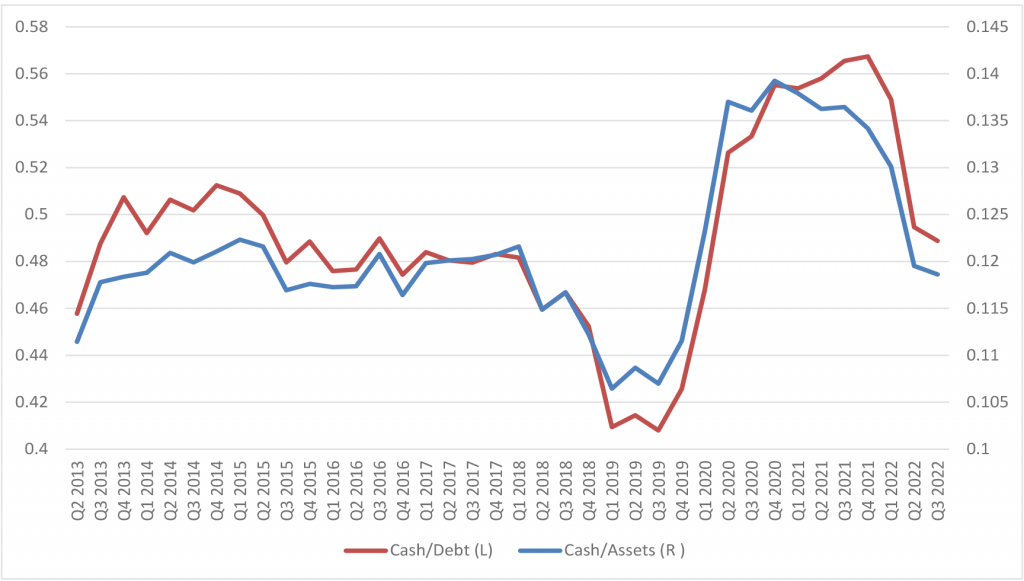
Source: Amherst Pierpont, Bloomberg LP, Standard & Poor’s S&P 500 index
Inflation remains stubbornly high – private label the beneficiary
This year taught us that this inflationary period was anything but “transitory”. We believe that inflation will continue to be sticky in 2023, despite the most recent CPI number which came in lower than expected. The majority of investment grade packaged food and consumer product companies are continuing to witness double-digit raw material inflation, despite initially guiding to lower costs in the back half of 2022. Multiple rounds of price increases have helped these credits to pass on a large portion of increased raw material costs to consumers. However, we believe the consumer is almost fully stretched. While we began to see some cracks in the health of the consumer in the third quarter as volumes started to contract, we think any further price increases will be met with more significant volume declines. That said, companies may now be forced to absorb more of the increased costs, thereby triggering greater margin contraction.
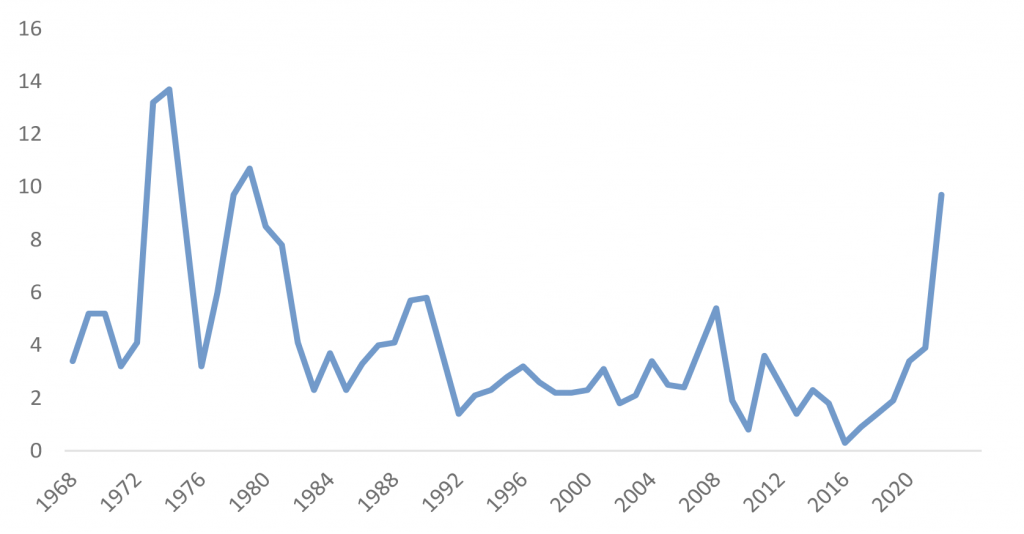
On a last-twelve-month or LTM basis, food inflation currently stands at 11.2%. This is on top of 6.3% in 2021 and 3.9% in 2020. The current pace of food inflation is the highest since 1979 (Exhibit 5). Coupled with a near 20% increase in energy costs, the consumer will be forced to look for further ways to make the dollar stretch. That said, private label is likely to be the beneficiary of stubbornly high inflation as switching from a national brand to a private label can save on average over 20%. While private label across the packaged food space has witnessed significant growth this year, any further attempt at price increases by national food brands will likely fuel even more private label growth. Private label currently accounts for 17.4% of grocery sales, leaving considerable room for further market share growth.
Exhibit 5. Food Inflation 1968-2022 YTD
Source: U.S. Bureau Labor of Statistics; APS
Credits that stand to benefit from private label growth include Walmart Inc. (WMT – Aa2/AA/AA), Costco Wholesale Corp. (COST – Aa3/A+), Target Corp. (TGT – A2 (P)/A/A), Kroger (KR – Baa1 (n)/BBB (n)), Dollar Tree Inc. (DLTR – Baa2/BBB) and Dollar General Corp (DG – Baa2/BBB). We note that WMT dominates in private label, as four of the top five private label brands from a penetration perspective, are carried by the mass merchant. WMT’s Great Value brand is the clear leader with a U.S. household penetration rate of nearly 73%. Dollar Tree’s namesake private label brand also ranks in the top five, with a private label penetration rate of nearly 33%. Additionally, TGT’s Favorite Day brand is one of the fastest growing private label brands, which is up 2.2% on a LTM basis. Private label is also important from a margin perspective as private label brands tend to carry 500-600 bp more margin than national brands. That said, any increase in private label penetration should help minimize margin contraction at the aforementioned credits.
From a consumer perspective, growth in private label is actually coming from middle and high-income consumers. According to Numerator, prices have now become more important than brand loyalty for these two income brackets. That said, roughly 39.5% of high-income shoppers and 38.8% of middle-income shoppers are purchasing private label brands in an effort to save. High-income shoppers also rate the quality of private label brands higher than the other income brackets, which could mean that once they make the switch to a private brand, they may not return to its national counterpart (Exhibit 6).
Exhibit 6. Private Label Quality Perception* (May 2020 – Aug 2022)
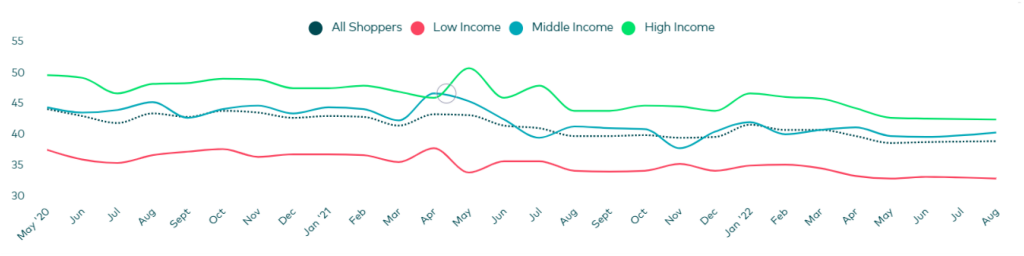
*Income Groups: High (>$80k annually), Middle ($40 – 80k), Low (<$40k)
Source: Numerator; APS
After a severe downturn in 2022, global M&A will make a strong recovery in 2023 despite the obvious challenge of funding costs
Global M&A volume fell from $6.65 trillion in the prior year to $4.05 trillion in 2022 year-to-date – the lowest level since 2013. Activity dropped off sharply from a record year in 2021 as rates rose at an historic pace and prospective funding costs skyrocketed. We believe the consensus market view will be that deal activity will remain low in 2023 as rates continue to rise and the Fed, at least initially, remains in tightening mode with more rate hikes on the immediate horizon. Despite these challenges, we believe M&A volume is poised to recover in the coming year as several key factors support deal-making activity. Specifically, corporate balance sheets in key industries remain strong, equity valuations remain at multi-year lows, and organic revenue growth is currently constrained. Those characteristics often lead to corporate management teams seeking growth opportunities externally. Even as the debt funding component is more comparatively expensive than the market has grown accustomed to over the previous couple of years, the market is still seeing plenty of IG corporate debt issuance this fall, including several multi-tranche, jumbo launches that are typical for M&A funding. Furthermore, as we move deeper into 2023, larger-scale deals with longer time horizons could be announced well ahead of debt funding needs, with the prospect for rate cuts as early as late-2023 or early-2024.
Exhibit 7. Annual Global M&A Activity – Volume ($ Tr) and Deal Count
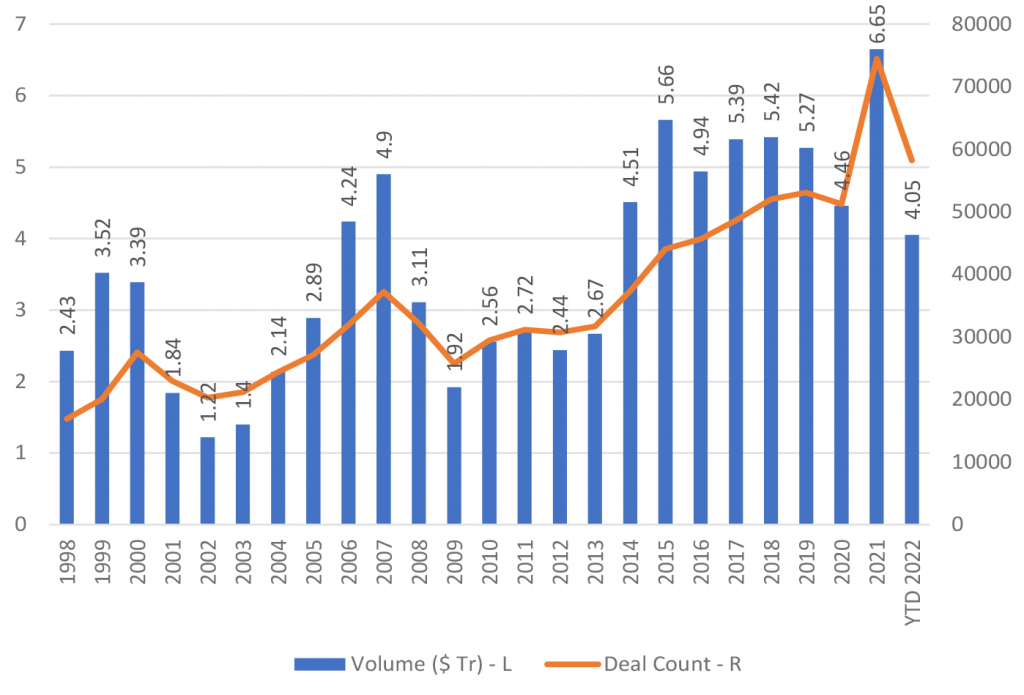
Source: Amherst Pierpont, Bloomberg LP
Corporate management teams generally improved leverage and liquidity throughout the pandemic and post-pandemic periods over the past few years, with ample opportunities to reduce and term-out debt maturities in the public debt markets. As a result, industrial/consumer corporate balance sheets are entering 2023 from a position of strength with net leverage of the S&P 500 at or near historic lows.
Exhibit 8. S&P 500 – aggregate net debt-to-EBITDA(x) trending near historic lows, providing plenty of financial flexibility for deal-making
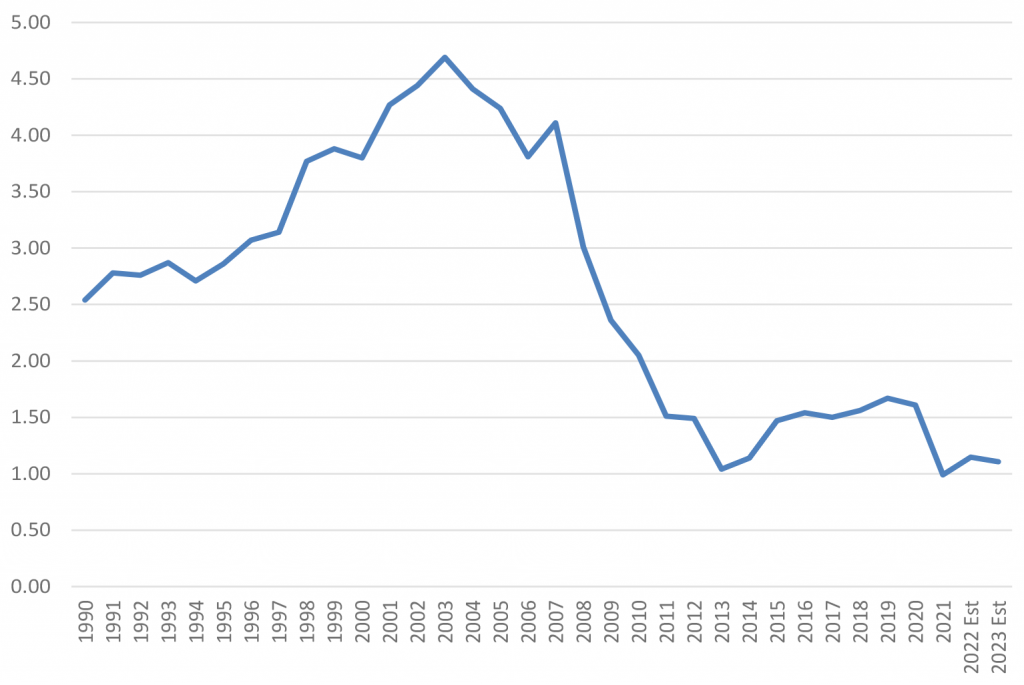
Source: Amherst Pierpont, Bloomberg LP, Standard & Poor’s S&P 500 Index
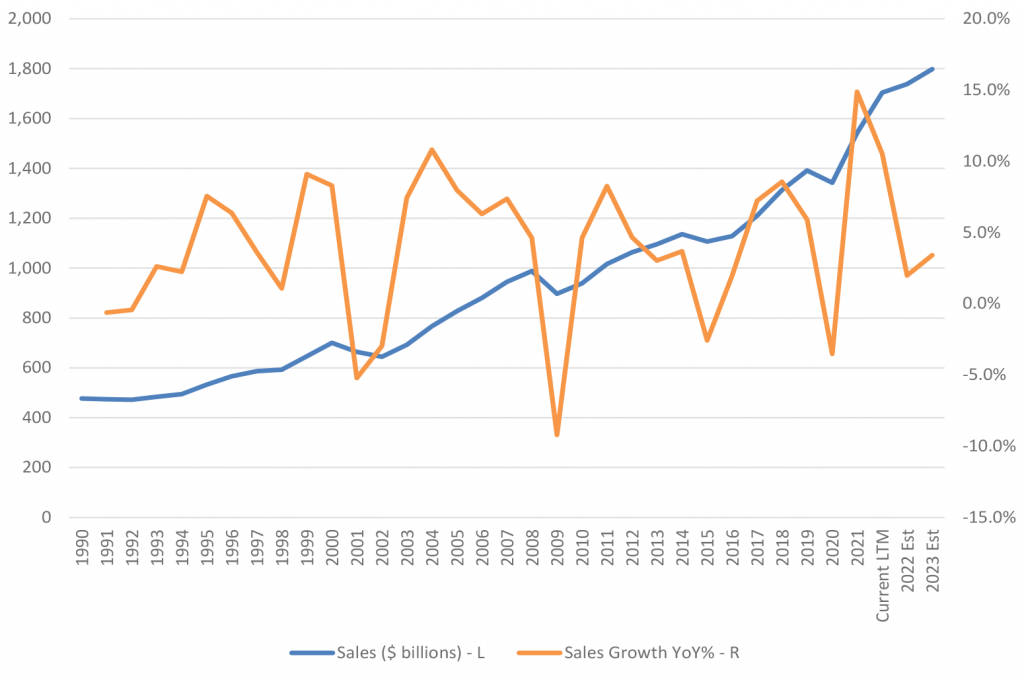
Meanwhile, sales growth has been moderating over the past year in aggregate and is projected to remain low through year-end and into the next coming years. Periods of lower growth often immediately precede bouts of consolidation as corporate management teams seek outside opportunities to bolster revenue and reduce expenses. Opportunities to do so have been facilitated by the bear market in equity securities that has vastly reduced valuations and improved deal making multiples over the past twelve months.
Exhibit 9. S&P 500 – Sales growth moderating and projected to remain lower into 2023 and 2024
Source: Amherst Pierpont, Bloomberg LP, Standard & Poor’s S&P 500 Index
Cash is king – cash-rich technology balance sheets should support outperformance
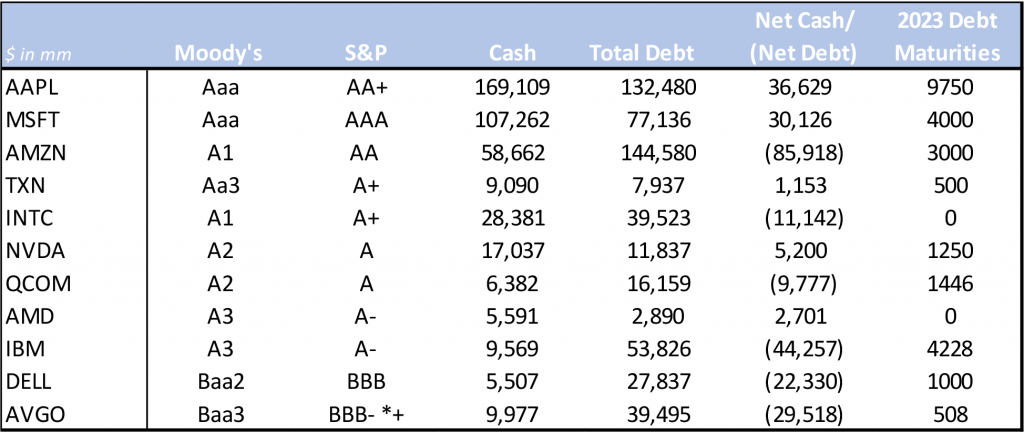
With interest rates high and the expectation that they will continue to go higher, we believe credits that have strong cash balances are likely to outperform as they have flexibility in navigating the interest rate environment. The strong cash balances allow for debt repayment, versus refinancing at disadvantageous rates. It also helps to support reinvestment in the business to fuel innovation and future growth. There are a handful of IG technology credits that remain in a sizeable net cash position, while other credits maintain cash balances that are multiples higher than their 2023 debt maturities (Exhibit 10). Furthermore, being in a position to repay debt versus refinancing helps secondary spread performance given the increase in new issue concessions over the past year. New issue concessions were virtually nil in 2021 and now stand at roughly 15-20bps on average. Should we enter a recession, new issue concessions are likely to increase even further.
Exhibit 10: Investment grade technology balance sheet highlights
Source: Company Reports; Bloomberg; APS
Additionally, these highly liquid balance sheets can be considered a defensive play, particularly if we move into a recession. In the financial crisis of 2008- 2009, non-financial IG credits that performed the worst were the ones that were plagued by negative liquidity headlines. Names that had minimal cash balances and any potential to witness meaningful contraction in EBITDA and free cash flow, underperformed significantly. The new issue market essentially shut to these credits, as it became so unfavorable from a coupon perspective, which helped to exacerbate liquidity risk.
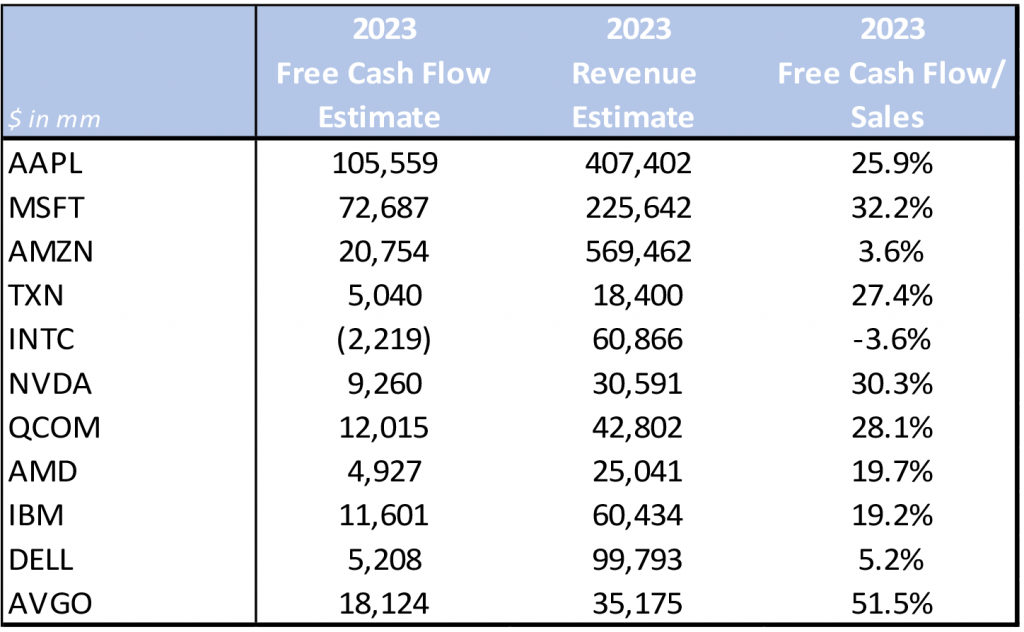
Free cash flow matters, too
Strong free cash flow profiles clearly contribute to a credit’s balance sheet and technology benefits from having some of the strongest free cash flow margins. Of the 11 credits highlighted in Exhibit 11, the average free cash flow/sales margin is 21.8%. AVGO maintains the highest margin at over 50%, while NVDA is the only credit estimated to burn cash next year. Strong free cash flow also helps to fund shareholder remuneration without additional leverage. While we recognize that there is implied duration risk associated with these cash flows in an inflationary environment, hence the sharp decline in technology equity valuations, we do believe that technology innovation is necessary to increase growth for the end-user, particularly surrounding efficiency. Given supply chain bottlenecks spurred by the pandemic, and remote work becoming increasingly more mainstream, businesses will continue to invest in new technologies and software that maximize productivity and increase cyber security. MSFT recently noted that technology spend (as a percentage of GDP) is expected to double by the end of the decade. That said, technology free cash flow is likely to remain strong.
Exhibit 11. IG Technology 2023 Free Cash Flow Profiles (Estimated)
Source: Company Reports; Bloomberg; APS
Back-to-basics approach in telecom should fuel spread improvement
With AT&T Corp. (T) doing an about face on its content marriage with Time Warner, all of the major U.S. telecom companies have turned their focus to making further improvements to their mobility networks while reducing debt in order to hit their leverage targets. We note that AT&T and Verizon Communications (VZ) are currently the two largest non-financial members of the Bloomberg U.S. Corporate Bond Index after AAPL, with weightings of 1.18% and 1.19%, respectively. But that may change as both credits continue to focus on debt reduction. In fact, earlier this year, T’s weighting in the index was closer to 1.56%, but has since declined as T reduced net debt by over $38bn since 3/31/22.
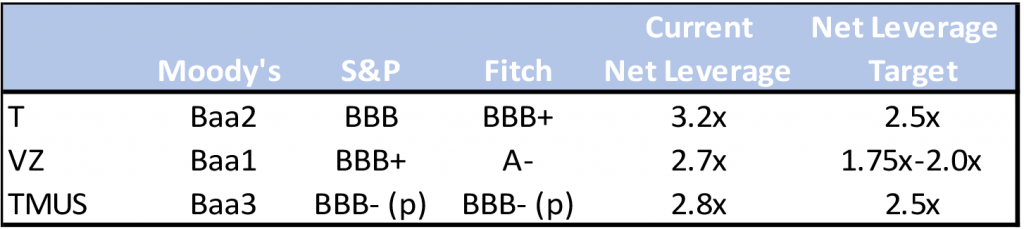
We note that VZ currently maintains the lowest net leverage at 2.7x, with T-Mobile US (TMUS) right on their heels at 2.8x. T’s net leverage still remains above 3.0x and we think the company is likely to hit their leverage target sometime in 2024 (Exhibit 12). T management has explicitly stated that despite some maturity walls in 2023 and 2024 ($5.7bn and $7.2bn, respectively), free cash flow after dividends should be enough to cover the repayment of that debt. We note that T is estimated to generate $17.3bn of free cash flow in 2023. After paying dividends of approximately $8bn, T is set to have excess free cash flow of $9.3bn, which easily covers next year’s maturities. If T were to apply all the excess free cash flow to debt reduction, we estimate that net leverage could decline to the 2.85x area.
Exhibit 12: Investment grade telecom net leverage comparison
Source: Company Reports; Bloomberg; APS
TMUS is likely to hit its net leverage target prior to the start of 2023 given its better-than-expected results this year, coupled with its faster than expected integration process. During 3Q22, TMUS had decommissioned substantially all targeted legacy Sprint macro sites. We note that this is one year ahead of its original merger plan. According to management, the accelerated site decommissioning helped to unlock more network savings than originally planned. As such, TMUS revised its merger synergy guidance to the $5.7bn-$5.8bn area, up from $5.4bn-$5.6bn.
What About a Recession?
Telecom has long been viewed as recession resistant given their subscription-based revenue models. However, we do note that any real risk to the top line and cash flows in a recessionary environment would come from the business wireline segment. Should we enter a deep and protracted recession, there is a likelihood that business customers could look to cut IT spend further. However, any contraction in revenues or profitability should not meaningfully impact credit quality given the debt reduction focus.
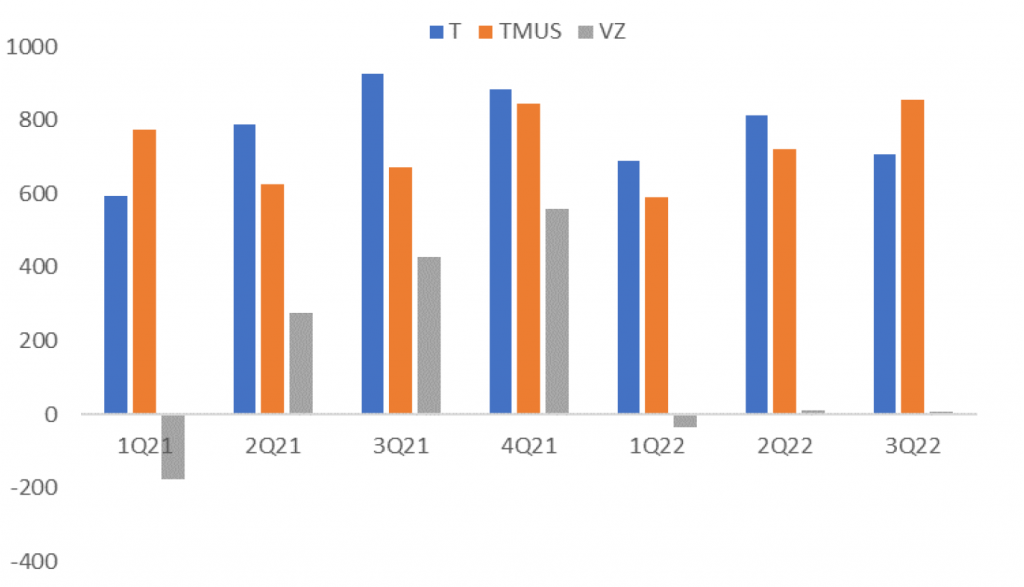
We note that TMUS is in the process of selling its wireless business, which is expected to close by year end 2023. T and VZ generate just over 20% in revenues from the business wireline segment, which has been steadily declining on an annual basis. EBITDA margins associated with the business wireline segment are nearly half when compared to the consumer business. That said, any further contraction in the business segment is likely to be offset by postpaid gains in the consumer segment. However, VZ has been struggling to post solid net add numbers this year given the increased competition from its peers (Exhibit 13). We see VZ likely to be impacted the most by any business decline until it can improve growth in consumer wireless net adds.
Exhibit 13: Investment grade telecom net phone additions (1Q21-3Q21)
Source: Company Reports; APS
After a weak finish in 2022 we expect the insurance sector to be among the top performers in 2023
We believe in 2023 insurance will see a substantial recovery and eventually be among the top performing sectors within the index on a credit basis. There are numerous factors that we see contributing to an operating recovery in 2023. The higher rate environment is highly beneficial to the potential investment income among both life insurance and property & casualty (P&C) operators. We also see significant potential for price increases to bolster underwriting performance and help offset inflationary pressures in the industry, in particular in the P&C segment. Also in the life segment, decreases in Covid morbidity rates should continue to help improve operating results. On a fundamental basis, investment grade insurance credits remain extremely well capitalized, despite any recent declines in statutory capital. In addition, these credits have benefitted from improved liquidity profiles over the past few years with the accommodative debt markets enabling issuers to term out their debt profiles.
Year-to-date 2022, the insurance sector has recorded a total return of -19.82% versus -16.86% return for the investment grade corporate bond index (Bloomberg Barclays). Excess return for the segment is -2.63% versus -2.01% for the broad index, which lands insurance among the bottom five performing sectors for the year. While softer total return performance YTD is more likely due to the longer duration of the sector relative to the rest of the index, the weaker credit performance is more reflective of the headwinds in the industry and investors’ perceptions of a weaker underwriting environment.
More recently, the insurance segment has been hard hit with several prominent credit downgrades reflecting some of the operating difficulties that have been confronting the industry. Specifically, life insurance company Lincoln National (LNC: Baa1/BBB+/BBB+) was downgraded one notch by S&P and AM Best, and had its outlook revised to negative from stable by both S&P and Fitch earlier this month. The rating actions followed a somewhat disastrous third quarter earnings report, which included a $2.2 billion charge for negative reserve development. Separately, P&C insurance bellwether Allstate (ALL: A3/A-/A-) had its outlook revised to negative from stable by both S&P and Fitch to reflect softer underwriting results as well as adverse reserve development. Both situations underscore the operating weakness that has been evident in both of the respective segments of the industry.
Exhibit 14. Investment Grade Life Insurance Segment
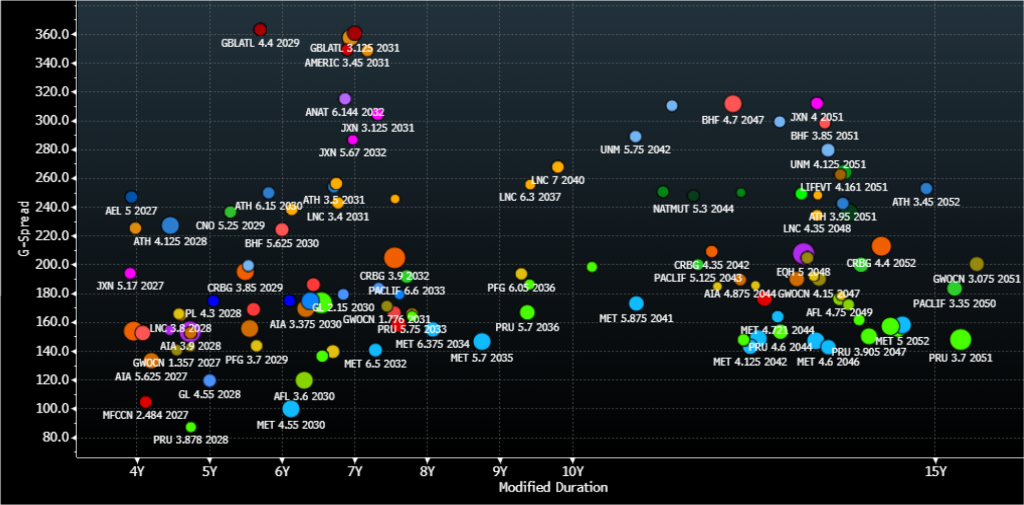
Source: Amherst Pierpont, Bloomberg /TRACE indications
Life Insurance relative value picks: Corebridge Financial (CRBG: Baa2/BBB+/BBB+), Unum Group: (UNM: Baa3/BBB/BBB-), National Life Insurance Group (LIFEVT: Baa1/BBB+)
Exhibit 15: Investment grade P&C segment
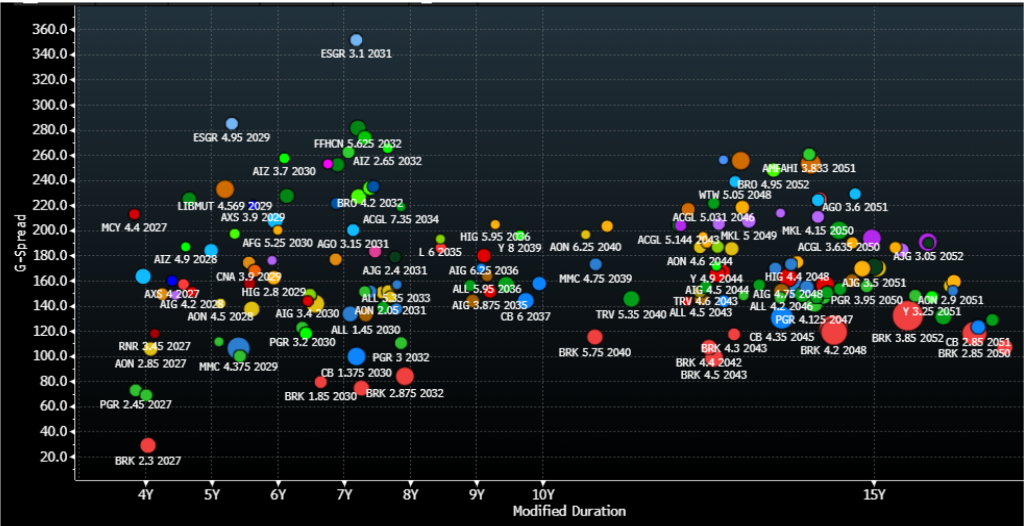
Source: Amherst Pierpont, Bloomberg /TRACE indications
P&C Insurance relative value picks: Alleghany (Y: A1/AA), AON Corp (AON: Baa2/A-), CNA Financial (CNA: Baa2/A-/BBB+)