


The Big Idea
Fair value ahead of bank portfolio liquidations
Steven Abrahams | April 14, 2023
This material is a Marketing Communication and does not constitute Independent Investment Research.
Original version published on 4/13/23. Updated with distribution of pass-through CUSIPs by coupon.
Since the April 5 announcement that the FDIC had hired BlackRock to liquidate $114 billion in securities formerly held by Silicon Valley Bank (SVB) and Signature Bank (SBNY), markets have started circling around potential fair value. Agency MBS, the most liquid and transparent of the markets due to see portfolio flows, should end up serving as the value benchmark. And other less liquid and transparent areas expecting sizable flows—particularly agency CMOs and agency CMBS—will likely price wide of pass-throughs after adjusting for differences in risk. The pass-through market already has widened ahead of the liquidation. And the recently available details of the pass-throughs coming out of SVB point to spread levels already attractive relative to Treasury debt and close to levels needed to deliver fair return on equity for leveraged portfolios.
Benchmarking fair value in agency pass-throughs
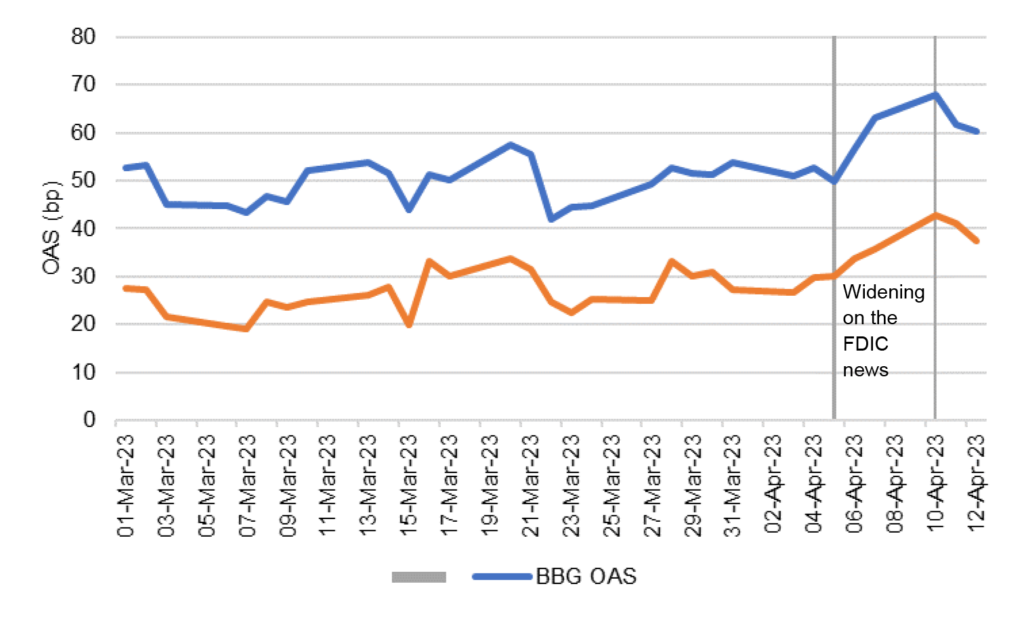
On the April 5 announcement day, par 30-year UMBS traded at a Bloomberg OAS of 50 bp but closed five days later at 68 bp (Exhibit 1). Yield Book OAS went from 30 bp to 43 bp. The widening almost certainly reflected first estimates of levels needed to clear the $66 billion in pass-throughs likely to come out of the bank portfolios. To put that size in context, average net new monthly MBS supply since September has run at $14.4 billion, and monthly Fed MBS portfolio runoff has averaged $17.3 billion. The bank supply represents more than two months of combined net new MBS supply and Fed runoff.
Exhibit 1: Par 30-year UMBS widened after the Apr 5 FDIC announcement
Source: Bloomberg, Santander US Capital Markets
It turns out that FDIC disclosure of security CUSIPs transferred from Silicon Valley Bank to its bridge bank offers a clearer picture of likely pass-through flows and relative value. The FDIC does not disclose principal balance for each CUSIP, but the count of CUSIPs lines up roughly with SVB disclosures of MBS principal balances and their maturities at the end of 2022. Weighing each CUSIP equally seems reasonable for a first cut at aggregate value. Some of the highlights of the FDIC disclosures and of initial analysis of the pass-through CUSIPs (Exhibit 2):
- 372 separate SVB HTM pass-through CUSIPs
- 109 UMBS 15-year CUSIPs (29.3% by count)
- 56 UMBS 20-year CUSIPs (15.1% by count)
- 180 UMBS 30-year CUSIPs (48.4% by count)
- 27 G2SF 30-year CUSIPs (7.3% by count)
- Allocation across pass-through sectors corresponds roughly to 4Q2022 SVB filings showing aggregate UPB maturity across both HTM and AFS
- 26% of UPB with maturity of less than 15 years
- 74% with maturity of more than 15 years
- The majority of pass-through CUSIPs in 2.0% and 2.5% coupons

Note: Frequency based on count of CUSIPs. Source: FDIC, Santander US Capital Markets
- The pass-throughs price at significant discounts to par
- 15-year UMBS at an average 4/10/23 BVAL price of $91.27
- 20-year UMBS at an average $86.19
- 30-year UMBS at an average $87.47
- 30-year G2SF at an average $88.37
- They show intermediate duration
- 15-year UMBS at a Yield Book OAD of 4.19
- 20-year UMBS at 5.66
- 30-year UMBS at 6.20
- 30-year G2SF at 6.26
- Low negative to slight positive convexity, depending on model
- 15-year UMBS a Yield Book OAC of -0.11, Santander OAC of 0.23
- 20-year UMBS a YB -0.32, Santander 0.50
- 30-year UMBS a YB -0.63, Santander 0.44
- 30-year G2SF a YB -0.51, Santander 0.44
- Historically wide OAS
- 15-year UMBS a Yield Book OAS of 53 bp, Santander of 50 bp
- 20-year UMBS a YB of 85 bp, Santander of 91 bp
- 30-year UMBS a YB of 68 bp, Santander of 84 bp
- 30-year G2SF a YB of 60 bp, Santander of 68 bp
Exhibit 2: Aggregate features, pricing, risk and return on SVB pass-throughs

Note: all calculations assume equal UPB across all CUSIPs in the maturity sector.
Source: FDIC, Yield Book, Santander US Capital Markets
Earlier Santander US Capital Markets (SanCap) work on par 30-year MBS spreads as the Fed and banks reduced MBS exposure had estimated fair value at a Bloomberg OAS of 66 bp. Since comparable Yield Book OAS over the last five years has run at 64% of the Bloomberg level, fair value on Yield Book OAS would be around 42 bp.
The broad estimated OAS on the SVB CUSIPs lands at or well above fair value using either a Yield Book or Santander model. Of course, the SVB pass-throughs—with 90% of its 30-year CUSIPs showing coupons of 2.0%s, 2.5%s and 3.0%s—arguably have less liquidity than the par coupon and should trade at wider spreads. These look like attractive levels for money managers to swap out of Treasury debt and into MBS.
Leveraged MBS portfolios should also find initial estimates of OAS on SVB pass-through CUSIPs interesting. For example, the Yield Book model puts the estimated average OAS of the 20-year pass-through portfolio at 85 bp, and the Santander model puts is at 91 bp. Assuming leverage of 8x, consistent with agency mortgage REITs, a position fully hedged against rates and volatility would show a projected return on equity of 11.78% using the Yield Book model or 12.26% using SanCap. For context, REITs heavily weighted towards agency MBS currently offer indicated gross yields to equity of between 13.5% and 14.4%. To hit the lower end of that range, either OAS would have to widen to 106 bp or the leveraged portfolio would have to leave some risk unhedged to capture more nominal income.
Benchmarking fair value in other portfolios
The liquidation involves more than just pass-throughs, of course, but other markets either have seen limited flow since the FDIC announcement or the assets coming out are so different from current issuance that they almost form separate markets (Exhibit 3). For example:
- The combined portfolios include $24 billion in agency CMOs—more than twice the average $10.7 billion of monthly CMO production so far this year—but that market has seen limited flows since April 5 and the securities coming out of portfolio have coupons well below those currently getting produced. The CMOs look unlikely to draw core bank buyers and will almost certainly have to trade at good value relative to pass-throughs to draw in money managers and leveraged investors. One compelling way to maximize the value of the CMOs might be to combine SVB’s stripped-down classes with the corresponding IO class to create a fixed-rate bond that would trade at a higher value that the separate pieces.
- The portfolios also include $14.5 billion in agency CMBS—largely Ginnie Mae project loans, of which there is only $136 billion outstanding—and that market, too, has seen limited new issue and almost no secondary flows. The agency CMBS coming out also should trade well below par and will have to find new buyers other than the banks that typically buy Ginnie Mae CMBS and put it in held-to-maturity. These securities again will have to trade at a good value relative to pass-throughs to draw in money managers and leveraged investors
Exhibit 3: Size and source of likely flows out of SVB and SBNY portfolios

Note: based on 4Q2022 regulatory filings.
Source: SNL, Santander US Capital Markets
The lower liquidity of the agency CMOs and agency CMBS also suggest they should trade at wider spreads or a higher leveraged return on equity than the bank pass-through portfolios.
Implications for the liquidation process
If pass-throughs do drive valuations for the other larger parts of the bank portfolios, then prospects for orderly liquidation look good. MBS spreads are in the neighborhood of fair value for portfolios focused not on policy, like the Fed, or on liquidity, like a bank, but on investment return. Another 10 bp or 15 bp of widening would make the MBS likely to come out of the banks compelling, giving total return investors room for some tightening back to fair value. And if the pass-throughs trade at compelling levels, the CMOs and agency CMBS should find clearing levels, too.
* * *
The view in rates
OIS forward rates price in one more Fed hike in May and cuts in late summer or early fall of 50 bp through December. The market is clearly assigning more weight to the possibility that tighter bank credit will magnify the impact of cumulative Fed hikes.
Fed RRP balances closed in the last few days at $2.25 trillion, up from a week ago. Money market funds continue to get net inflows, though at a slower pace than immediately after the SVB collapse.
Settings on 3-month LIBOR have closed Friday at 526 bp, up 8 bp from two weeks ago. Setting on 3-month term SOFR closed Friday at 498 bp, up 7 bp from two weeks ago.
Further out the curve, the 2-year note closed Friday at 4.10%, up 8 bp over the last two weeks. The 10-year note closed at 3.51%, up 2 bp over the last two weeks.
The Treasury yield curve has finished its most recent session with 2s10s at -58, flatter by 2 bp over two weeks. The 5s30s finished the most recent session at 13 bp, 5 bp steeper from two weeks.
Breakeven 10-year inflation finished the week at 230 bp, down 2 bp in the last two weeks. The 10-year real rate finished the week at 121 bp, up 6 bp over the last two weeks.
The view in spreads
Volatility has started to return to earth after the MOVE index rocketed to levels last seen in 2008 and 2009. That should help risk assets for now. The Bloomberg investment grade cash corporate bond index OAS has tightened 7 bp in the last two weeks to 157 bp. Nominal par 30-year MBS spreads to the blend of 5- and 10-year Treasury yields closed Friday at 162 bp, wider by 10 bp from two weeks ago. Par 30-year MBS TOAS has closed Friday at 62 bp, wider in recent weeks under pressure from pending liquidation of SVB and Signature Bank portfolios with $56.5 billion in pass-throughs.
Investors short volatility should note that the Treasury market has started to reflect concerns about a debt ceiling showdown in late July and early August. Treasury bills maturing in that window trade at higher yields than FHLBank discount notes maturing around the same time. Volatility should rise if the standoff goes down to the wire.
The view in credit
Most investment grade corporate and most consumer balance sheets look relatively well protected against the likely impact of Fed tightening. Fixed-rate funding largely blunts the impact of higher rates on both those corporate and consumer balance sheets, and healthy stocks of cash and liquid assets allow these balance sheets to absorb a moderate squeeze on income. But other parts of the market are funded with floating debt. Leveraged and middle market balance sheets are vulnerable, especially with the sharp tightening of bank credit in the wake of SVB. Commercial office real estate looks weak along with its mortgage debt. As for the consumer, subprime auto borrowers, among others, are starting to show some cracks with delinquencies rising quickly. Some commercial real estate funded with floating-rate mortgages have started to show some stress, too.