


The Big Idea
The impact of tighter bank liquidity regulations
Steven Abrahams and Tom O'Hara, CFA | March 31, 2023
This material is a Marketing Communication and does not constitute Independent Investment Research.
Bank regulators in the last week signaled that balance sheet liquidity will get plenty of attention, among other things, in the wake of the SVB collapse. And if bank liquidity patterns over the last decade or so serve as a guide, tighter liquidity rules will draw a larger share of the aggregate bank balance sheet away from lending and possibly away from MBS and into Treasury debt and cash. Depending on ultimate decisions, bank holdings of cash and Treasury debt could go up substantially.
Both Fed Vice Chair for Supervision Michael Barr and FDIC Chairman Martin Gruenberg told the Senate Banking Committee on March 28 that bank liquidity was on their radar. But regulators have had liquidity on their radar since at least the Global Financial Crisis, or GFC. Liquidity rules applied after the GFC and modified in 2019 create a natural experiment in the impact of tighter or looser rules on balance sheet composition.
Based on the results of those natural experiments, an extreme upper bound on the shift into liquid assets—a scenario where all banks acted like GSIBs—could see $1.8 trillion move out of lending and MBS and into cash and Treasury debt.
A natural experiment: LCR development, implementation and change
From 2010 through 2014, US bank regulators developed the Liquidity Coverage Ratio, or LCR. The LCR rules required banks to hold enough liquid assets—high quality liquid assets, or HQLA—for the bank to sell or finance the assets and meet demand for net cash outflows in a 30-day liquidity crisis. Banks had to hold 60% of the required HQLA by the start of 2015 and 10% more each year until reaching 100% at the start of 2019. Phasing in the rules created a natural experiment in tighter liquidity requirements over time.
Regulators also decided to apply different liquidity rules to banks depending largely on asset size. The initial rules applied the tightest liquidity requirements to Global Systemically Important Banks, or GSIBs, and to other banks with $250 billion or more in total assets (Exhibit 1). These GSIBs and large banks had to hold at least 100% of estimated HQLA. Banks with $50 billion to $250 billion in total assets needed only 70% of estimated HQLA. And banks with less than $50 billion in total assets had no prescribed LCR. Differences in LCR by asset size created a second experiment.
Then Congress passed the Economic Growth, Regulatory Relief and Consumer Protection Act on May 18, 2018, and regulators relaxed LCR rules effective October 10, 2019. GSIBs saw no change under the modified rules. Banks with $250 billion or more in total assets had to hold only 85% of estimated HQLA. Banks with $100 billion to $250 billion in total assets had to hold only 50% of estimated HQLA. And banks with less than $100 billion in total assets had no prescribed LCR. The relaxed rules created a before-and-after experiment.
Exhibit 1: Initial and modified bank liquidity rules

* If weighted short-term wholesale funding < $75B
** If weighted short-term wholesale funding < $50B
Source: Federal Reserve, Santander US Capital Markets
Impact of LCR on holdings of core HQLA
The impact of the LCR rules show up clearly in bank holdings over time of core HQLA—cash, Treasury debt and agency MBS. LCR regulations give these assets some preferred status for meeting liquidity requirements, and the size and liquidity of these markets make it easier for banks to manage their holdings. These assets make up the vast majority of HQLA portfolios. A few observations (Exhibit 2):
- The impact of phasing in HQLA shows up clearly. Holdings at GSIBs moved up as initial implementation started in 2015 and remained flat through 2019, presumably because the GSIBs started implementation close to full compliance. But all smaller banks except those under $50 billion in assets and exempt show generally rising levels of HQLA from 2015 through 2019.
- The impact of different rules across bank tiers shows up clearly. Larger banks, subject to tighter liquidity requirements, generally hold a larger share of total assets in HQLA. But it is important to note that differences across bank size could also reflect differences in estimated net cash outflow in a 30-day liquidity crisis. Regulators prescribe different rates of assumed outflows for different types of deposits—3% for guaranteed retail customers, for example, 40% for partially guaranteed brokered deposits and 100% for commercial paper—and bigger banks could have more vulnerable funding. Both differences in LCR and in deposit mix are likely at play.
- The impact of relaxed rules in 2019 is more subtle. Shortly after the new rules went into effect, pandemic led to Fed QE and fiscal stimulus and flooded the banking system with cash. The share of bank balance sheets in core HQLA went up across all bank tiers, mainly in the form of reserves at the Fed. After QE stopped, HQLA share dropped across tiers. But HQLA share dropped the most—nine percentage points—for banks between $50 billion and $100 billion in total assets where prescribed LCR rules disappeared after 2019.
Exhibit 2: Core HQLA holdings show impact of LCR over time, across bank tiers
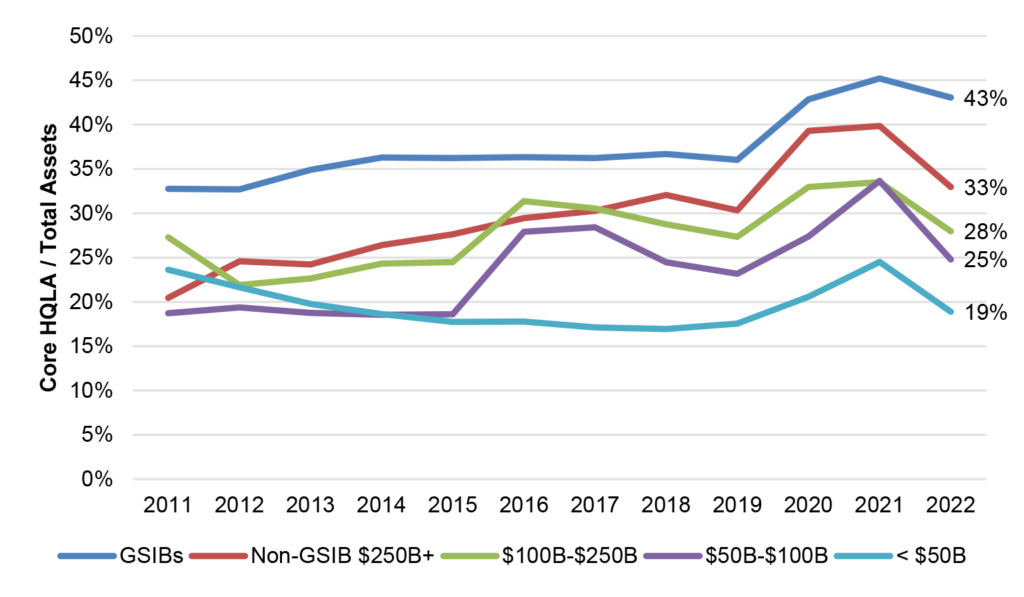
Note: Core HQLA include cash assets, Treasury debt and agency MBS.
Source: SNL, Santander US Capital Markets
Estimating the impact of tighter liquidity regulations
The current share of HQLA across different tiers of banks allows a crude estimate of tighter liquidity rules. In the most extreme case, assuming all banks hold 100% of estimated HQLA and assuming all banks have a deposit base that mirrors the mix of the GSIBs, then all banks would match current GSIB share and hold 43% of the balance sheet in core HQLA. Of course, this is unrealistic and mainly useful for estimating an upper bound on the impact of tighter liquidity rules. For non-GSIB banks with more than $250 billion in assets, for instance, core HQLA share under these extreme assumptions would go from 33% to 43%. And with total assets in that bank tier of $2.8 trillion, an extra $282 billion would go into core HQLA (Exhibit 3). Across all bank tiers, the shift to GSIB standards would move a cumulative $1.8 trillion into core HQLA.
Exhibit 3: Dollars going from lending to HQLA if all banks acted like GSIBs

Note: Data show impact if core HQLA share needed to match the GSIB share of 43%. Based on total assets in each bank tier at the end of 2022.
Source: SNL, Santander US Capital Markets
The important thing to note is that tighter liquidity rules would likely move a meaningful share of the aggregate bank balance sheet from lending into HQLA, tightening the availability of bank credit.
Estimating shifts in the mix of HQLA
Beyond absolute amounts of HQLA, the current mix of HQLA across different tiers of bank allows a crude estimate of how HQLA might get reallocated. The different tiers of banks show distinct patterns in their mix of HQLA. GSIBs, for example, hold a notably higher share of HQLA in cash and Treasury debt while non-GSIB banks with more than $250 billion in total assets hold a notably high share of MBS (Exhibit 4).
Exhibit 4: Varying allocation of core HQLA across cash, Treasury debt and MBS

Note: Based on holdings at the end of 2022.
Source: SNL, Santander US Capital Markets
Under the heroic assumption that all banks would swing to the same core HQLA allocation as GSIBs, cash and Treasury allocations would increase and lending and MBS allocations fall. This assumption again is unrealistic and only useful for setting an upper bound. But across all banks, cash would rise by $1.8 trillion, Treasury debt by $526 billion, MBS would fall by $506 billion with the balance of additional HQLA coming out of the lending book.
Pointing toward tighter credit, more liquid assets
The recent history of bank balance sheets argues that bank credit and investment portfolios will respond over time and across banks to changes in liquidity rules. The amount of change will depend on requirements from regulators, voluntary decisions made by bank management and any changes in the assumed or actual behavior of depositors—after all, SVB showed that depositors may run a lot faster than regulators or bank managers imagined. Tighter liquidity rules should help the markets for cash and Treasury debt at the expense of lending and MBS.
* * *
The view in rates
OIS forward rates even after the March FOMC anticipate only a small chance of more hikes in Fed funds this year and cuts in late summer or early fall of 50 bp through December. The Fed will have to balance the impact of SVB on bank credit against its competing commitment to beat persistent inflation.
Fed RRP balances closed in the last few days at $2.37 trillion, up $157 billion from a week ago and $269 billion from two weeks ago. Money market funds through March 29 saw $67 billion of inflows following two prior weeks of more than $100 billion each, so that would be feeding the RRP balances.
Settings on 3-month LIBOR have closed Friday at 518 bp, up 8 bp on the week. Setting on 3-month term SOFR closed Friday at 491 bp, up 3 bp on the week. The spread between these benchmarks is 29 bp wider since March 7.
Further out the curve, the 2-year note closed Friday at 4.02%, up 25 bp on the week. The 10-year note closed at 3.49%, up 9 bp on the week.
The Treasury yield curve has finished its most recent session with 2s10s at -56 bp, 16 bp flatter on the week. The 5s30s finished the most recent session at 7 bp, 15 bp flatter on the week.
Breakeven 10-year inflation finished the week at 232 bp, up 11 bp in the last week. The 10-year real rate finished the week at 115 bp, down 1 bp in the last week.
The view in spreads
Volatility has started to return to earth after the MOVE index rocketed to levels last seen in 2008 and 2009. Nominal par 30-year MBS spreads to the blend of 5- and 10-year Treasury yields closed Friday at 152 bp, down 2 bp on the week. Par 30-year MBS TOAS has closed Friday at 54 bp, wider by 8 bp on the week.
The view in credit
Most investment grade corporate and most consumer balance sheets look relatively well protected against the likely impact of Fed tightening. Fixed-rate funding largely blunts the impact of higher rates on both those corporate and consumer balance sheets, and healthy stocks of cash and liquid assets allow these balance sheets to absorb a moderate squeeze on income. But other parts of the market are funded with floating debt. Leveraged and middle market balance sheets are vulnerable, especially with the sharp tightening of bank credit in the wake of SVB. Commercial office real estate looks weak along with its mortgage debt. As for the consumer, subprime auto borrowers, among others, are starting to show some cracks with delinquencies rising quickly. Some commercial real estate funded with floating-rate mortgages have started to show some stress, too.