The Long and Short
Banks and REITs poised to outperform
This material is a Marketing Communication and does not constitute Independent Investment Research.
Banks and REITs look poised to outperform other investment grade credits if spreads continue to tighten. These sectors have generally lagged the investment grade index since at least mid-2021. But in the recent tightening in spreads—more than 40 bp in OAS on the index since mid-October— banks particularly along with REITs have recovered more than others due in part to limited supply as well as the rapid recovery in higher beta credits such as Credit Suisse. This trend should continue if spreads stay on their current glide path and investment grade credit continues to be well bid.
Exhibit 1. IG OAS move by sector since the post-pandemic tights (6/30/21)
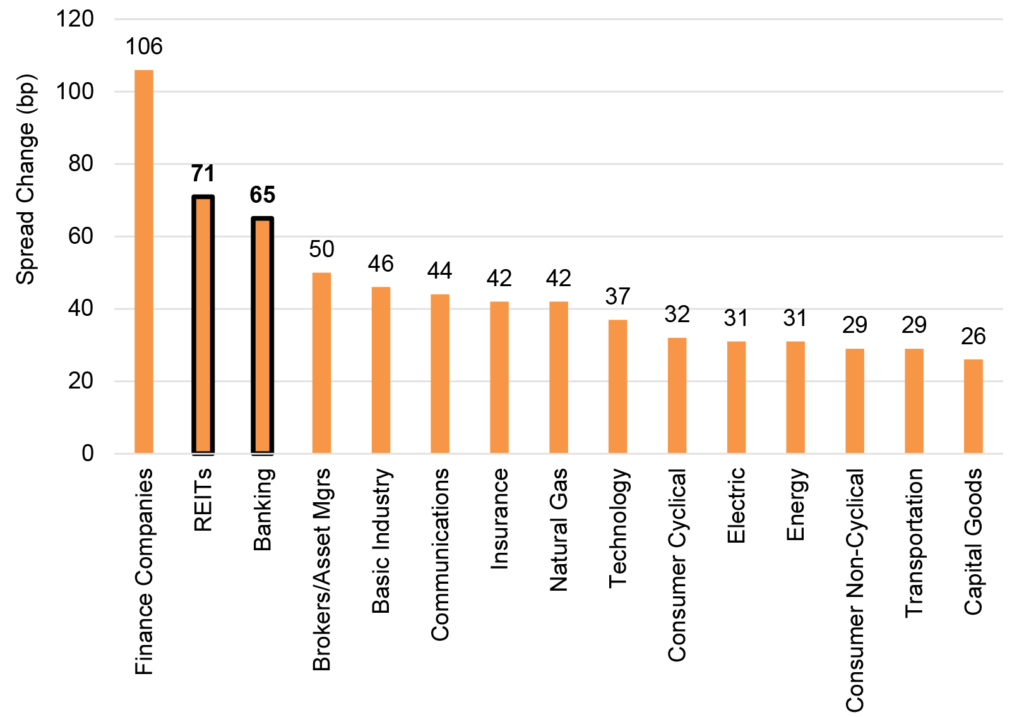
Source: Amherst Pierpont, Bloomberg/Barclays IG Index
Banks and REITs have turned in relatively weak performances since investment grade credit hits its tightest levels in mid-2021 (Exhibit 2, 3). This shows up in both OAS and credit returns. Spreads since mid-2021 have widened by 65 bp for banks and 71 bp for REITs. The only segment that saw more volatility was the smaller finance companies in the index. Looking at excess return, which captures performance net of equivalent Treasury debt, banking (-1.56%) and REITs (-2.09%) fell among the bottom sectors in the entire investment grade index.
Exhibit 2. Excess returns by sector since the post-pandemic tights (6/30/21)
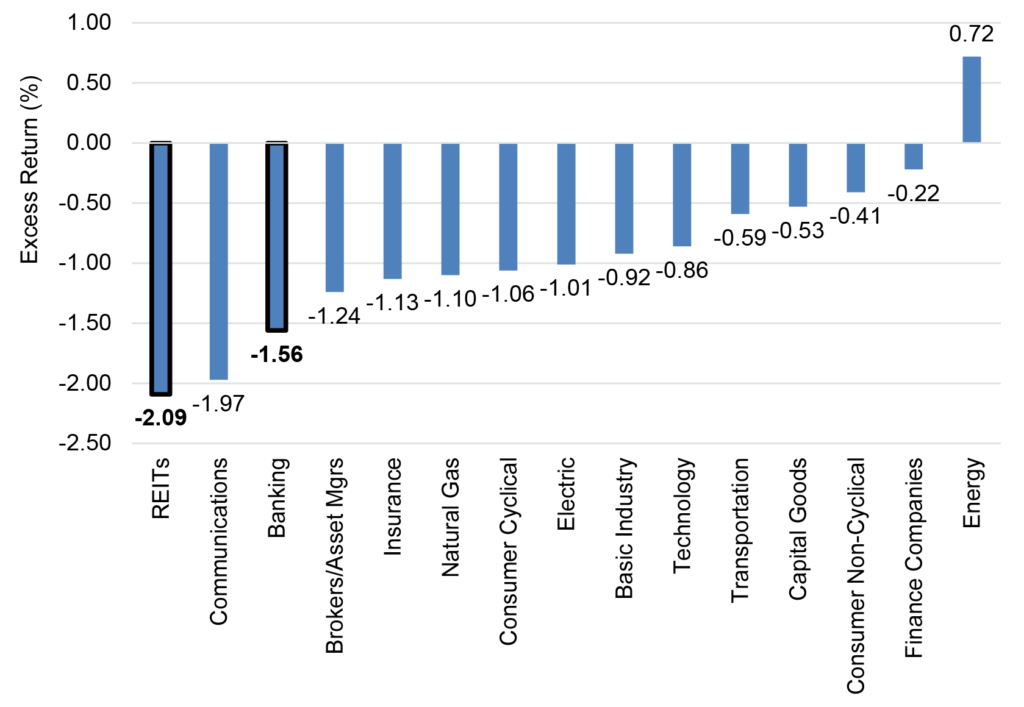
Source: Amherst Pierpont, Bloomberg/Barclays IG Index
In mid-2021, banking traded tighter than any other sector at a level wrapped around 65 OAS and a duration of about 5.8 years (Exhibit 3). REITs stood at a level of about 82 OAS, which was relatively in-line with some of the lower-duration segments of the index such as consumer non-cyclical (77), capital goods (77), and insurance (85).
Exhibit 3. Sector-by-sector OAS vs duration at the post-pandemic tights (6/30/21)
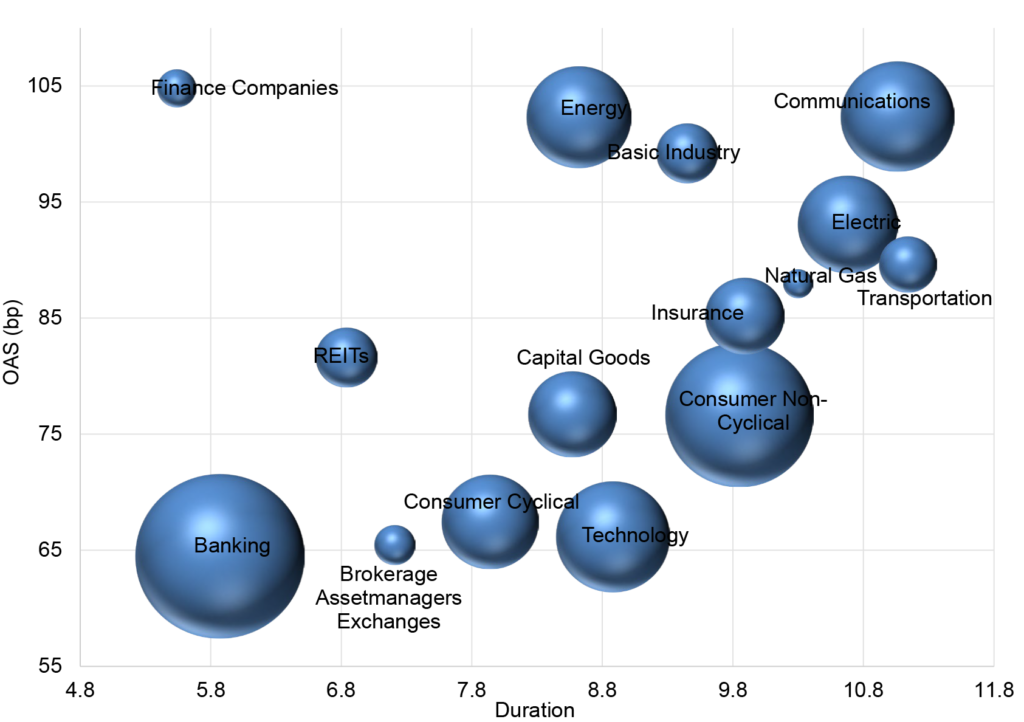
Note: the graphic demonstrates where each sector OAS was relative to duration at the time that the index achieved its tightest level since mid-2021. The size of the spheres represents each sectors’ relative market value in the index.
Source: Amherst Pierpont, Bloomberg/Barclays IG Index, size indicates the relative market value of each sector within the index
Those dynamics have changed over the past roughly year and a half as the two sectors, banking and REITs, have vastly underperformed other segments over that period (Exhibit 4). Banking OAS now sits at roughly 130, above the index average of 123. This is a substantial change from where it sat relative to other sectors when the index was at the local tights. Likewise, REITs are now at an OAS of 153, making them the second widest trading segment in the index only to the small, higher-risk finance companies bucket. As spreads move tighter, these sectors should continue to revert closer to their relative placements along the OAS and duration curve.
Exhibit 4. Sector-by-sector OAS vs duration as of this week (1/18/23)
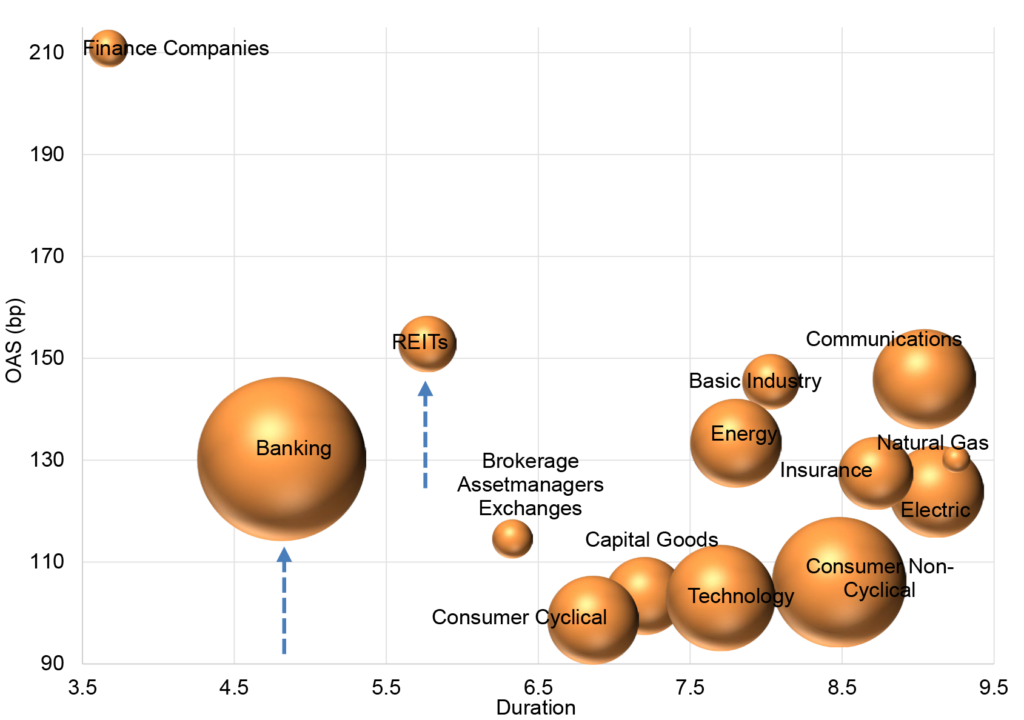
Source: Amherst Pierpont, Bloomberg/Barclays IG Index, size indicates the relative market value of each sector within the index
Obviously, there are critical fundamental and credit as well as supply and demand dynamics that have been accounting for the changes these sectors have undergone within the index over the past year and a half. In the case of the banking sector, higher beta Yankee credits such as Credit Suisse have been weighing heavily on overall sector performance over the past several months. Meanwhile, REITs have struggled as fundamental perceptions about broad sector’s operating outlook have caused a shortage of demand for paper within the segment. Nevertheless, as the overall trajectory of spreads continues to improve, these sectors look poised to outpace the broader index and see their relative placement along the OAS and duration spectrum revert back to more historical norms if the overall index moves tighter.
This material is intended only for institutional investors and does not carry all of the independence and disclosure standards of retail debt research reports. In the preparation of this material, the author may have consulted or otherwise discussed the matters referenced herein with one or more of SCM’s trading desks, any of which may have accumulated or otherwise taken a position, long or short, in any of the financial instruments discussed in or related to this material. Further, SCM may act as a market maker or principal dealer and may have proprietary interests that differ or conflict with the recipient hereof, in connection with any financial instrument discussed in or related to this material.
This message, including any attachments or links contained herein, is subject to important disclaimers, conditions, and disclosures regarding Electronic Communications, which you can find at https://portfolio-strategy.apsec.com/sancap-disclaimers-and-disclosures.
Important Disclaimers
Copyright © 2026 Santander US Capital Markets LLC and its affiliates (“SCM”). All rights reserved. SCM is a member of FINRA and SIPC. This material is intended for limited distribution to institutions only and is not publicly available. Any unauthorized use or disclosure is prohibited.
In making this material available, SCM (i) is not providing any advice to the recipient, including, without limitation, any advice as to investment, legal, accounting, tax and financial matters, (ii) is not acting as an advisor or fiduciary in respect of the recipient, (iii) is not making any predictions or projections and (iv) intends that any recipient to which SCM has provided this material is an “institutional investor” (as defined under applicable law and regulation, including FINRA Rule 4512 and that this material will not be disseminated, in whole or part, to any third party by the recipient.
The author of this material is an economist, desk strategist or trader. In the preparation of this material, the author may have consulted or otherwise discussed the matters referenced herein with one or more of SCM’s trading desks, any of which may have accumulated or otherwise taken a position, long or short, in any of the financial instruments discussed in or related to this material. Further, SCM or any of its affiliates may act as a market maker or principal dealer and may have proprietary interests that differ or conflict with the recipient hereof, in connection with any financial instrument discussed in or related to this material.
This material (i) has been prepared for information purposes only and does not constitute a solicitation or an offer to buy or sell any securities, related investments or other financial instruments, (ii) is neither research, a “research report” as commonly understood under the securities laws and regulations promulgated thereunder nor the product of a research department, (iii) or parts thereof may have been obtained from various sources, the reliability of which has not been verified and cannot be guaranteed by SCM, (iv) should not be reproduced or disclosed to any other person, without SCM’s prior consent and (v) is not intended for distribution in any jurisdiction in which its distribution would be prohibited.
In connection with this material, SCM (i) makes no representation or warranties as to the appropriateness or reliance for use in any transaction or as to the permissibility or legality of any financial instrument in any jurisdiction, (ii) believes the information in this material to be reliable, has not independently verified such information and makes no representation, express or implied, with regard to the accuracy or completeness of such information, (iii) accepts no responsibility or liability as to any reliance placed, or investment decision made, on the basis of such information by the recipient and (iv) does not undertake, and disclaims any duty to undertake, to update or to revise the information contained in this material.
Unless otherwise stated, the views, opinions, forecasts, valuations, or estimates contained in this material are those solely of the author, as of the date of publication of this material, and are subject to change without notice. The recipient of this material should make an independent evaluation of this information and make such other investigations as the recipient considers necessary (including obtaining independent financial advice), before transacting in any financial market or instrument discussed in or related to this material.
Important disclaimers for clients in the EU and UK
This publication has been prepared by Trading Desk Strategists within the Sales and Trading functions of Santander US Capital Markets LLC (“SanCap”), the US registered broker-dealer of Santander Corporate & Investment Banking. This communication is distributed in the EEA by Banco Santander S.A., a credit institution registered in Spain and authorised and regulated by the Bank of Spain and the CNMV. Any EEA recipient of this communication that would like to affect any transaction in any security or issuer discussed herein should do so with Banco Santander S.A. or any of its affiliates (together “Santander”). This communication has been distributed in the UK by Banco Santander, S.A.’s London branch, authorised by the Bank of Spain and subject to regulatory oversight on certain matters by the Financial Conduct Authority (FCA) and the Prudential Regulation Authority (PRA).
The publication is intended for exclusive use for Professional Clients and Eligible Counterparties as defined by MiFID II and is not intended for use by retail customers or for any persons or entities in any jurisdictions or country where such distribution or use would be contrary to local law or regulation.
This material is not a product of Santander´s Research Team and does not constitute independent investment research. This is a marketing communication and may contain ¨investment recommendations¨ as defined by the Market Abuse Regulation 596/2014 ("MAR"). This publication has not been prepared in accordance with legal requirements designed to promote the independence of research and is not subject to any prohibition on dealing ahead of the dissemination of investment research. The author, date and time of the production of this publication are as indicated herein.
This publication does not constitute investment advice and may not be relied upon to form an investment decision, nor should it be construed as any offer to sell or issue or invitation to purchase, acquire or subscribe for any instruments referred herein. The publication has been prepared in good faith and based on information Santander considers reliable as of the date of publication, but Santander does not guarantee or represent, express or implied, that such information is accurate or complete. All estimates, forecasts and opinions are current as at the date of this publication and are subject to change without notice. Unless otherwise indicated, Santander does not intend to update this publication. The views and commentary in this publication may not be objective or independent of the interests of the Trading and Sales functions of Santander, who may be active participants in the markets, investments or strategies referred to herein and/or may receive compensation from investment banking and non-investment banking services from entities mentioned herein. Santander may trade as principal, make a market or hold positions in instruments (or related derivatives) and/or hold financial interest in entities discussed herein. Santander may provide market commentary or trading strategies to other clients or engage in transactions which may differ from views expressed herein. Santander may have acted upon the contents of this publication prior to you having received it.
This publication is intended for the exclusive use of the recipient and must not be reproduced, redistributed or transmitted, in whole or in part, without Santander’s consent. The recipient agrees to keep confidential at all times information contained herein.


