


The Long and Short
Lessons learned in corporate credit in 2022, Part I
Dan Bruzzo, CFA | December 16, 2022
This material is a Marketing Communication and does not constitute Independent Investment Research.
The investment grade corporate market had plenty of lessons to teach this year, but a few of the most interesting revolved about the tradeoff between credit and interest rate risk, the opportunities in a rebounding credit and the risks in a falling one. All of them look likely to come in handy in 2023.
#1 Credit risk versus duration risk study favors ‘AA’ to ‘A’ trading strategy (10/21/22)
In the third week of October, I looked at whether investors would be better served at the time to take on additional credit risk or consider extension trades in the intermediate part of the curve to bolster yield. Using historical analysis of various trading strategies, it was very quickly apparent that the available spread pick to move into ‘A’ credit from ‘AA’ credit offered the most compelling reward versus the historic performance of the strategy. Given the inversion of the 2s10s Treasury curve and relative flatness of the investment grade credit curve, duration strategies offered little incentive according to historic incremental yield available.
Exhibit 1. Historical spread pick to move into ‘A’ credit from ‘AA’
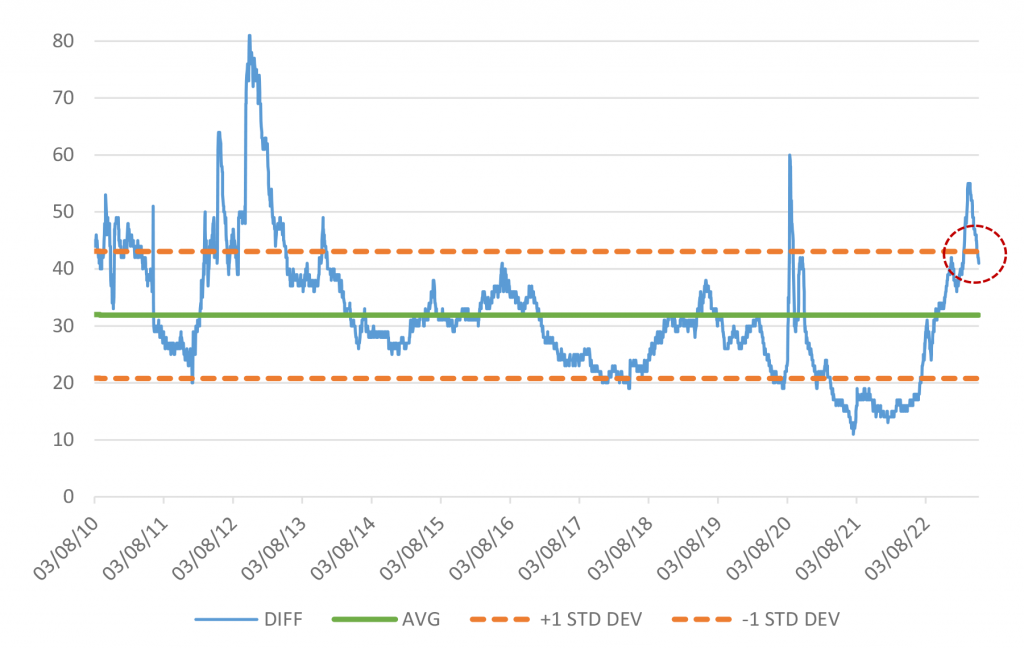
Source: Amherst Pierpont, Bloomberg, corporate indices OAS
The relationship peaked on October 28 at nearly two full standard deviations above the historic mean, and has since moved below a single standard deviation, as the overall credit markets recovered sharply in the interim period. At the time of the study, investors could pick up an average of 54 bp for moving from ‘AA’ credit to ‘A’ credit according to Bloomberg fair value corporate indices. That relationship now stands at 41 bp, which is still well above the 32 bp historic average.
Meanwhile, comparatively, the available spread pick to move from ‘A’ credit to ‘BBB’ credit was already trending below the historical mean back in the third week of October. That relationship has also moved even tighter with the overall rally in corporate credit spreads over the past six to seven weeks and is threatening to move a full standard deviation below the historical mean at 50 bp versus the 59 bp average.
Exhibit 2. Historical spread pick to move into ‘BBB’ credit from ‘A’
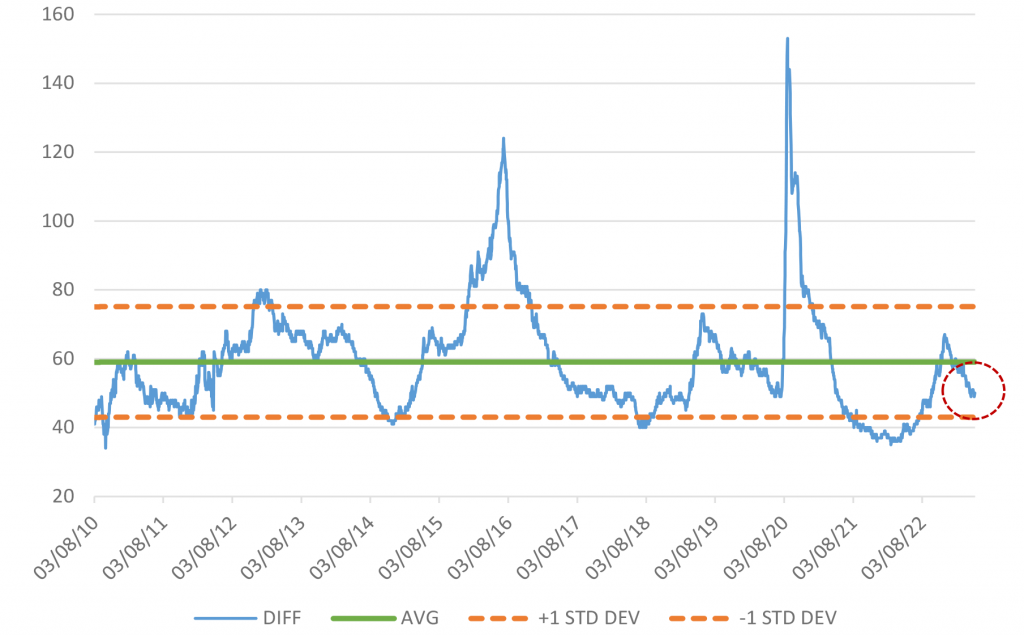
Source: Amherst Pierpont, Bloomberg, corporate indices OAS
That suggests that as credit continues to grind tighter, investors are still best compensated historically for the step down into ‘A’ from ‘AA’ credit, rather than a move to ‘BBB’ from ‘A,’ at least on an historic basis. That’s not to say that investors will not seek out lower-rated credit in the recovery, but rather to pinpoint where those efforts are more generously rewarded on a historic basis. In either case, extension strategies have only worsened in available yield-pick within the IG credit market, further suggesting that credit remains the preferred risk enhancement strategy as we head into the new year.
#2 Boeing has taken enough steps to help smooth the path forward to recovery (4/29/22)
At the end of April, following extremely weak first quarter results, I suggested that Boeing (BA: Baa2/BBB-/BBB-) might finally be seeing the light the at the end of the tunnel, and might be on a clearer path to operating recovery for bondholders. At the time, management took several charges that were one-time in nature, but kept guidance intact to reach positive operating cash flow for the full fiscal year of 2022. BA has been among the higher beta credit performers in investment grade industrials throughout the year. Spreads initially moved considerably wider following the first quarter earnings report and hit a peak near the third week of June with 5-year CDS spreads topping out at 275. And while BA spreads also gapped out with the broader market in the fall, all told the 5-year CDS level moved from 193 at the end of April, to 129 in the second week of December, vastly outperforming the industrial sector and the broader IG market.
Exhibit 3. Boeing 5-yr CDS vs Bloomberg Investment Grade Index
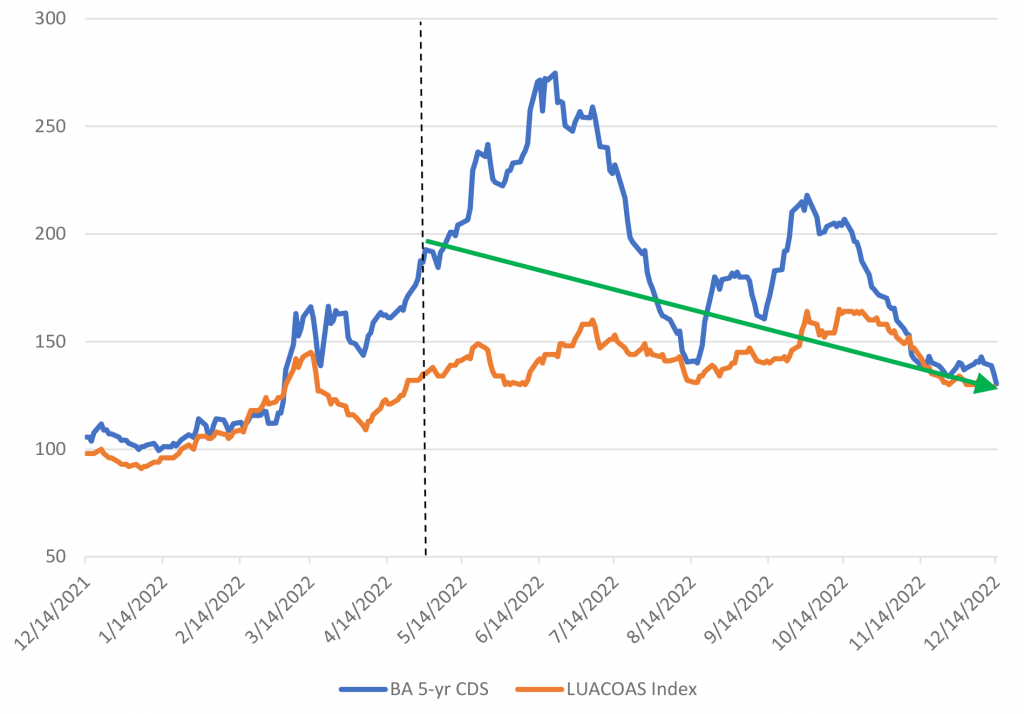
Source: Amherst Pierpont, Bloomberg, corporate indices OAS, 5-yr CDS spreads
Even now, Boeing still trades at a considerable discount to its IG Aerospace/Defense peers (Exhibit 4), making its relative weighting an important decision among index investors – particularly given the size of its debt footprint within the index. I still believe investors are well served to overweight the name and expect BA will be a relative outperformer to the rest of the sector in 2023. Recent earnings were a bit mixed, and management continued to take additional charges beyond those in the first quarter that we previously referenced. Nevertheless, there is enough positive momentum and long-term attractiveness for secular demand to support this position.
Just this week, BA announced an historic widebody order from United Airlines to buy 100 Boeing 787s with options to purchase another 100, the largest order of its kind. This was the latest in a string of positive developments for the operator. The FAA had already resumed deliveries of 787s earlier in the fall as expected. After delivering just 21 year-to-date in 2022, management recently laid out its plans to reach a production rate of 10 787s per month by 2025. At its recent investor day, BA stated that it also expects that free cash flow for the full year will be $1.5 billion to $2 billion, delivering on its earlier promise to hit positive cash flow this year. Recent guidance for free cash flow next year is in the $3 billion to $5 billion range, which was on the lower end of expectations, but the company’s longer-term expectation is in the area of $10 billion within the next couple of years. Management stated at its recent investor day that it has sufficient liquidity to put cash toward accelerated debt paydowns in the near-term, and that maintenance of an investment grade credit profile remains a priority.
Exhibit 4. Boeing versus IG Aerospace/Defense peers
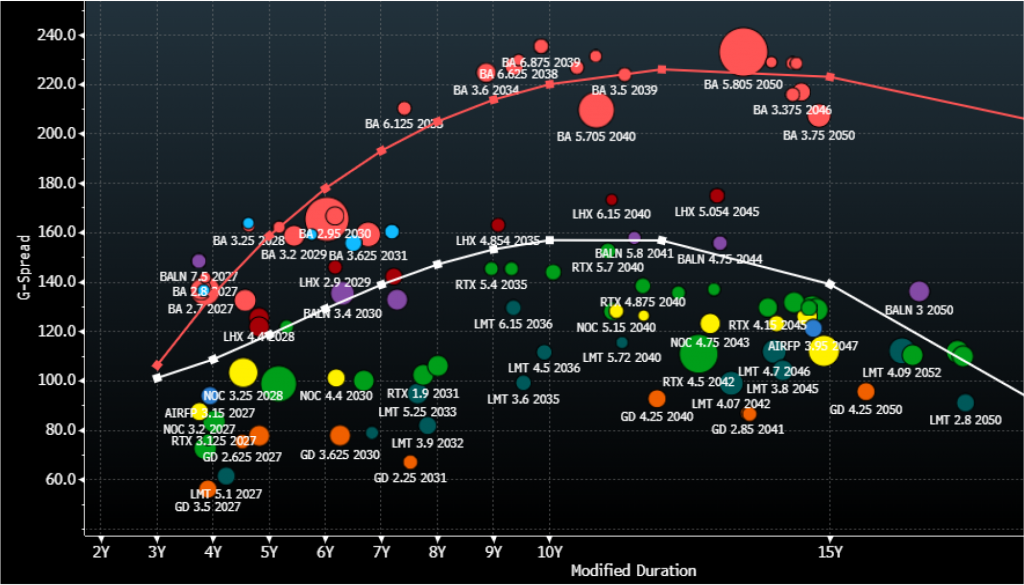
Source: Amherst Pierpont, Bloomberg/TRACE G-spread indications
#3 Credit Suisse might have done enough to restore investor confidence (10/28/22)
Later in the year, another one of the investment grade market’s higher beta credit situations appeared poised to improve with a series of actions from a management team under pressure. In what is probably the least effective market call in this study, we highlighted the efforts by Credit Suisse (CS: Baa2/BBB-) back at the end of October as possibly being enough to help restore investor confidence and address operational weaknesses. The Swiss bank’s difficulties have only continued since then, and the market’s perception of the credit has continued to deteriorate.
Exhibit 5. Credit Suisse 5-yr CDS vs Bloomberg Investment Grade Index
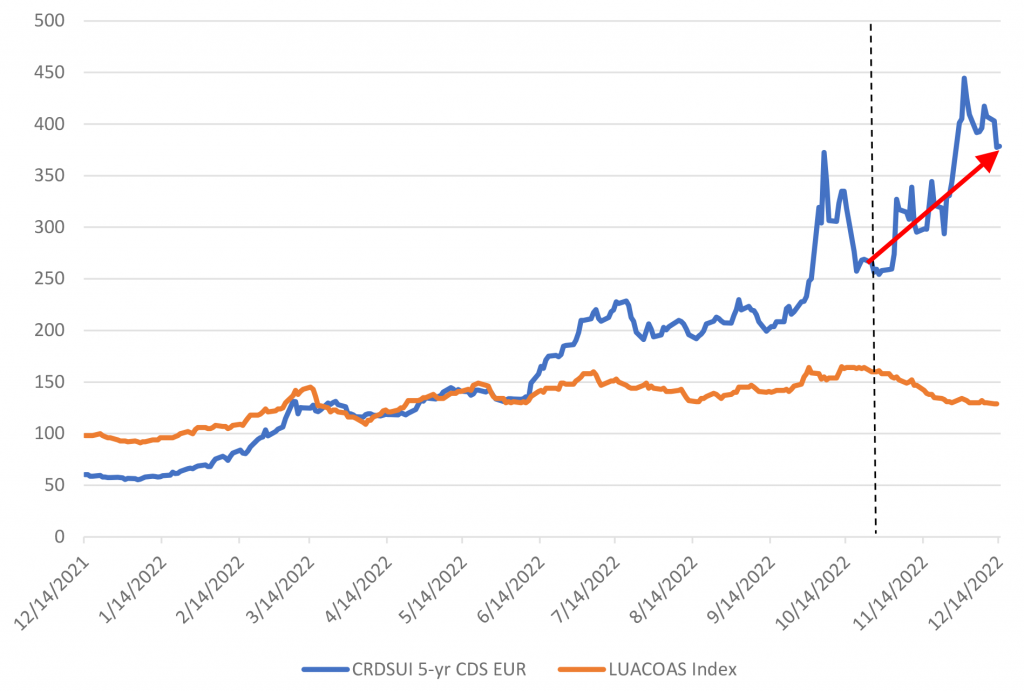
Source: Amherst Pierpont, Bloomberg, corporate indices OAS, 5-yr CDS spreads
Back in late October, CS had announced a $4.1 billion equity capital raise which would establish the Saudi National Bank as the second largest shareholder with around a 10% stake in the company. Management also announced restructuring plans that included sizable headcount reduction, the creation of a “capital release unit” or “bad bank” for its most troubled holdings, and the sale of its securitized products group.
While CS management has made progress on these plans, including the official launch of its rights offering last week to raise a total of $4.3 billion, doubts still loom about the longer-term prospects of the bank, and spread levels continue to reflect a tremendous amount of uncertainty. Furthermore, in a November preview of fourth quarter earnings, CS management projected a substantial loss for the quarter. Perhaps more concerning was news that deposits, and net asset outflows have abated a bit since peaks in October but had yet to fully reverse course. As a result, CS used liquidity buffers in order to bolster regulatory ratios. More recently, CS saw a moderate stock recovery on comments from management that the outflows may be finally coming to an end, but it has been a rocky ride since our initial report several weeks earlier, nonetheless.
CS may see a recovery in 2023, but for the time being I would urge caution to bond investors as the bank is clearly in the midst of a crisis of confidence. These scenarios become extremely difficult to analyze, and even more difficult to predict given the emotional element in the market. There is longer-term opportunity in front-end CS maturities but the situation remains highly fluid and only appropriate for investors with higher risk tolerance and recognition that the name is likely to remain highly volatile in the near-term.