


The Big Idea
A tide of lower rates and lower volatility
Steven Abrahams | January 20, 2023
This material is a Marketing Communication and does not constitute Independent Investment Research.
Debt markets have jumped off to a blazing start this year with every major asset class up sharply. But this bullish turn actually started in the fourth quarter last year on a tide of lower rates and lower volatility. The prospects for the tide to keep on rolling look good, although a potential end to Japan’s yield curve control and a showdown over the US debt ceiling are clear wildcards.
A fast start to 2023
Risk assets have led the way in January with high yield corporate debt returning an average of 37 bp a day and investment grade debt returning an average of 33 bp a day (Exhibit 1). MBS is returning an average of 26 bp a day so far with leveraged loans, agency and private CMBS and Treasury debt clustered around 20 bp a day. ABS trails at an average of 10 bp a day.
Exhibit 1: Debt markets have jumped off to a blazing start to 2023

Note: Daily returns on leveraged loans based on the Morningstar/LSTA index with all other asset classes based on Bloomberg indices. YTD23 returns through 1/17/23.
Source: Bloomberg, Amherst Pierpont Securities
The pace marks a big uptick from last year. All asset classes delivered gains in the last quarter of 2022 after steadily losing money for the first nine months. The lower rates and lower volatility that drove performance in the fourth quarter have continued into this year.
Falling volatility lifted returns in the fourth quarter
A sizable share of fourth quarter returns in risk assets came from the tightening spreads, or excess return, that often accompany a drop in volatility. Of the 17.7% annualized return on high yield in the fourth quarter, for example, 10.1% came from excess return (Exhibit 2). Of the 15.7% annualized investment grade return, 9.3% came from excess return. And of the 11.4% annualized leveraged loan return, 10.8% came from excess return. Even on the 9.5% annualized return in agency MBS, 3.5% came from excess return.
Exhibit 2: Excess return drove risk asset returns in the last quarter of 2022

Note: Returns from 9/30/2022 through 12/31/2022. Daily returns on leveraged loans based on the Morningstar/LSTA index with all other asset classes based on Bloomberg indices.
Source: Bloomberg, Amherst Pierpont Securities
Rates helped returns as well
The balance of good performance in the fourth quarter came from lower rates in the belly of the yield curve. The 5-year Treasury yield dropped 9 bp through the quarter with yields on both shorter and longer maturities rising. But all asset classes except leveraged loans and ABS started the quarter with duration of between four and seven years, well positioned to rally as 5-year rates fell.
Strongest risk-adjusted returns came in credit
Credit lately has shown both the strongest absolute and risk-adjusted return. Leveraged loans have delivered the most return for each unit of risk, 615 bp, ending in the upper left of asset mean-variance performance (Exhibit 3). High yield follows in the upper left with 233 bp of return for each unit of risk. Other debt sectors trail well behind these credit benchmarks.
Exhibit 3: Loans, high yield and IG corporate debt posted quality 4Q22 returns

Note: Returns from 9/30/2022 through 12/31/2022. Daily returns on leveraged loans based on the Morningstar/LSTA index with all other asset classes based on Bloomberg indices.
Source: Bloomberg, Amherst Pierpont Securities
Characteristic low correlation for leveraged loans
Through this bullish turn, most assets have been relatively highly correlated except for leveraged loans. The correlations of daily returns between sectors with relatively high interest rate exposure and low credit risk have run above 0.90. The correlation between Treasury debt and investment grade corporate debt, for example, has run at 0.96, largely reflecting similar sensitivity to rates. The correlation between high yield and other sectors has run between 0.49 and 0.67, reflecting relatively greater sensitivity to credit. And the correlation of leveraged loans to other sectors, except for its correlation with high yield, has run at 0.21 or lower reflecting high sensitivity to credit and almost no sensitivity to rates since most loans float over LIBOR or SOFR. Leveraged loans continue to show strong ability to diversify a fixed income portfolio.
Exhibit 4: Loans again shows characteristic low correlation with other sectors
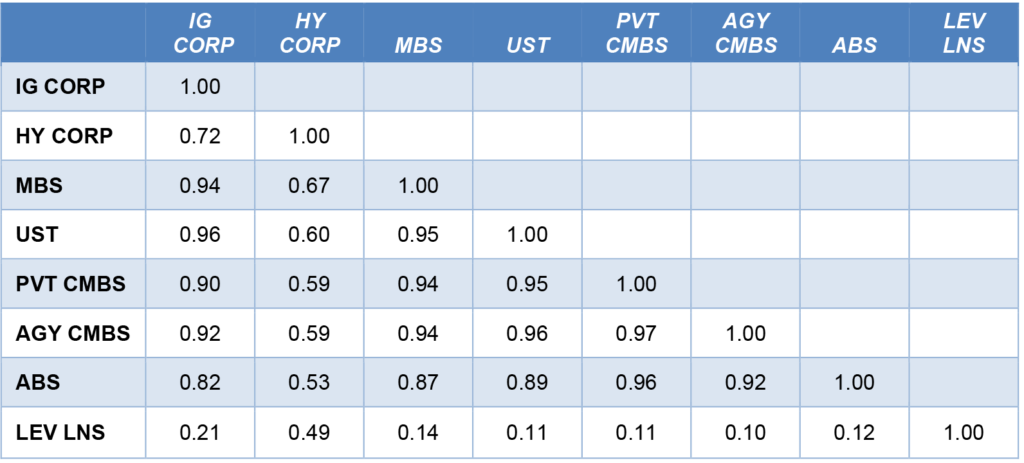
Note: Correlation of daily returns from 9/30/2022 through 12/31/2022. Daily returns on leveraged loans based on the Morningstar/LSTA index with all other asset classes based on Bloomberg indices.
Source: Bloomberg, Amherst Pierpont Securities
Risks from an end to yield curve control and from a debt showdown
Prospects for lower rates and lower volatility this year continue to look good, although an end to Japan’s yield curve control and a showdown over the US debt ceiling pose clear risks.
US and other global rates could rise sharply if Japan ends yield curve control. Rates rose globally after Japan’s decision in December to let 10-year rates rise from 0.25% to 0.50%. And many investors continue to speculate that the Bank of Japan will eventually pull back from the large bond purchases currently keeping rates low and draining liquidity from Japan’s debt market. Higher rates in Japan would likely cut the bid for US and other debt now coming from Japan’s banks, insurers and other investment funds. Japan is the single largest foreign holder of long-term US debt.
Showdowns over the US debt ceiling have been modest affairs in recent years, but the circumstances look different this time. House Speaker McCarthy has reportedly agreed to pair any legislation to raise the debt ceiling with major cuts to both federal social and defense spending, a combination likely to draw opposition from Democrats and some moderate Republicans. If McCarthy fails to pair a higher debt ceiling with spending cuts, he could be subject to a “motion to vacate the chair” from any member of the House, triggering an immediate vote and tying up efforts to move debt ceiling legislation forward. The risks from a showdown will likely put a floor on how low volatility can go until the issue gets resolved.
* * *
The view in rates
OIS forward rates continue price for peak fed funds around 5% in June with nearly 50 bp of cuts by the end of year. The cuts run contrary to warnings from Fed Chair Powell and other FOMC members that the Fed will hold rates high through next year. That sets up the market for a bit of volatility next year if Powell sticks to his guns. But the broad volatility trend still should be down.
Fed RRP balances closed Friday at $2.09 trillion, below the $2.20 trillion average since June. RRP balances exploded to a record $2.55 trillion on the last day of 2022, likely as banks chased deposits off their balance sheets for the final reporting day of the year.
Settings on 3-month LIBOR have closed Friday at 481 bp, unchanged over the last two weeks. Setting on 3-month term SOFR closed Friday at 465 bp, also roughly unchanged over the last two weeks. The spread between 3-month SOFR and LIBOR has renormalized after spiking in early October.
Further out the curve, the 2-year note closed Friday at 4.17%, rich given the risk of fed funds climbing to 5.0% or higher and remaining there into 2024. The 10-year note closed well above fundamental fair value at 3.48% after dipping below 3.40% earlier in the week.
The Treasury yield curve has finished its most recent session with 2s10s at -69 bp, unchanged over the last two weeks. The 5s30s finished the most recent session at 9 bp. The 2s10s curve looks likely to invert by around 100 bp shortly before Fed tightening comes to an end. That is a trade for some time next year.
Breakeven 10-year inflation finished the week at 224 bp, up only 3 bp in the last two weeks. The 10-year real rate finished the week at 124 bp, down 10 bp in the last two weeks.
The view in spreads
Volatility has started to fall so far in January and should continue with each reading on inflation and employment and each Fed meeting. Both MBS and credit tightened through November. stayed roughly flat in December but have tightened sharply in January. Nominal par 30-year MBS spreads to the blend of 5- and 10-year Treasury yields closed Friday at 135 bp. Par 30-year MBS OAS has closed Friday at 41 bp
The view in credit
Most investment grade corporate and most consumer balance sheets look relatively well protected against the likely impact of Fed tightening. Fixed-rate funding largely blunts the impact of higher rates, and healthy stocks of cash and liquid assets allow these balance sheets to absorb a moderate squeeze on income. But in leveraged loans, a higher real cost of funds has already started to eat away at highly leveraged balance sheets with weak or volatile revenues. The 25% of leveraged loans rated ‘B-/B3’ are especially vulnerable to downgrade. The leveraged loan market is the bellwether to watch for broader corporate and consumer credit, and stress in leveraged loans looks likely to spill over into CLOs.