


The Big Idea
Out-of-consensus calls on 2023 US markets
Steven Abrahams | November 18, 2022
This material is a Marketing Communication and does not constitute Independent Investment Research.
If the rise of inflation became the story of the debt markets this year, then its anticipated fall becomes the story for next. That should determine the level of rates, the slope of the curve and the rise and fall of volatility. Housing and parts of credit come into play. And certain Fed decisions could have unique impact on agency MBS. On each front, the market looks set to break with consensus just as it did this year.
The likely course of the Fed’s inflation fight next year points to six out-of-consensus calls on the 2023 US markets:
- The US 10-year Treasury rate drops below 3.25%
- The US 2s10s slope approaches -100 bp
- The range for implied rate volatility drops in half
- Home price appreciation from December-to-December stays positive
- The leveraged loan and CLO markets surf a wave of downgrades
- The Fed does not sell MBS
The US 10-year Treasury rate drops below 3.25%
The market lately has put the odds of a 10-year Treasury rate below 3.25% a year from now at less than one in three, but Treasury supply, demand and fundamentals should make those odds much higher—at least one in two. Steady monthly net Treasury issuance of $133 billion or more, monthly maturities and selling by the Fed of $65 billion and declining balances at US commercial banks, active money managers and foreign central banks has pushed longer yields well above fundamentals for now. The 1-year forward 10-year rate lately has run around 3.80%, with 1Y10Y normal volatility at 1.18%, implying only modest odds of a 50 bp rally. But some important things should change over the next year to make 10-year rates below 3.25% more likely than not:
- Debt issuance should slow. Net annual Treasury issuance should drop from around $1.9 trillion in the recently completed federal fiscal year 2022, to $1.0 trillion in fiscal 2023, according to the latest Congressional Budget Office estimates, a 46% decline. A divided Congress makes big fiscal change next year unlikely.
- Demand from foreign private portfolios should get even stronger. Foreign private portfolios this year have added more than $750 billion in US Treasury notes and bonds through September. The Russia-Ukraine conflict, recession and low rates next year in Europe and stress from financial conditions in emerging markets should boost this demand.
- Inflation, growth and the Fed path should favor lower long rates. Each inflation print next year should make the path to 2% inflation clearer, something that the TIPS market and surveys of consumers and economists all expect. Stephen Stanley expects the Fed to hold target fed funds around 5.125% for five quarters starting in May 2023, keeping financial conditions tight until the path to 2% is clear. Expected growth should return to pre-pandemic levels, if not lower, and the Fed can glide back towards neutral. That sets the stage for 10-year rates to finish 2023 below 3.25%, if not lower.
The US 2s10s slope approaches -100 bp
The 2s10s slope currently sits at -69 bp, the steepest inversion since the early 1980s, which was the last time the Fed had to fight inflation of more than 8%, From May through September 1981, the 2s10s inversion regularly exceeded -100 bp (Exhibit 1). History can repeat itself.
Exhibit 1: The 2s10s slope regularly inverted beyond -100 bp in the early 1980s
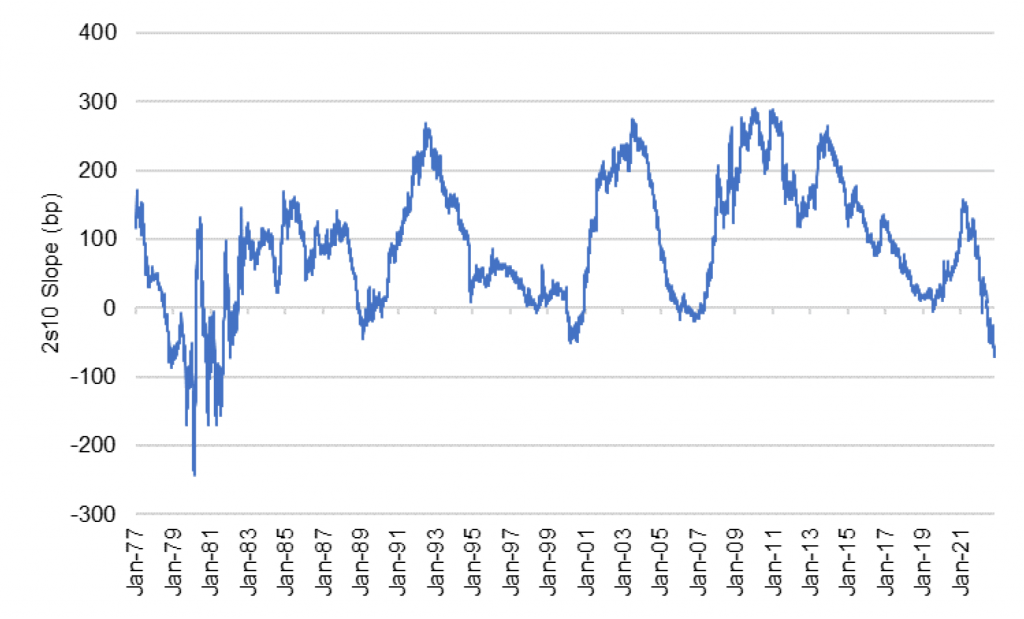
Source: Bloomberg, Amherst Pierpont Securities
For the moment, forward rates imply a 2s10s inversion a year from now of roughly -25 bp. Although Powell’s Fed is not Volcker’s—at least not yet—we are likely to see inversion approach -100 bp as the Fed approaches the end of terminal rates. If the path to target inflation is clear by then, the rates market will begin to price in a return to neutral. That return could take many forms. But if forward guidance points to steadily easing by 25 bp at each FOMC meeting, then target fed funds in the low 5%s could lead to 2-year notes in the low 4%s and 10-year notes in the low 3%s. That gets the 2s10s inversion toward -100 bp.
The range for implied rate volatility drops in half
The extraordinary rate volatility this year reflects similar uncertainty about economic outcomes ranging from headline to core inflation, GDP and beyond. The global economy coming out of pandemic and complicated by the Russia-Ukraine war simply has become more difficult to predict, leaving the market highly sensitive to any piece of news. The dispersion in CPI forecasts by economists surveyed by the Philadelphia Fed, for example, are at levels associated with past episodes of high volatility (Exhibit 2).
Exhibit 2: CPI and other key parts of the economy have become hard to predict
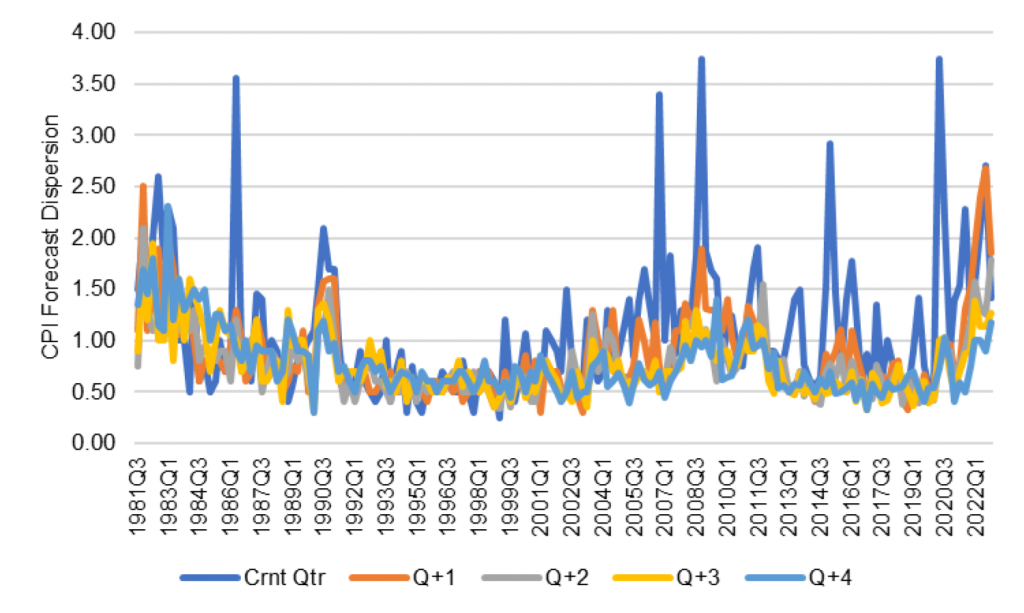
Source: Survey of Professional Forecasters, Phila. Fed, Amherst Pierpont Securities
Fundamental uncertainty has driven up market volatility, but the market gets something important next year: a lot more information about the cumulative impact of policy on inflation. Although volatility could stay high in early 2023 absent a clear inflation trend, by mid-2023 the impact of more than a year and nearly 500 bp of tightening should be clear along with the likely course of CPI, GDP and the Fed. Realized and implied volatility should reflect it, and vol should drop from recent levels of between 120 and 160 back to a range between 40 and 80 (Exhibit 3).
Exhibit 3: A clearer path for inflation and the Fed next year should reduce vol
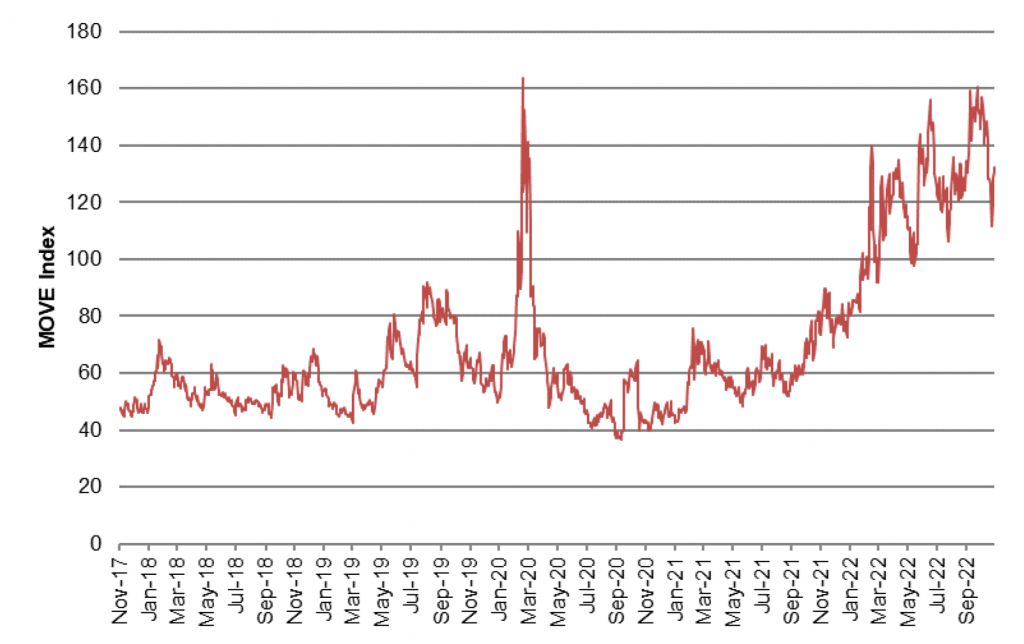
Source: Bloomberg, Amherst Pierpont Securities
Home price appreciation from December-to-December stays positive
Headlines and conversations with investors suggest many expect nominal home prices to fall 10% or more in the next year. But the market in residential real estate is largely a market for price targeting rather than price discovery. Sellers can stay in the property, take it off the market or rent it until a buyer comes along willing to hit the nominal target. Only if sellers can no longer afford to stay does the transaction turn into price discovery. And sellers historically lose their ability to stay under only a narrow range of circumstances: holding an adjustable-rate mortgage as interest rates rise, losing a job or a combination of the two. When those things started happening in 2006, after an influx of novel ARMs and at the end of a Fed tightening cycle, home prices started declining. And falling prices then stopped an important set of individual real estate investors from refinancing increasingly expensive debt. By late 2008, according to the National Association of Realtors, distressed sales made up nearly half of all residential real estate transactions (Exhibit 4).
Exhibit 4: Distressed sales played a big part in falling home prices after the GFC
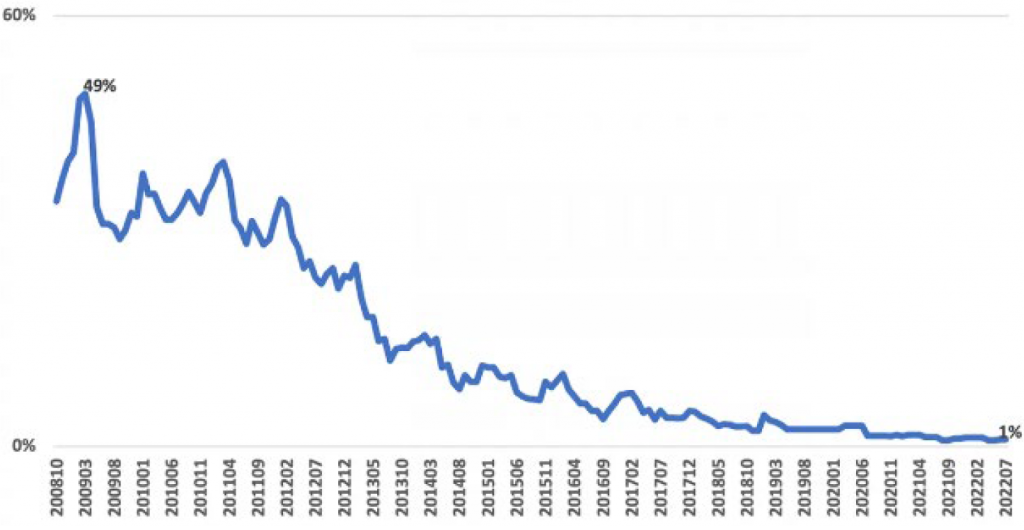
Note: Data shows NAR index of distressed home sales (foreclosures and short-sales) as a share of total.
Source: NAR.
Today, ARMs are a small part of US mortgage finance, and most homeowners have debt at rates well below the current market. Homeowners have every incentive to wait rather than sell at a loss and take on more expensive debt to buy a new home. And excess household savings totaling in the trillions give households the wherewithal to keep waiting even if rising unemployment over the next few years cuts into household income.
The leveraged loan and CLO markets surf a wave of downgrades
The leveraged loan and CLO markets face some big challenges in the year ahead, although most investors argue their particular deals will avoid the worst. That might be statistically impossible. A rising cost of funds and slowing growth promise to make highly leveraged balance sheets hard to manage. And exposure to highly leveraged ‘B-‘ balance sheets—now approaching 25% of outstanding leveraged loans and 30% of CLO loan portfolios—has never been higher (Exhibit 5).
Exhibit 5: Loan market exposure to ‘B-‘ issuers is at a record
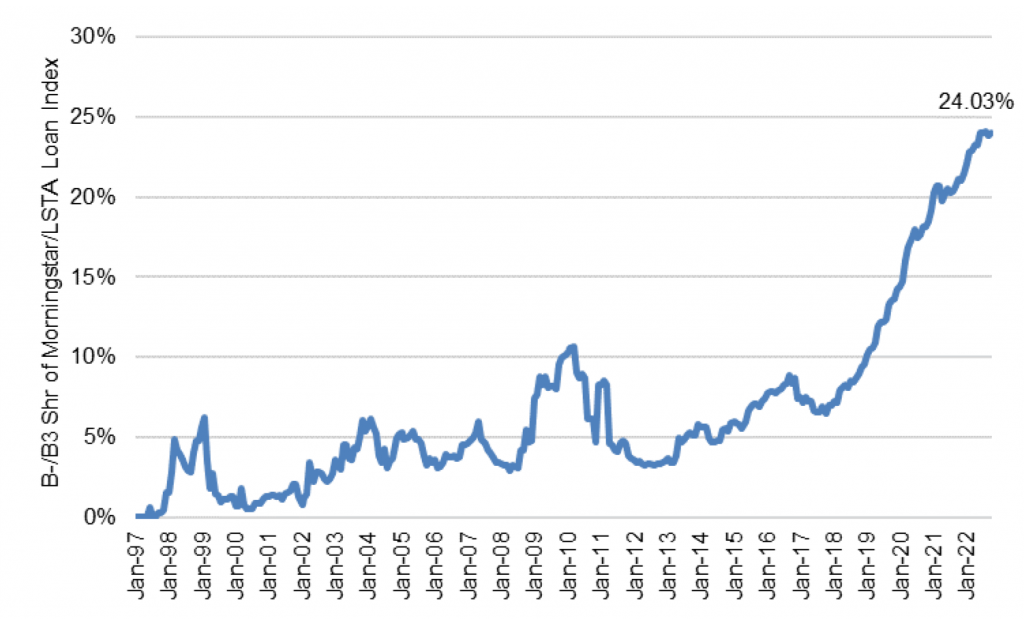
Source: PitchBook LCD, Amherst Pierpont Securities
‘B-‘ loans, not surprisingly, have a record of regular downgrades during normal economies and heavy downgrades during recession. Looking at ‘B-‘ loans outstanding at the beginning of each year from 2001 through 2021, S&P found the median probability of downgrade over the next year to be 18% (Exhibit 6). In the 2001 recession, that hit 49%. In 2009, 44%. And in 2020, 34%
Exhibit 6: ‘B-‘ loans regularly get downgraded with the pace rising in recession
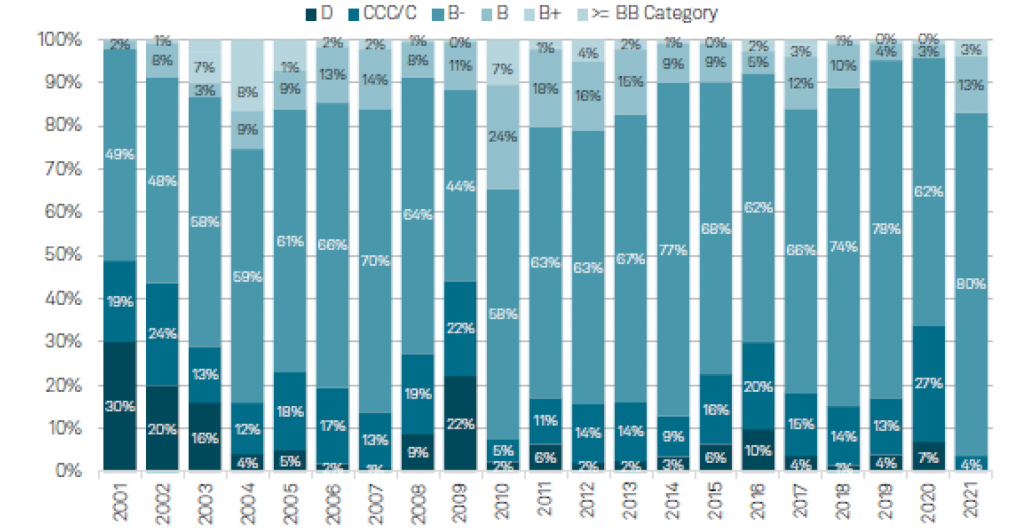
Note: Data as of December 2021. Reflects a static portfolio and 1-year rating transitions. Excludes financial and insurance services.
Source: S&P Global Ratings CreditPro.
For CLO managers, a pace of ‘B-‘ downgrades beyond the median annual 18% found by S&P would push many deals beyond the typical limits on ‘CCC’ or lower rated loans and begin to put some important collateral performance tests at risk. CLO managers may find it impossible to avoid ‘B-‘ downgrades altogether. And this structural exposure in CLOs to loan downgrades may leave the sector in aggregate struggling to keep up with other assets in 2023.
The Fed does not sell MBS
Once the Fed included the possibility of selling MBS in its toolkit for QT, a surprising number of investors seemed convinced it would happen sooner rather than later. But nearly six months into QT, the Fed has sold no MBS. And the MBS share of the SOMA portfolio has crept up to nearly a third, higher than the start of QT (Exhibit 7).
Exhibit 7: MBS share of the Fed portfolios continues to slowly rise
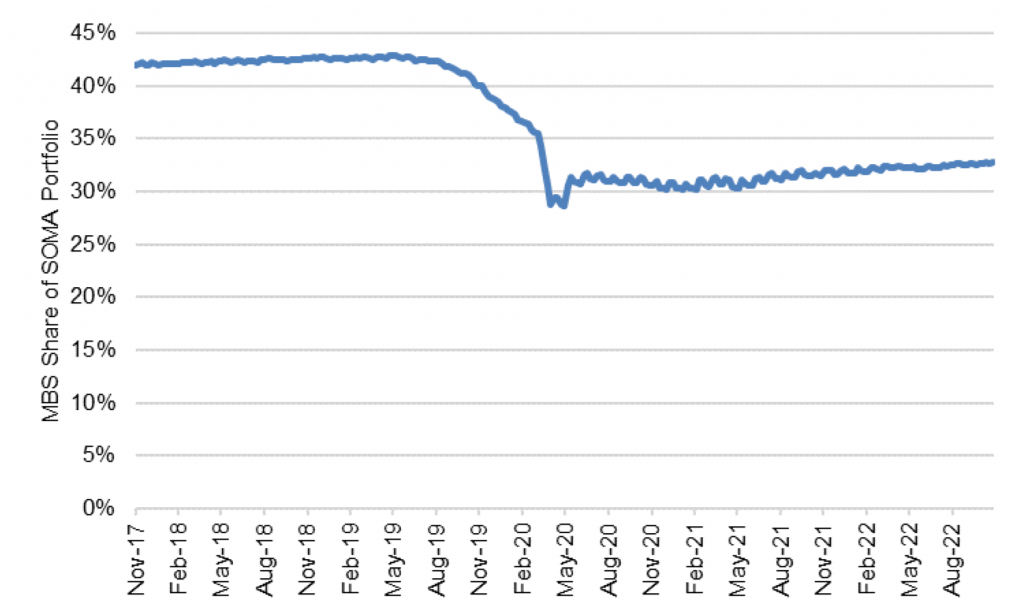
Source: Bloomberg, Amherst Pierpont Securities
The Fed is clearly willing to tolerate a slow rise in MBS exposure while it fights inflation with its strongest and most traditional tools. The Fed has never sold MBS in its history with QT, and that makes it an untested lever of policy. Even if the Fed wanted to pull this lever before getting inflation under control, it would likely take time to explore the best way to do it—whether to sell individual coupons or baskets of MBS or take some other approach. And then it would likely announce its approach well in advance of executing. Even assuming the Fed get inflation under control by mid-2023 and begins planning MBS sales, the first sale looks unlikely before sometime in 2024.