The Big Idea
Here’s the one thing you need to understand CLO loan risk
This material is a Marketing Communication and does not constitute Independent Investment Research.
When it comes to the risk a CLO manager takes in a loan portfolio, the market is awash in numbers. Weighted average spread, rating, price, liquidity, loan size, the count of ‘CCC’ and defaulted loans, the issuer and industry concentrations, the manager’s trading strategy and the list goes on. It is hard to compare all these numbers across portfolios. It is harder to do the job even within a single portfolio across time. But if investors had to pick only a single number for measuring loan portfolio risk, there is a simple and compelling solution.
Investors in many other asset classes—equities, fixed income, alternative assets and beyond—routinely measure portfolio risk by comparing it to risk in a broad reference market. In the case of a portfolio of leveraged loans, the natural reference market is the broad market in leveraged loans. The S&P/LSTA Leveraged Loan Index is the natural candidate. And the single, summary measure of risk is the portfolio beta.
Beta captures the volatility of returns relative to a broad market index. A portfolio that matches index returns—posting a 1% gain on average when the index posts a 1% gain and posting a 1% loss when the index posts a 1% loss—would have a beta of 1.0. A portfolio with twice the volatility—posting a 2% gain when the index posts a 1% gain and posting a 2% loss when the index posts a 1% loss—would have a beta of 2.0. A portfolio with half the volatility would have a beta of 0.5. And since the beta uses the full return history of the portfolio, it reflects the amount of risk not just in one period but over the life of the deal.
The average CLO portfolio through July showed an average beta of 1.03 and ranged between 0.90 and 1.25 (Exhibit 1). In other words, the average portfolio rises and falls at 103% of the magnitude of the broad market, while some portfolios rock back and forth at only 90% and others rocket back and forth at up to 125%.
Exhibit 1: CLO portfolio beta averages 1.03 but ranges from 0.90 to 1.25
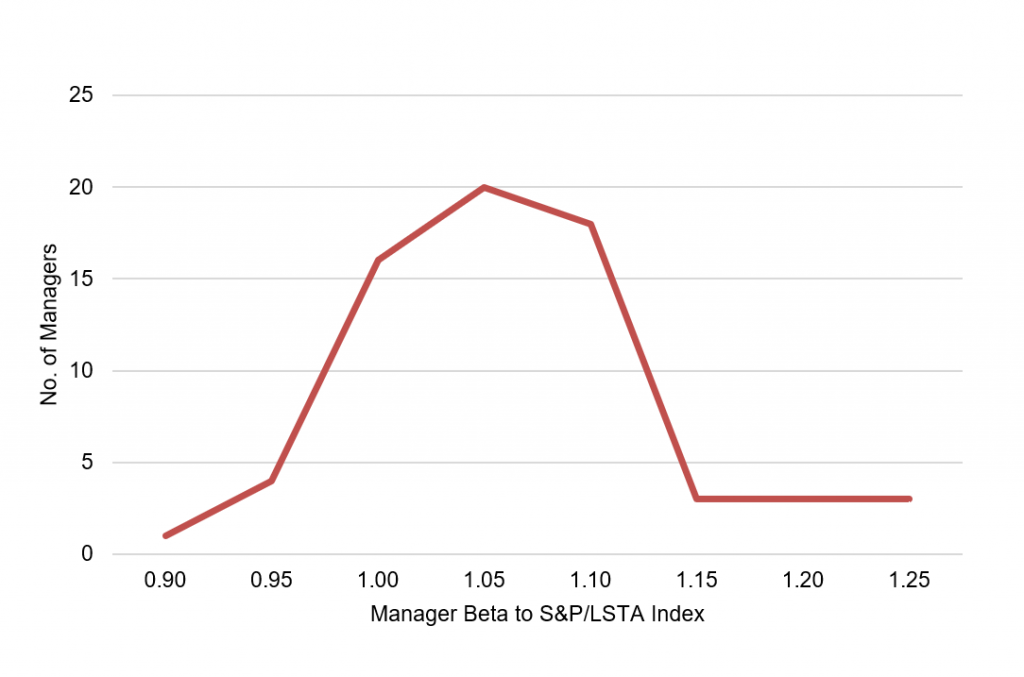
Source: Amherst Pierpont Securities
To see why beta can capture much of the blizzard of numbers that surround portfolio comparisons, it helps to calculate beta for a series of portfolios with clearly different levels of risk. An exercise of this sort could include portfolios with credit quality that falls clearly from high to low. For example:
- Only ‘BB’ loans, among the highest credit quality in the market
- Only the 100 largest loans, among the most liquid
- Middle market loans, among the least liquid
- Only ‘B’ loans, lower in credit quality
- Only second lien loans, lower still in credit quality
- Only ‘CCC’ loans, among the lowest in credit quality
As credit quality falls and risk rises, beta should rise, too. After all, the price of leveraged loans largely reflects the changing views of credit embedded in spreads. In bullish markets, weaker credits should rise faster than average. In bearish markets, weaker credit should fall faster. Liquidity, a separate risk, is more complex. Illiquid assets trade infrequently, and their observed price tends to change less frequently. That typically reduces the beta of illiquid assets
Taking each portfolio of the type outlined and calculating beta against the S&P/LSTA Leveraged Loan Total Return Index recovers an intuitive ordering of risk (Exhibit 2):
- ‘BB’ loans show the lowest beta of 0.80
- The 100 largest and most liquid loans show a beta of 0.87
- Middle market loans show a beta of 0.91
- ‘B’ loans show a beta of 1.09
- Second liens show a beta of 1.27
- ‘CCC’ loans show a beta of 1.69
Exhibit 2: Separate loan portfolios show beta that align with risk
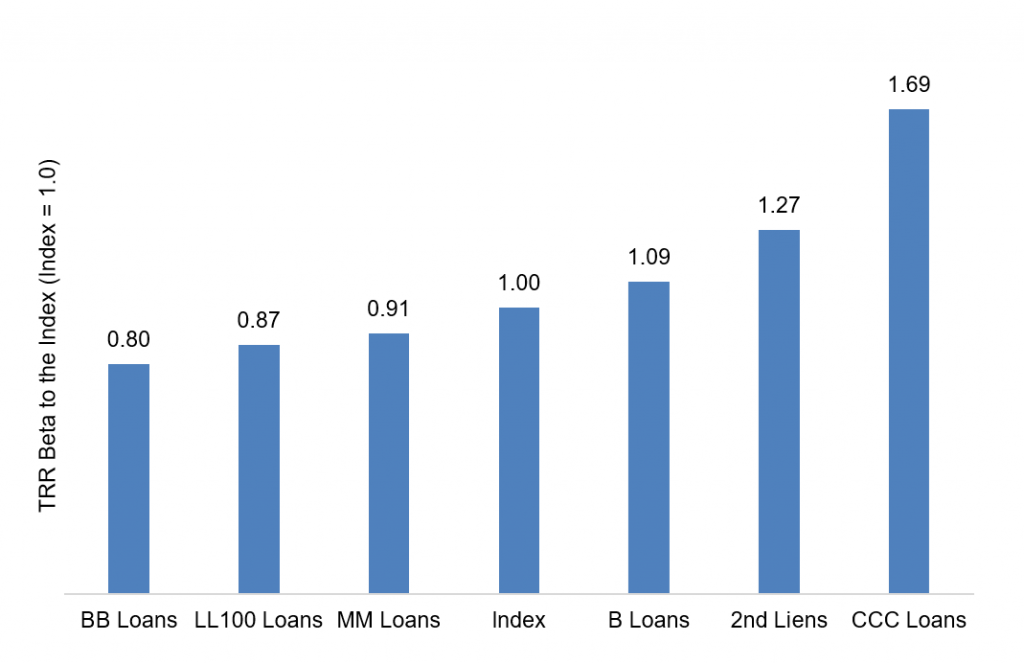
Note: Calculated based on monthly returns from January 2011 to July 2021.
Source: LCD, Amherst Pierpont Securities
Any CLO portfolio beta is simply a mix of the betas of the underlying loans, weighted by the market value of the loan exposures. A portfolio with 50% of market value in ‘BB’ and 50% ‘B’, for example, would have a beta of 50% of 0.80 and 50% of 1.09, or 0.945.
Portfolio beta neatly summarizes the risk in a portfolio relative to a broad market, and that holds even if the risk of the broad market is changing over time. The leveraged loan market over the last few years has seen average loan rating decline, for instance. If a CLO loan portfolio’s rating declined more slowly than the market, beta could drop. If it declined faster, beta could rise.
Beta has clear implications for CLO equity through its impact on NAV volatility. In a CLO with 10 points of equity and a portfolio beta of 1.0, for example, a 0.5% drop in the broad market should reduce equity NAV by half a point or 5%. In an identical structure with a portfolio beta of 2.0, however, the same drop in the broad market would reduce NAV by one point or 10%. As beta goes, so goes equity NAV. Higher beta means more NAV volatility.
Beta also has clear implications for CLO debt through its impact on equity. In any corporate structure, equity volatility affects debt spreads. The equity class can effectively turn in the keys to the company if loan value declines far enough, putting the loan portfolio to debtholders at a strike price equal to the par value of debt. The debt classes are short put options to equity. As a practical matter, this is only likely to happen in a CLO well after the end of reinvestment. But it shapes debt spreads throughout the life of the deal. All else equal, the more volatile the equity value, the wider the fair spread on debt. Equity volatility has the most impact on spreads in the most subordinate debt and decreasing impact as debt becomes more senior.
Seasoned students of CLO loan portfolios may have good intuition for much of the information that beta reflects. But for other investors rudderless in a sea of CLO statistics, beta may be the one number everyone needs to know.
This material is intended only for institutional investors and does not carry all of the independence and disclosure standards of retail debt research reports. In the preparation of this material, the author may have consulted or otherwise discussed the matters referenced herein with one or more of SCM’s trading desks, any of which may have accumulated or otherwise taken a position, long or short, in any of the financial instruments discussed in or related to this material. Further, SCM may act as a market maker or principal dealer and may have proprietary interests that differ or conflict with the recipient hereof, in connection with any financial instrument discussed in or related to this material.
This message, including any attachments or links contained herein, is subject to important disclaimers, conditions, and disclosures regarding Electronic Communications, which you can find at https://portfolio-strategy.apsec.com/sancap-disclaimers-and-disclosures.
Important Disclaimers
Copyright © 2026 Santander US Capital Markets LLC and its affiliates (“SCM”). All rights reserved. SCM is a member of FINRA and SIPC. This material is intended for limited distribution to institutions only and is not publicly available. Any unauthorized use or disclosure is prohibited.
In making this material available, SCM (i) is not providing any advice to the recipient, including, without limitation, any advice as to investment, legal, accounting, tax and financial matters, (ii) is not acting as an advisor or fiduciary in respect of the recipient, (iii) is not making any predictions or projections and (iv) intends that any recipient to which SCM has provided this material is an “institutional investor” (as defined under applicable law and regulation, including FINRA Rule 4512 and that this material will not be disseminated, in whole or part, to any third party by the recipient.
The author of this material is an economist, desk strategist or trader. In the preparation of this material, the author may have consulted or otherwise discussed the matters referenced herein with one or more of SCM’s trading desks, any of which may have accumulated or otherwise taken a position, long or short, in any of the financial instruments discussed in or related to this material. Further, SCM or any of its affiliates may act as a market maker or principal dealer and may have proprietary interests that differ or conflict with the recipient hereof, in connection with any financial instrument discussed in or related to this material.
This material (i) has been prepared for information purposes only and does not constitute a solicitation or an offer to buy or sell any securities, related investments or other financial instruments, (ii) is neither research, a “research report” as commonly understood under the securities laws and regulations promulgated thereunder nor the product of a research department, (iii) or parts thereof may have been obtained from various sources, the reliability of which has not been verified and cannot be guaranteed by SCM, (iv) should not be reproduced or disclosed to any other person, without SCM’s prior consent and (v) is not intended for distribution in any jurisdiction in which its distribution would be prohibited.
In connection with this material, SCM (i) makes no representation or warranties as to the appropriateness or reliance for use in any transaction or as to the permissibility or legality of any financial instrument in any jurisdiction, (ii) believes the information in this material to be reliable, has not independently verified such information and makes no representation, express or implied, with regard to the accuracy or completeness of such information, (iii) accepts no responsibility or liability as to any reliance placed, or investment decision made, on the basis of such information by the recipient and (iv) does not undertake, and disclaims any duty to undertake, to update or to revise the information contained in this material.
Unless otherwise stated, the views, opinions, forecasts, valuations, or estimates contained in this material are those solely of the author, as of the date of publication of this material, and are subject to change without notice. The recipient of this material should make an independent evaluation of this information and make such other investigations as the recipient considers necessary (including obtaining independent financial advice), before transacting in any financial market or instrument discussed in or related to this material.
Important disclaimers for clients in the EU and UK
This publication has been prepared by Trading Desk Strategists within the Sales and Trading functions of Santander US Capital Markets LLC (“SanCap”), the US registered broker-dealer of Santander Corporate & Investment Banking. This communication is distributed in the EEA by Banco Santander S.A., a credit institution registered in Spain and authorised and regulated by the Bank of Spain and the CNMV. Any EEA recipient of this communication that would like to affect any transaction in any security or issuer discussed herein should do so with Banco Santander S.A. or any of its affiliates (together “Santander”). This communication has been distributed in the UK by Banco Santander, S.A.’s London branch, authorised by the Bank of Spain and subject to regulatory oversight on certain matters by the Financial Conduct Authority (FCA) and the Prudential Regulation Authority (PRA).
The publication is intended for exclusive use for Professional Clients and Eligible Counterparties as defined by MiFID II and is not intended for use by retail customers or for any persons or entities in any jurisdictions or country where such distribution or use would be contrary to local law or regulation.
This material is not a product of Santander´s Research Team and does not constitute independent investment research. This is a marketing communication and may contain ¨investment recommendations¨ as defined by the Market Abuse Regulation 596/2014 ("MAR"). This publication has not been prepared in accordance with legal requirements designed to promote the independence of research and is not subject to any prohibition on dealing ahead of the dissemination of investment research. The author, date and time of the production of this publication are as indicated herein.
This publication does not constitute investment advice and may not be relied upon to form an investment decision, nor should it be construed as any offer to sell or issue or invitation to purchase, acquire or subscribe for any instruments referred herein. The publication has been prepared in good faith and based on information Santander considers reliable as of the date of publication, but Santander does not guarantee or represent, express or implied, that such information is accurate or complete. All estimates, forecasts and opinions are current as at the date of this publication and are subject to change without notice. Unless otherwise indicated, Santander does not intend to update this publication. The views and commentary in this publication may not be objective or independent of the interests of the Trading and Sales functions of Santander, who may be active participants in the markets, investments or strategies referred to herein and/or may receive compensation from investment banking and non-investment banking services from entities mentioned herein. Santander may trade as principal, make a market or hold positions in instruments (or related derivatives) and/or hold financial interest in entities discussed herein. Santander may provide market commentary or trading strategies to other clients or engage in transactions which may differ from views expressed herein. Santander may have acted upon the contents of this publication prior to you having received it.
This publication is intended for the exclusive use of the recipient and must not be reproduced, redistributed or transmitted, in whole or in part, without Santander’s consent. The recipient agrees to keep confidential at all times information contained herein.


