


Uncategorized
Game plan for the day after
admin | October 30, 2020
This material is a Marketing Communication and does not constitute Independent Investment Research.
With online markets and forecasts widely expecting the House to stay in the hands of Democrats after November 3, the debt markets look set to turn on results from races to control the Senate and the presidency. The possible combinations of Democrat and Republican have clear implications for federal spending and, consequently, for the shape of the yield curve and risk spreads. Contested elections, unless they damage the ability of parties to work together, look more likely to affect control of the Senate than the presidency and add volatility to the curve and spreads.
Capturing both Senate and presidency may be harder than it looks
Online markets and forecasting models for now give clear advantage to Democrats for control of both the presidency and the Senate. Online markets PredictIt.org and the Iowa Electronic Markets along with forecasters FiveThirtyEight and The Economist show an average probability of Democratic control of the presidency at 83% (Exhibit 1). The average probability of Democratic control of the Senate is a much lower 69%, suggesting the Senate may be the bigger obstacle to a Blue Wave. The FiveThirtyEight model of Senate control projects Democrats will hold 51.8 seats. A few races can tip the balance.
Exhibit 1: Current forecasts give an advantage to Democrats
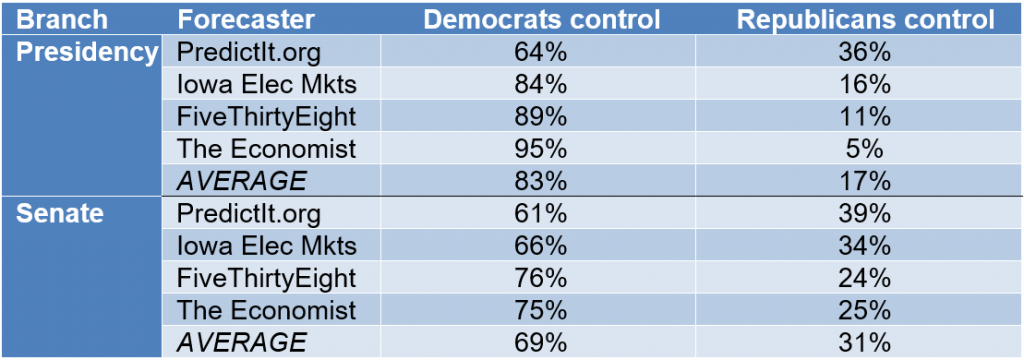
Note: all levels as of 29 Oct 2020.
Source: PredictIt.org, Iowa Electronic Markets, FiveThirtyEight, The Economist, Amherst Pierpont Securities.
Despite the separate high probabilities of Democratic control of the Senate and presidency, the online markets price the probability of a Blue Wave much lower. PredictIt.org offers a contract that pays $1 in a Blue Wave, and that contract traded on October 29 at $0.56, implying a 56% probability of that outcome. With 2.8 million shares traded, it should be a reasonable estimate.
The PredictIt.org markets for presidency, Senate and Blue Wave paint an interesting picture of election outcomes. For all the contracts to square up, the most likely outcomes include a Blue Wave at 56% and the continuation of the status quo—Republican control of the presidency and the Senate—at 31% (Exhibit 2). The odds of different parties controlling the presidency and Senate are small. The PredictIt.org market implies that winning the presidency is not independent of controlling the Senate. If you win the first, the chances of winning the second go up.
Exhibit 2: PredictIt.org contracts give highest marks to Blue Wave or Status Quo
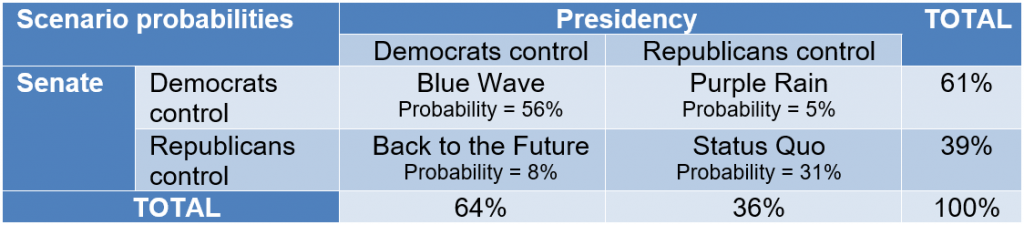
Source: PredictIt.org, Amherst Pierpont Securities.
If the races instead are independent, the chances of a Blue Wave still look similar to PredictIt.org, but the chances of other outcomes look very different. Assuming independent races and using the average chances of control across online markets and forecasts, a Blue Wave is still the most likely outcome: 83% chance of controlling the presidency × 69% chance of controlling the Senate = 57% chance of controlling both (Exhibit 3). The next most likely outcome is a Back-to-the-Future arrangement where a Democratic president faces a Republican Senate, like 2015 to 2017. The implied probability of that scenario is 26%. The probability of a Republican president facing a Democratic Senate, or Purple Rain, is 12%. And the probably of a Republican president facing a Republican Senate, or Status Quo, is 5%.
Exhibit 3: If the races for control of the presidency and Senate are independent, the most likely outcomes include a Blue Wave and Back to the Future
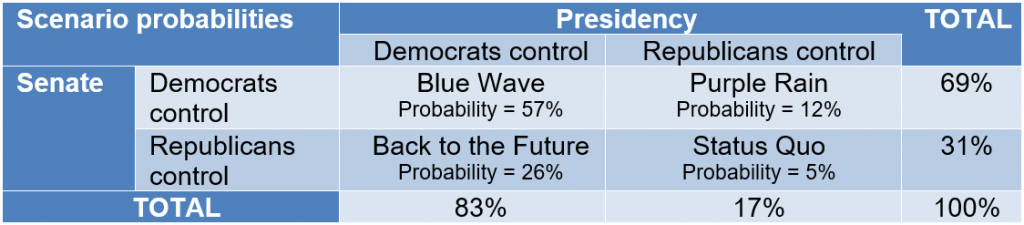
Note: probabilities of each combination of Democratic and Republican control calculated by multiplying the corresponding marginal probabilities together.
Source: Amherst Pierpont Securities.
If elections are contested, the market will almost certainly reprice to the changing possibility of a Blue Wave or one of two alternatives, either Status Quo or Back to the Future. Market volatility until definitive election results roll in consequently should reflect the back-and-forth repricing of likely fiscal stimulus in a Blue Wave or the alternative outcome and their corresponding impact on the yield curve and spreads.
Political control drives likely spending
As control of the presidency and Senate goes, so goes likely spending (Exhibit 4):
- Blue Wave. Considering both pandemic and fiscal spending, this looks like the most stimulative outcome. The House on October 1 passed a $2.2 trillion pandemic relief bill, and Joe Biden as candidate proposed a tax program in February that would generate nearly $4 trillion in federal revenue over the next 10 years, according to the Urban-Brookings Tax Policy Center, all of it presumably designed to be spent.
- Back to the Future. Mildly stimulative. The Senate GOP in July proposed a pandemic relief bill closer to $1 trillion, and Majority Leader Mitch McConnell reportedly has discouraged recent administration efforts to negotiate a larger rescue. A newly elected President Biden might look at a returning Majority Leader McConnell with a sense of déjà vu. McConnell worked against much of the Obama administration’s programs. McConnell presumably would work against a Biden agenda, too.
- Purple Rain. Moderately simulative. A re-elected President Trump may find surprising fiscal common ground with a Democratic Senate. After the House passed its $2.2 trillion pandemic relief bill, Treasury Secretary Mnuchin reportedly countered with a $1.6 trillion alternative. Free of pressures to run again, Trump might go along with much of a Democratic spending agenda.
- Status Quo. Least stimulative. Senate Republicans have resisted pandemic relief much above $1 trillion and look unlikely to embrace expensive new government programs.
Exhibit 4: Likely Covid stimulus and fiscal spending differ across outcomes
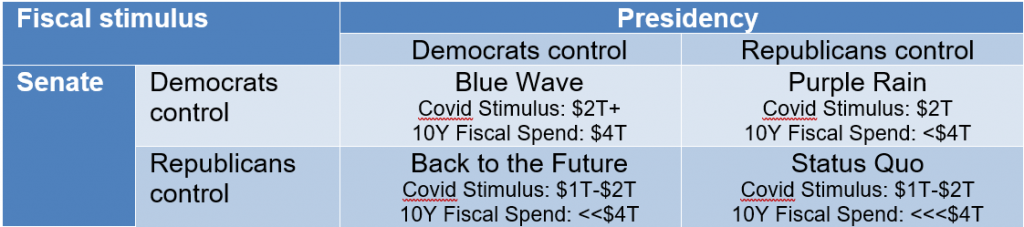
Source: Amherst Pierpont Securities
The market responds relative to what is already priced
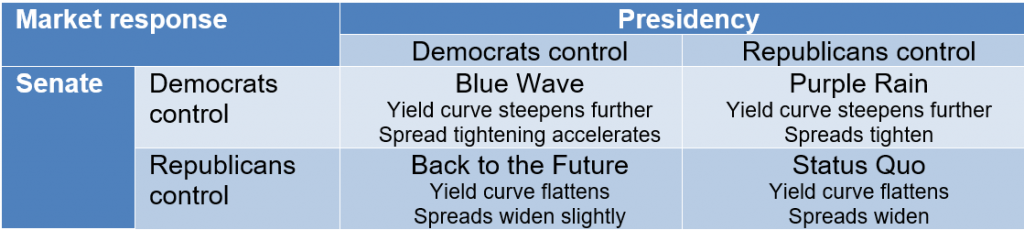
The market has steadily priced toward a Blue Wave starting in late September, so final election results should move the yield curve and spreads relative to that expectation (Exhibit 5).
- Blue Wave. With the Fed’s new flexible average inflation targeting in the background and prospects for a broadly distributed Covid-19 vaccine or treatment over the next few years, Blue Wave raises inflation risk, steepens the curve and tightens credit spreads beyond current levels.
- Back to the Future. This outcome would surprise the market, leading the curve to flatten and spreads to widen slightly. With Fed QE in the background, widening should be limited.
- Purple Rain. This outcome would surprise the market, too, but investors would likely see the prospects for significant stimulus, steepening the curve and tightening spreads beyond current levels.
- Status Quo. A surprise, again, and the market would have to reprice expectations for stimulus significantly, flattening the curve and widening spreads.
Exhibit 5: Market moves from current levels depends on the election outcomes
Source: Amherst Pierpont Securities
The impact of a contested election
Except for scenarios where a contested election leaves parties unable to work together, the process of counting and recounting ballots and litigating outcomes in court only extends the transition from pre- to post-election. The final result is almost certain to fall in one of four camps. Each camp has distinct implications for spending and market response. Market volatility should depend only on the shifting probability of ending up in one camp rather than another. If prospects for a Blue Wave or Status Quo or Back to the Future flip back and forth, for example, the yield curve could bounce between bear steepening and bull flattening with spreads tightening or widening in concert.
Hedging and investing along the way
Portfolios that might need liquidity during a contested election or that could get damaged by mark-to-market exposure or by margin calls could hedge in a few ways. Those include, among others:
- Buying short-dated puts and calls on the slope of the yield curve to profit from increased realized and implied volatility
- Putting on a conditional bull flattening position—selling calls on the 2-year and buying calls on the 10-year duration- or proceeds-neutral—to offset widening in portfolio risk assets
- Buying short-dated puts on the S&P 500 to offset widening in portfolio risk assets, or using put spreads to lower the cost of the hedge
- Buying calls on the VIX or using call spreads
- Shorting HY or IG CDX or possibly CMBX
For investors able to hold assets through volatile markets, wider spreads are likely to mark a buying opportunity. In a Blue Wave, spreads should begin to tighten shortly after the dust settles. In Back to the Future, spreads may soften, but Fed QE is still sitting in the background with clear potential to retighten spreads over time. Status Quo could widen spreads the most if prospects for stimulus reprice well below current expectations. Still, the Fed is there as a backstop.
* * *
The view in rates
The latest steepening in the yield curve is more about expectations for real growth than for inflation. Real 10-year rates rose 10 bp in the last five sessions to -83 bp while breakeven inflation declined by 2.5 bp to 171 bp. That is a change from recent months where real 10-year rates stayed close to -100 bp. The sharp steeping in the yield curve in had arguably reflected rising sensitivity to inflation risk. The 2s10s curve has moved to 72 bp and the 5s30s to 127 bp, both near the steep end of their range this year. QE, the Fed’s flexible average inflation targeting and possible fiscal stimulus are all helping. The next tilt in the yield curve will likely depend on US election results. Ahead of the election, implied rate volatility has stepped up, reflecting uncertainty about results and prospects for contested elections (Exhibit 6).
Exhibit 6: Implied rate volatility has jumped higher ahead of elections
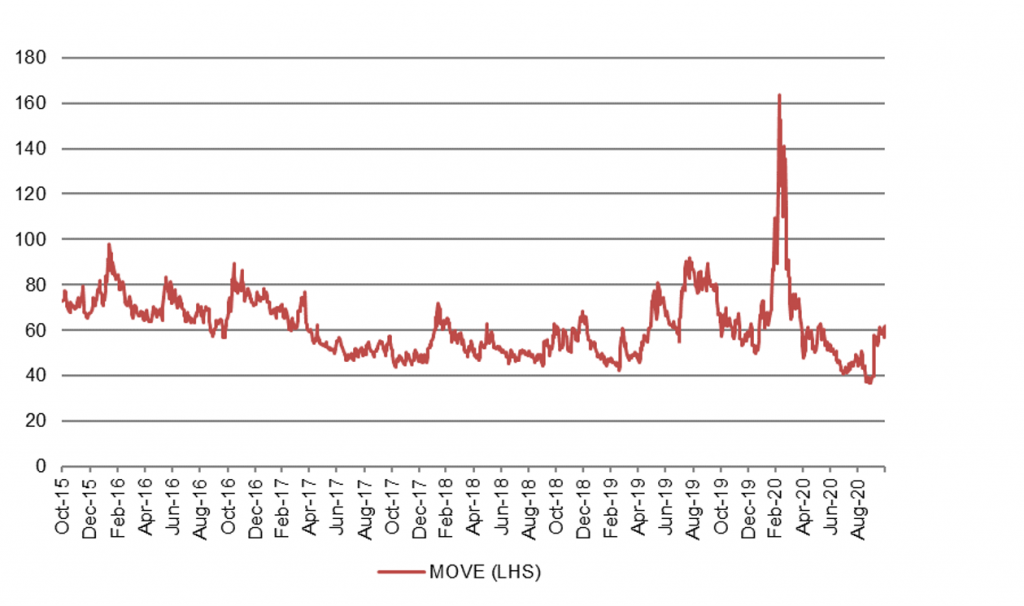
Source: Bloomberg, Amherst Pierpont Securities
The view in spreads
Spreads also should depend on election results and the time it takes to finalize them. Once finalized, prospects for tighter spreads look good. Risk assets should still remain caught between Fed buying on one hand and heavy net supply of Treasury debt on the other. There is still fundamental risk in the most leveraged corporate balance sheets with corporate leverage going up through 2020, but a market awash in liquidity is giving even those balance sheets some relieve. Expected inflation could further help valuation of leveraged balance sheets and households by holding out prospects of repaying nominal debt with inflated net revenues or household income.
The view in credit
Fundamental credit remains as uncertain as the economy, although the uncertainty of mid-summer has abated. Many investment grade companies have stockpiled enough cash to survive protracted slow growth, but highly leveraged companies and consumers are at risk. High yield and leveraged loans have nevertheless done well. But the hard part is about to start as winter approaches, some of the outdoor activity that sustained bits of the economy starts to go away and Covid cases rise.