Uncategorized
Ginnie Mae speed fears weigh on price spreads
admin | February 21, 2020
This material is a Marketing Communication and does not constitute Independent Investment Research.
Price spreads between Ginnie Mae II TBA and the UMBS TBA remain very low as investors continue to worry about rising prepayment speeds in Ginnie Mae MBS. The lower coupons—2.5%s, 3.0%s, and 3.5%s—show the biggest impact since they include a massive number of loans in-the-money to refinance and about to become eligible for FHA and VA streamline refinance programs. These coupons look undervalued compared to both the same-coupon UMBS pool and to the higher coupon Ginnie Mae MBS.
Priced low relative to conventional MBS
The three lower Ginnie Mae II coupons—2.5%, 3.0%, and 3.5%—are priced at, or very close to, the low points of the last year (Exhibit 1). Ginnie Mae pools in these coupons are more negatively convex than conventional pools, and investors have priced in expectations of faster speeds as interest rates have fallen. The MBA refinance index supports this observation. Last week the government index increased while the conventional index dropped. The largest speed increase should come in March (April report).
Exhibit 1: Lower coupon G2SF price spreads to UMBS remain near 1 year lows.
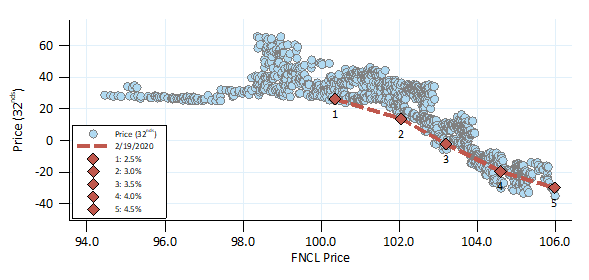
Data runs from February 20, 2019 through February 19, 2020. Price spread is G2SF minus FNCL. Source: Fannie Mae, Freddie Mac, eMBS, Amherst Pierpont Securities
The G2SF-to-FNCL price spread for the 3.0% coupon has fallen 27/32s since the beginning of the year and is currently 13/32s below the average value of the swap when the FNCL is priced near $102-00. Buying a 1 WALA Ginnie Mae 3.0% multi-issuer pool is one way to take advantage of this under performance, since FHA and VA loans provide very strong prepayment protection until they reach six or seven months of seasoning. This should provide prepayment protection as speeds increase over the coming months. The pay-up for the 3.0% multi-issuer pool is currently only 3.5/32s, and could be recovered quickly if the price spread returns to typical levels.
Investors that can buy custom pools have options to further enhance prepayment protection. One example would be to purchase a 3.0% 1 WALA 0% VA pool, since VA loans are far more negatively convex than FHA loans.
Lower coupon Ginnie Mae TBAs look the least expensive
Lower coupon Ginnie Mae II TBAs look inexpensive compared to UMBS TBAs, and also look inexpensive compared to higher coupon Ginnie Mae TBAs (Exhibit 2).
Exhibit 2: Ginnie Mae 3.0%s and 3.5%s appear to be the cheapest part of the stack
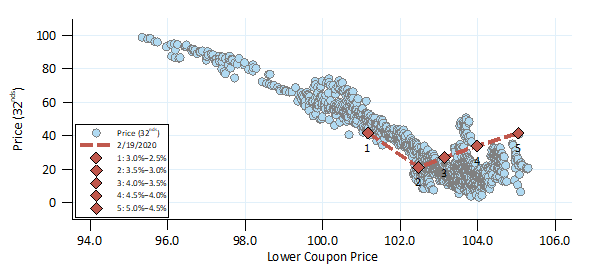
Data runs from February 20, 2019 through February 19, 2020. Price spread is between two G2SF TBA contracts. Source: Fannie Mae, Freddie Mac, eMBS, Amherst Pierpont Securities
The three higher coupon swaps—5.0%−4.5%, 4.5%−4.0%, and 4.0%−3.5%—all appear priced close to the high points of the last year. The 3.5%−3.0% swap looks fairly priced, while the 3.0%−2.5% swap is at the low end of the range. This suggests that 3.0%s and 3.5%s are both priced below typical levels, while the rest of the coupon stack looks rich.
Higher coupon Ginnie Mae pools have better convexity
Higher coupon Ginnie Mae TBA have better convexity than lower coupons, which is likely why the higher coupons look fairly priced compared to conventionals. Better convexity was evident in the January prepayment report, which was slower overall but had huge pickups in some Ginnie Mae cohorts. For example, Ginnie Mae 3.5%s issued in 2019 increased 56.7% overall in January, while the 4.5%s from 2019 slowed 4.9%.
Most loans in higher coupon Ginnie Mae pools have been refinanceable for a number of months. These loans have accumulated some burnout and are moving past the peak of the seasoning ramp. They are also deep in-the-money, so less sensitive to lower interest rates. All of that contributes to a better convexity profile. There are some low WALA loans in these coupons but they were originated with much higher spreads at origination (SATO), which is a measure of the credit risk of a borrower. Higher SATO indicates worse credit, since these borrowers were likely charged a higher rate to compensate the lender for the higher credit risk. High SATO loans typically have better convexity than low SATO loans, which also contributes to the better the convexity of higher coupon Ginnie TBAs.
All of the advantages in higher coupon TBA do not benefit lower coupons—there are many loans about to become eligible for streamlined refinancing and these loans were originated at low SATOs. The low seasoning means there isn’t any burnout. Therefore those TBA should exhibit much worse convexity than higher coupons.
But VA convexity should be worse in 2020
One word of caution is that the 2020 multi pools look likely to contain somewhat worse collateral than the 2019 pools. FHA and conventional loan limits increased in 2020, but VA loan limits went away completely at the start of the year. This was due to legislation passed by Congress last summer. This means that VA average loan sizes should increase more than FHA and conventional and that the Ginnie Mae multi pools remain exposed to the occasional extremely large VA loan. For example, a $3.3 million 100% LTV purchase loan is being placed in the February 2.5% 30-year multi pool (G2 MA6473) by Caliber.
VA loan deliveries into the multi pool are still subject to the 10% de minimis limit, so an increase in VA loan sizes must be offset by fewer loans being pooled. This should mitigate some, but not all, of the negative effect of removing VA loan limits.
This material is intended only for institutional investors and does not carry all of the independence and disclosure standards of retail debt research reports. In the preparation of this material, the author may have consulted or otherwise discussed the matters referenced herein with one or more of SCM’s trading desks, any of which may have accumulated or otherwise taken a position, long or short, in any of the financial instruments discussed in or related to this material. Further, SCM may act as a market maker or principal dealer and may have proprietary interests that differ or conflict with the recipient hereof, in connection with any financial instrument discussed in or related to this material.
This message, including any attachments or links contained herein, is subject to important disclaimers, conditions, and disclosures regarding Electronic Communications, which you can find at https://portfolio-strategy.apsec.com/sancap-disclaimers-and-disclosures.
Important Disclaimers
Copyright © 2026 Santander US Capital Markets LLC and its affiliates (“SCM”). All rights reserved. SCM is a member of FINRA and SIPC. This material is intended for limited distribution to institutions only and is not publicly available. Any unauthorized use or disclosure is prohibited.
In making this material available, SCM (i) is not providing any advice to the recipient, including, without limitation, any advice as to investment, legal, accounting, tax and financial matters, (ii) is not acting as an advisor or fiduciary in respect of the recipient, (iii) is not making any predictions or projections and (iv) intends that any recipient to which SCM has provided this material is an “institutional investor” (as defined under applicable law and regulation, including FINRA Rule 4512 and that this material will not be disseminated, in whole or part, to any third party by the recipient.
The author of this material is an economist, desk strategist or trader. In the preparation of this material, the author may have consulted or otherwise discussed the matters referenced herein with one or more of SCM’s trading desks, any of which may have accumulated or otherwise taken a position, long or short, in any of the financial instruments discussed in or related to this material. Further, SCM or any of its affiliates may act as a market maker or principal dealer and may have proprietary interests that differ or conflict with the recipient hereof, in connection with any financial instrument discussed in or related to this material.
This material (i) has been prepared for information purposes only and does not constitute a solicitation or an offer to buy or sell any securities, related investments or other financial instruments, (ii) is neither research, a “research report” as commonly understood under the securities laws and regulations promulgated thereunder nor the product of a research department, (iii) or parts thereof may have been obtained from various sources, the reliability of which has not been verified and cannot be guaranteed by SCM, (iv) should not be reproduced or disclosed to any other person, without SCM’s prior consent and (v) is not intended for distribution in any jurisdiction in which its distribution would be prohibited.
In connection with this material, SCM (i) makes no representation or warranties as to the appropriateness or reliance for use in any transaction or as to the permissibility or legality of any financial instrument in any jurisdiction, (ii) believes the information in this material to be reliable, has not independently verified such information and makes no representation, express or implied, with regard to the accuracy or completeness of such information, (iii) accepts no responsibility or liability as to any reliance placed, or investment decision made, on the basis of such information by the recipient and (iv) does not undertake, and disclaims any duty to undertake, to update or to revise the information contained in this material.
Unless otherwise stated, the views, opinions, forecasts, valuations, or estimates contained in this material are those solely of the author, as of the date of publication of this material, and are subject to change without notice. The recipient of this material should make an independent evaluation of this information and make such other investigations as the recipient considers necessary (including obtaining independent financial advice), before transacting in any financial market or instrument discussed in or related to this material.
Important disclaimers for clients in the EU and UK
This publication has been prepared by Trading Desk Strategists within the Sales and Trading functions of Santander US Capital Markets LLC (“SanCap”), the US registered broker-dealer of Santander Corporate & Investment Banking. This communication is distributed in the EEA by Banco Santander S.A., a credit institution registered in Spain and authorised and regulated by the Bank of Spain and the CNMV. Any EEA recipient of this communication that would like to affect any transaction in any security or issuer discussed herein should do so with Banco Santander S.A. or any of its affiliates (together “Santander”). This communication has been distributed in the UK by Banco Santander, S.A.’s London branch, authorised by the Bank of Spain and subject to regulatory oversight on certain matters by the Financial Conduct Authority (FCA) and the Prudential Regulation Authority (PRA).
The publication is intended for exclusive use for Professional Clients and Eligible Counterparties as defined by MiFID II and is not intended for use by retail customers or for any persons or entities in any jurisdictions or country where such distribution or use would be contrary to local law or regulation.
This material is not a product of Santander´s Research Team and does not constitute independent investment research. This is a marketing communication and may contain ¨investment recommendations¨ as defined by the Market Abuse Regulation 596/2014 ("MAR"). This publication has not been prepared in accordance with legal requirements designed to promote the independence of research and is not subject to any prohibition on dealing ahead of the dissemination of investment research. The author, date and time of the production of this publication are as indicated herein.
This publication does not constitute investment advice and may not be relied upon to form an investment decision, nor should it be construed as any offer to sell or issue or invitation to purchase, acquire or subscribe for any instruments referred herein. The publication has been prepared in good faith and based on information Santander considers reliable as of the date of publication, but Santander does not guarantee or represent, express or implied, that such information is accurate or complete. All estimates, forecasts and opinions are current as at the date of this publication and are subject to change without notice. Unless otherwise indicated, Santander does not intend to update this publication. The views and commentary in this publication may not be objective or independent of the interests of the Trading and Sales functions of Santander, who may be active participants in the markets, investments or strategies referred to herein and/or may receive compensation from investment banking and non-investment banking services from entities mentioned herein. Santander may trade as principal, make a market or hold positions in instruments (or related derivatives) and/or hold financial interest in entities discussed herein. Santander may provide market commentary or trading strategies to other clients or engage in transactions which may differ from views expressed herein. Santander may have acted upon the contents of this publication prior to you having received it.
This publication is intended for the exclusive use of the recipient and must not be reproduced, redistributed or transmitted, in whole or in part, without Santander’s consent. The recipient agrees to keep confidential at all times information contained herein.


