Uncategorized
Gaining from a higher diversity score, but only up to a point
admin | September 27, 2019
This material is a Marketing Communication and does not constitute Independent Investment Research.
Many CLOs investors rely on Moody’s diversity score to evaluate the stability of returns in the underlying portfolio of leveraged loans. Stability does not rise linearly with diversity score, however. It is a game of diminishing returns. A simple analysis suggests the expected stability of portfolio returns does not improve materially beyond a diversity score of 75.
Extracting stability signals from portfolios with varying diversity scores
Stability in returns should rise with more diversification. At least that is the prediction of portfolio theory if each new asset has a correlation with existing assets of less than 1.0. If one asset in the same portfolio performs poorly, other assets may perform better in the same period. And if one asset outperforms others, its higher return will be diluted on a portfolio level. In either case, allocating capital across multiple assets allows the portfolio’s returns to be less volatile.
Moody’s diversity score for CLOs is based on the issuers and industries associated with the underlying loans. Moody’s starts by calculating the average par amount per issuer in a CLO portfolio. It then finds the ratio between every issuer’s par amount and the average par amount. This ratio is capped at 1 and is known as the unit score. Issuers’ unit scores in the same industry are summed up as each industry’s aggregate unit score. These aggregate unit scores are subsequently mapped according to Moody’s table into industry diversity scores, with the maximum industry diversity score usually around 5.0. The CLO’s diversity score is the sum of its industry diversity scores. Since Moody’s splits the world into 33 industries, the maximum diversity score is 165.
Gauging stability of returns and certainty about the stability over different diversity scores
Exhibit 1 shows the average annualized volatility for portfolios with different diversity scores. The benefit of having more industries, or a higher diversity score, is more pronounced when the portfolio starts with fewer industries. Average volatility for portfolios with 1 industry decreases by 60 basis points when 4 more industries are added. Meanwhile, average volatility for portfolios with 20 industries drops by only 4 basis points when 5 more industries are added. The drop in volatility – or gain in stability – is much higher for portfolios with a lower diversity score. After a portfolio has about 15 industries, adding more industries makes minimal impact on the stability of the portfolio.
Exhibit 1: Average annual volatility decreases faster for portfolios with lower diversity scores
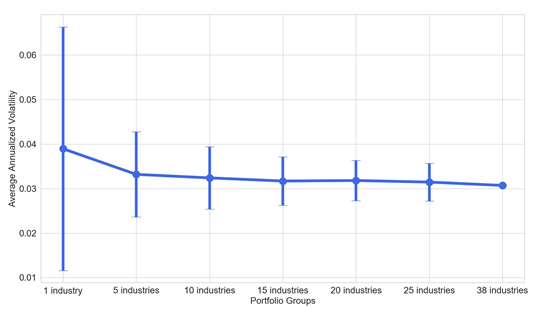
Note: The S&P LLI dataset contains monthly returns for a total of 38 industries from September 2008 to August 2019. Only returns between August 2014 and August 2019 are included in this analysis. The 38 industries in the dataset are not identical but very similar to the 33 industries listed in Moody’s diversity score methodology. Starting with 1-industry portfolios, this analysis drew 1 industry out of the 38 possible industries. It then pulled the LLI monthly returns for that industry as the portfolio’s monthly returns. (If the portfolio contained more industries, its returns were averaged across its industry returns.) Repeating this process 1,000 times gives 1,000 series of portfolio returns. An annualized volatility was calculated on each of the series. The mean and standard deviation for the annualized volatility of all series was recorded above. This procedure was then repeated for portfolios with 5, 10, 15, 20, and 25 industries. For the portfolio with 38 industries, as it was the “market” portfolio, its mean annualized volatility was the volatility for returns averaged across all industries, with no uncertainty. Sources: S&P LSTA Leveraged Loans Index (LLI), Amherst Pierpont Securities.
These estimates for average volatility are better seen in light of the certainty around them. This certainty is measured by the size of the vertical bars (Exhibit 1) indicating a standard deviation above and below the average volatility. If there is more certainty about the expected volatility of portfolios, then the vertical bar is shorter, since the actual volatility could fall into a narrower range. For portfolios with 1 industry, there is a 68% chance that the annualized volatility could fall anywhere between 1.2% and 6.8%. Then for portfolios with 15 industries, annualized volatility could take values between 2.7% and 3.7%. The dispersion around the average volatility decreases as diversity score increases, suggesting a rising level of confidence in the estimated stability.
Moody’s lens at diversification is useful among others
Moody’s method for scoring diversification encourages CLO managers to allocate their assets across more industries, especially if their portfolios are concentrated in very few industries. This method helps managers improve the stability in returns of their portfolios and get more comfortable with the estimated stability. After a portfolio’s diversity score reaches 75, the marginal increase in stability of returns and confidence about that stability is very small.
This material is intended only for institutional investors and does not carry all of the independence and disclosure standards of retail debt research reports. In the preparation of this material, the author may have consulted or otherwise discussed the matters referenced herein with one or more of SCM’s trading desks, any of which may have accumulated or otherwise taken a position, long or short, in any of the financial instruments discussed in or related to this material. Further, SCM may act as a market maker or principal dealer and may have proprietary interests that differ or conflict with the recipient hereof, in connection with any financial instrument discussed in or related to this material.
This message, including any attachments or links contained herein, is subject to important disclaimers, conditions, and disclosures regarding Electronic Communications, which you can find at https://portfolio-strategy.apsec.com/sancap-disclaimers-and-disclosures.
Important Disclaimers
Copyright © 2026 Santander US Capital Markets LLC and its affiliates (“SCM”). All rights reserved. SCM is a member of FINRA and SIPC. This material is intended for limited distribution to institutions only and is not publicly available. Any unauthorized use or disclosure is prohibited.
In making this material available, SCM (i) is not providing any advice to the recipient, including, without limitation, any advice as to investment, legal, accounting, tax and financial matters, (ii) is not acting as an advisor or fiduciary in respect of the recipient, (iii) is not making any predictions or projections and (iv) intends that any recipient to which SCM has provided this material is an “institutional investor” (as defined under applicable law and regulation, including FINRA Rule 4512 and that this material will not be disseminated, in whole or part, to any third party by the recipient.
The author of this material is an economist, desk strategist or trader. In the preparation of this material, the author may have consulted or otherwise discussed the matters referenced herein with one or more of SCM’s trading desks, any of which may have accumulated or otherwise taken a position, long or short, in any of the financial instruments discussed in or related to this material. Further, SCM or any of its affiliates may act as a market maker or principal dealer and may have proprietary interests that differ or conflict with the recipient hereof, in connection with any financial instrument discussed in or related to this material.
This material (i) has been prepared for information purposes only and does not constitute a solicitation or an offer to buy or sell any securities, related investments or other financial instruments, (ii) is neither research, a “research report” as commonly understood under the securities laws and regulations promulgated thereunder nor the product of a research department, (iii) or parts thereof may have been obtained from various sources, the reliability of which has not been verified and cannot be guaranteed by SCM, (iv) should not be reproduced or disclosed to any other person, without SCM’s prior consent and (v) is not intended for distribution in any jurisdiction in which its distribution would be prohibited.
In connection with this material, SCM (i) makes no representation or warranties as to the appropriateness or reliance for use in any transaction or as to the permissibility or legality of any financial instrument in any jurisdiction, (ii) believes the information in this material to be reliable, has not independently verified such information and makes no representation, express or implied, with regard to the accuracy or completeness of such information, (iii) accepts no responsibility or liability as to any reliance placed, or investment decision made, on the basis of such information by the recipient and (iv) does not undertake, and disclaims any duty to undertake, to update or to revise the information contained in this material.
Unless otherwise stated, the views, opinions, forecasts, valuations, or estimates contained in this material are those solely of the author, as of the date of publication of this material, and are subject to change without notice. The recipient of this material should make an independent evaluation of this information and make such other investigations as the recipient considers necessary (including obtaining independent financial advice), before transacting in any financial market or instrument discussed in or related to this material.
Important disclaimers for clients in the EU and UK
This publication has been prepared by Trading Desk Strategists within the Sales and Trading functions of Santander US Capital Markets LLC (“SanCap”), the US registered broker-dealer of Santander Corporate & Investment Banking. This communication is distributed in the EEA by Banco Santander S.A., a credit institution registered in Spain and authorised and regulated by the Bank of Spain and the CNMV. Any EEA recipient of this communication that would like to affect any transaction in any security or issuer discussed herein should do so with Banco Santander S.A. or any of its affiliates (together “Santander”). This communication has been distributed in the UK by Banco Santander, S.A.’s London branch, authorised by the Bank of Spain and subject to regulatory oversight on certain matters by the Financial Conduct Authority (FCA) and the Prudential Regulation Authority (PRA).
The publication is intended for exclusive use for Professional Clients and Eligible Counterparties as defined by MiFID II and is not intended for use by retail customers or for any persons or entities in any jurisdictions or country where such distribution or use would be contrary to local law or regulation.
This material is not a product of Santander´s Research Team and does not constitute independent investment research. This is a marketing communication and may contain ¨investment recommendations¨ as defined by the Market Abuse Regulation 596/2014 ("MAR"). This publication has not been prepared in accordance with legal requirements designed to promote the independence of research and is not subject to any prohibition on dealing ahead of the dissemination of investment research. The author, date and time of the production of this publication are as indicated herein.
This publication does not constitute investment advice and may not be relied upon to form an investment decision, nor should it be construed as any offer to sell or issue or invitation to purchase, acquire or subscribe for any instruments referred herein. The publication has been prepared in good faith and based on information Santander considers reliable as of the date of publication, but Santander does not guarantee or represent, express or implied, that such information is accurate or complete. All estimates, forecasts and opinions are current as at the date of this publication and are subject to change without notice. Unless otherwise indicated, Santander does not intend to update this publication. The views and commentary in this publication may not be objective or independent of the interests of the Trading and Sales functions of Santander, who may be active participants in the markets, investments or strategies referred to herein and/or may receive compensation from investment banking and non-investment banking services from entities mentioned herein. Santander may trade as principal, make a market or hold positions in instruments (or related derivatives) and/or hold financial interest in entities discussed herein. Santander may provide market commentary or trading strategies to other clients or engage in transactions which may differ from views expressed herein. Santander may have acted upon the contents of this publication prior to you having received it.
This publication is intended for the exclusive use of the recipient and must not be reproduced, redistributed or transmitted, in whole or in part, without Santander’s consent. The recipient agrees to keep confidential at all times information contained herein.