Uncategorized
CMO barbells may lift returns over TBA pass-throughs
admin | June 28, 2019
This material is a Marketing Communication and does not constitute Independent Investment Research.
MBS investors can take advantage of today’s inverted yield curve to potentially outperfom TBA pass-throughs and add return to portfolios benchmarked against a broad mortgage index. The steep inversion at the front end followed by increasing rates at longer maturities has created a dip in the curve. This shape adds yield to barbelled portfolios consisting of a short and long bond. These portfolios can have better yield, OAS, convexity, and projected total return profiles than a TBA pass-through with the same duration.
Total returns on a barbell can exceed TBA
A CMO barbell has clear advantages in projected 1-year return over a pass-through with the same duration and market value (Exhibit 1). The barbell’s total return outperforms the pass-through’s in every scenario, and performance improves with larger rate moves in either direction. This reflects the better convexity of the barbell. As realized and implied volatility has moved higher in May and June, convexity has become more valuable.
Exhibit 1: A CMO barbell shows more convex returns than TBA pass-throughs
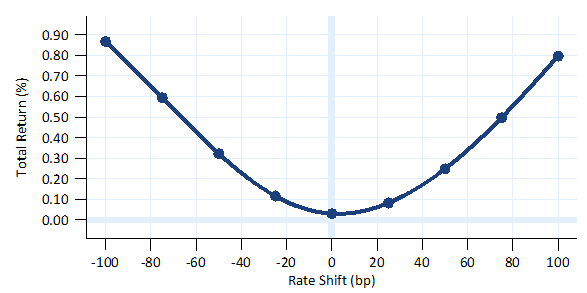
Note: Projected 1-year total returns on a combination of 64% FNR 19-36 EK (PAC) and 36% FNR 19-36 NF (Floater) net of returns on a proceeds- and duration-neutral position in TBA FNCI 2.5% pass-through. Details in Exhibits 3 and 4. Returns assume instantaneous parallel shift in the yield curve at settlement, reinvestment at 1-month LIBOR and horizon repricing as constant OAS. All market levels as of 6/27/19. Source: Yield Book, Amherst Pierpont Securities
The barbell consists of a longer CMO and a shorter CMO with a combined duration that matches a given TBA. A bond barbell is naturally more convex than the equivalent intermediate bond. While mortgages aren’t bullet cash flows, blending a longer and shorter bond to match an intermediate duration still improves convexity.
The yield curve has a sharp dip
The current yield curve has an interesting inversion at the short end (Exhibit 2). The inversion improves the execution of this strategy. The short bond tends to yield closer to the long bond in this environment, while with a typical curve would yield far less. The TBA’s duration is in-between the durations of the bonds in the barbell, so it tends to be most exposed to the dip in the curve. This lowers TBA yields relative to the bonds in the barbell.
Exhibit 2: The current yield curve is sharply inverted at the front end
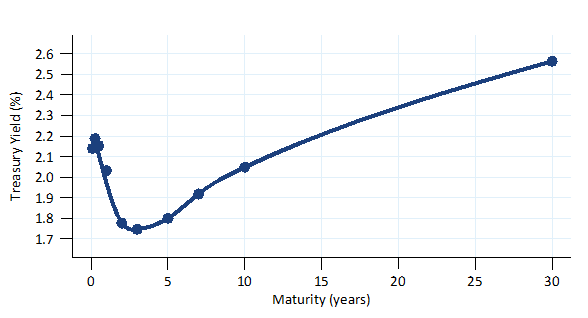
As of 6/26/2019 close. Source: Yield Book, Amherst Pierpont Securities
Constructing a barbell
One example of a barbell might include a longer-duration PAC and a short-duration CMO floater, although other approaches could work, too (Exhibit 3). In this example, the longer bond is a 4-year, 3%-coupon PAC and the short bond is a strip floater with a coupon of 1-month LIBOR+45 bp with a 6.5% cap. Both bonds are backed by 30-year Fannie Mae 4.5% LLB and MLB Quicken pools. Although Quicken is typically a fast servicer, the loan balance collateral still provides prepayment protection. The PAC structure provides a second layer of prepayment protection to the long bond. The position is compared to a 2.5% 15-year TBA pass-through. This TBA has close to a 3-year duration, which is close to the lowest point on the inverted yield curve.
Exhibit 3: CMO barbell vs 15-year 2.5% TBA
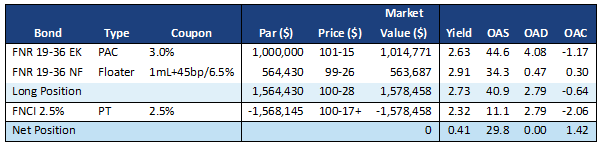
Note: All market values as of 6/27/19. Market value reflects price and accrued interest. Source: Yield Book, Amherst Pierpont Securities
Any portfolio looking to sell TBA pass-throughs to buy a CMO barbell needs anticipate duration- and proceeds-neutral performance. The first step is to choose an appropriate proportion of the two CMOs such that the aggregate option-adjusted duration (OAD) matches the OAD of the TBA. In this example this means 64% of the par amount of the long position is allocated to the PAC and the remaining 36% to the floater. The second step is scale the combination to match the market value of the TBA.. Note the CMO barbell offers 41 bp higher yield, nearly 30 bp higher OAS and significantly better convexity than the TBA.
The barbell looks better than TBA for a total return investor
When it comes to projected total return, the barbell slightly outperforms the TBA in the base case, but as rates move in either direction the better convexity quickly improves the performance of the trade (Exhibit 4). The barbell outperforms the TBA by 80 bp in a 100 bp sell-off and by 87 bp in a 100 bp rally.
Exhibit 4: CMO barbell vs 15-year 2.5% TBA, total return profile
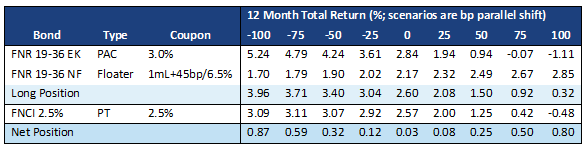
Note: Returns assume instantaneous parallel shift in the yield curve at settlement, reinvestment at 1-month LIBOR and horizon repricing as constant OAS. All market levels as of 6/27/19.Source: Yield Book, Amherst Pierpont Securities
Of course, it is important to note that the components of the CMO barbell trade with less liquidity than the TBA pass-through, and trading out of TBA also means the investor could miss any special TBA dollar roll financing while the trade is in place. This could change the performance of the barbell relative to the pass-through.
Nominal spreads on intermediate PACs off 30-year pass-throughs have slightly widened since early May while nominal spreads on 15-year pass-throughs have remained essentially flat, offering a reasonable entry point for building a barbell of this type.
In general, the yield curve has created a good opportunity for barbelled positions, and the CMO market offers a number of ways to put those positions on.
This material is intended only for institutional investors and does not carry all of the independence and disclosure standards of retail debt research reports. In the preparation of this material, the author may have consulted or otherwise discussed the matters referenced herein with one or more of SCM’s trading desks, any of which may have accumulated or otherwise taken a position, long or short, in any of the financial instruments discussed in or related to this material. Further, SCM may act as a market maker or principal dealer and may have proprietary interests that differ or conflict with the recipient hereof, in connection with any financial instrument discussed in or related to this material.
This message, including any attachments or links contained herein, is subject to important disclaimers, conditions, and disclosures regarding Electronic Communications, which you can find at https://portfolio-strategy.apsec.com/sancap-disclaimers-and-disclosures.
Important Disclaimers
Copyright © 2026 Santander US Capital Markets LLC and its affiliates (“SCM”). All rights reserved. SCM is a member of FINRA and SIPC. This material is intended for limited distribution to institutions only and is not publicly available. Any unauthorized use or disclosure is prohibited.
In making this material available, SCM (i) is not providing any advice to the recipient, including, without limitation, any advice as to investment, legal, accounting, tax and financial matters, (ii) is not acting as an advisor or fiduciary in respect of the recipient, (iii) is not making any predictions or projections and (iv) intends that any recipient to which SCM has provided this material is an “institutional investor” (as defined under applicable law and regulation, including FINRA Rule 4512 and that this material will not be disseminated, in whole or part, to any third party by the recipient.
The author of this material is an economist, desk strategist or trader. In the preparation of this material, the author may have consulted or otherwise discussed the matters referenced herein with one or more of SCM’s trading desks, any of which may have accumulated or otherwise taken a position, long or short, in any of the financial instruments discussed in or related to this material. Further, SCM or any of its affiliates may act as a market maker or principal dealer and may have proprietary interests that differ or conflict with the recipient hereof, in connection with any financial instrument discussed in or related to this material.
This material (i) has been prepared for information purposes only and does not constitute a solicitation or an offer to buy or sell any securities, related investments or other financial instruments, (ii) is neither research, a “research report” as commonly understood under the securities laws and regulations promulgated thereunder nor the product of a research department, (iii) or parts thereof may have been obtained from various sources, the reliability of which has not been verified and cannot be guaranteed by SCM, (iv) should not be reproduced or disclosed to any other person, without SCM’s prior consent and (v) is not intended for distribution in any jurisdiction in which its distribution would be prohibited.
In connection with this material, SCM (i) makes no representation or warranties as to the appropriateness or reliance for use in any transaction or as to the permissibility or legality of any financial instrument in any jurisdiction, (ii) believes the information in this material to be reliable, has not independently verified such information and makes no representation, express or implied, with regard to the accuracy or completeness of such information, (iii) accepts no responsibility or liability as to any reliance placed, or investment decision made, on the basis of such information by the recipient and (iv) does not undertake, and disclaims any duty to undertake, to update or to revise the information contained in this material.
Unless otherwise stated, the views, opinions, forecasts, valuations, or estimates contained in this material are those solely of the author, as of the date of publication of this material, and are subject to change without notice. The recipient of this material should make an independent evaluation of this information and make such other investigations as the recipient considers necessary (including obtaining independent financial advice), before transacting in any financial market or instrument discussed in or related to this material.
Important disclaimers for clients in the EU and UK
This publication has been prepared by Trading Desk Strategists within the Sales and Trading functions of Santander US Capital Markets LLC (“SanCap”), the US registered broker-dealer of Santander Corporate & Investment Banking. This communication is distributed in the EEA by Banco Santander S.A., a credit institution registered in Spain and authorised and regulated by the Bank of Spain and the CNMV. Any EEA recipient of this communication that would like to affect any transaction in any security or issuer discussed herein should do so with Banco Santander S.A. or any of its affiliates (together “Santander”). This communication has been distributed in the UK by Banco Santander, S.A.’s London branch, authorised by the Bank of Spain and subject to regulatory oversight on certain matters by the Financial Conduct Authority (FCA) and the Prudential Regulation Authority (PRA).
The publication is intended for exclusive use for Professional Clients and Eligible Counterparties as defined by MiFID II and is not intended for use by retail customers or for any persons or entities in any jurisdictions or country where such distribution or use would be contrary to local law or regulation.
This material is not a product of Santander´s Research Team and does not constitute independent investment research. This is a marketing communication and may contain ¨investment recommendations¨ as defined by the Market Abuse Regulation 596/2014 ("MAR"). This publication has not been prepared in accordance with legal requirements designed to promote the independence of research and is not subject to any prohibition on dealing ahead of the dissemination of investment research. The author, date and time of the production of this publication are as indicated herein.
This publication does not constitute investment advice and may not be relied upon to form an investment decision, nor should it be construed as any offer to sell or issue or invitation to purchase, acquire or subscribe for any instruments referred herein. The publication has been prepared in good faith and based on information Santander considers reliable as of the date of publication, but Santander does not guarantee or represent, express or implied, that such information is accurate or complete. All estimates, forecasts and opinions are current as at the date of this publication and are subject to change without notice. Unless otherwise indicated, Santander does not intend to update this publication. The views and commentary in this publication may not be objective or independent of the interests of the Trading and Sales functions of Santander, who may be active participants in the markets, investments or strategies referred to herein and/or may receive compensation from investment banking and non-investment banking services from entities mentioned herein. Santander may trade as principal, make a market or hold positions in instruments (or related derivatives) and/or hold financial interest in entities discussed herein. Santander may provide market commentary or trading strategies to other clients or engage in transactions which may differ from views expressed herein. Santander may have acted upon the contents of this publication prior to you having received it.
This publication is intended for the exclusive use of the recipient and must not be reproduced, redistributed or transmitted, in whole or in part, without Santander’s consent. The recipient agrees to keep confidential at all times information contained herein.