By the Numbers
Slowing home sales lowers expected net MBS supply
This material is a Marketing Communication and does not constitute Independent Investment Research.
Expectations for MBS net supply this year have fallen as the pace of new and existing home sales has slowed. If seasonally adjusted home sales remain steady, then net supply should average roughly $15 billion a month for the rest of the year and only $13 billion a month for the year overall. Supply should be higher over the coming months than it was in February and March, which are typically the lowest months of the year.
Net supply has been close to model projections in for the first quarter of 2026, including capturing the sharp drop in February and March (Exhibit 1). Net supply is typically low early in the year, following the slowest months for housing turnover. Furthermore, refinancing was accelerating, and the delay between payoff and repooling typically causes net supply to drop when refinancing increases. Net supply typically rises when refinancing activity fades.
Exhibit 1. Net supply projections
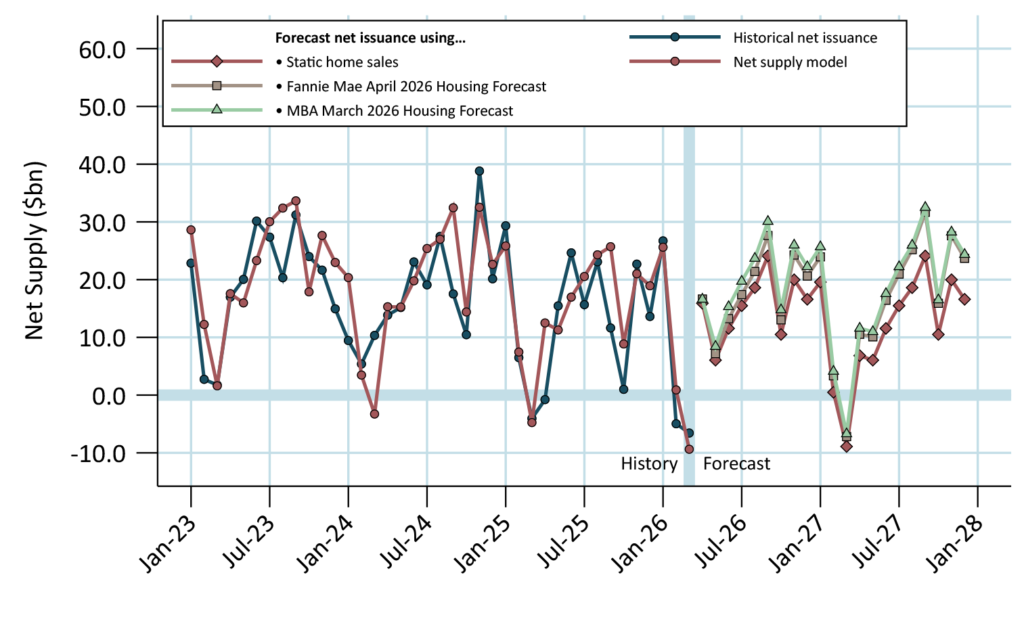
Static projections hold March 2026 home sales constant. Fannie Mae’s April 2026 and MBA’s March 2026 housing forecasts were used for those net supply projections.
Source: Fannie Mae, Freddie Mac, Ginnie Mae, Mortgage Bankers Association, Santander US Capital Markets.
The chart shows monthly projections assuming seasonally-adjusted new and existing home sales are unchanged, and using forecasts provided by Fannie Mae and the Mortgage Bankers Association. The forecasts expect home sales to increase, leading to higher supply projections than the static projection.
Net supply is expected to average $13.0 billion a month this year using the static home sale assumption (Exhibit 2). That is a full-year total of $156.0 billion. The MBA’s home sales forecast leads to expected supply of $16.2 billion per month or $194.4 billion for the year. Fannie Mae’s home sales projections fall in between those results, at $14.9 billion per month or $178.8 billion for the year. All three forecasts are less than projections made last fall based on higher expected home sales.
Exhibit 2. Net supply projections

2026 is an average of actual net issuance through March and projected net issuance from April through December. The first column holds home sales constant at the March 2026 level. Fannie Mae’s April 2026 and MBA’s March 2026 housing forecasts were used for those net supply projections. Fannie Mae’s home sales forecasts do not yet cover 2028.
Source: Fannie Mae, Freddie Mac, Ginnie Mae, Mortgage Bankers Association, Santander US Capital Markets.
The net supply model is driven primarily by new and existing home sales. The portion of new home sales that are placed in Agency MBS contribute directly to net supply. Existing home sales and cash-out refinancing also contribute if the new loan has a larger balance than the loan being paid off. Mortgage rates are also used to estimate the effect of increases and decreases in rate/term refinancing, which can have a short-term effect on supply. There is typically a delay between prepayment and re-pooling, so when rates drop paydowns increase before gross supply; this pushes net supply down. The opposite happens when rates increase and prepayments slow. Over the long run the effects should balance out, but can cause short-term disruptions.
The model does not directly capture other effects, such as flows of loans to and from non-agency securitization or bank portfolios. For example, a borrower that refinances a loan in a non-agency security using an agency mortgage would lift supply. Fannie Mae and Freddie Mac may also cloud these numbers if they choose to retain loans purchased at the cash window rather than pool and sell them, or if they pool loans they had previously retained. This could be more relevant as the two companies seek to grow their mortgage investment portfolios. The model incorporates a short-term error correction designed to capture some of these effects.
A longer-term view of the model shows that it has captured most of the changes in supply levels for several years (Exhibit 3). This graph uses a 3-month moving average to smooth out the month-to-month volatility. The biggest discrepancies occurred in 2020, 2021 and 2022, when supply reached record levels. Some of this may be due to borrowers mortgaging properties that had been owned outright to take advantage of record low rates during the pandemic
Exhibit 3. Agency MBS monthly net supply predicted vs. actual
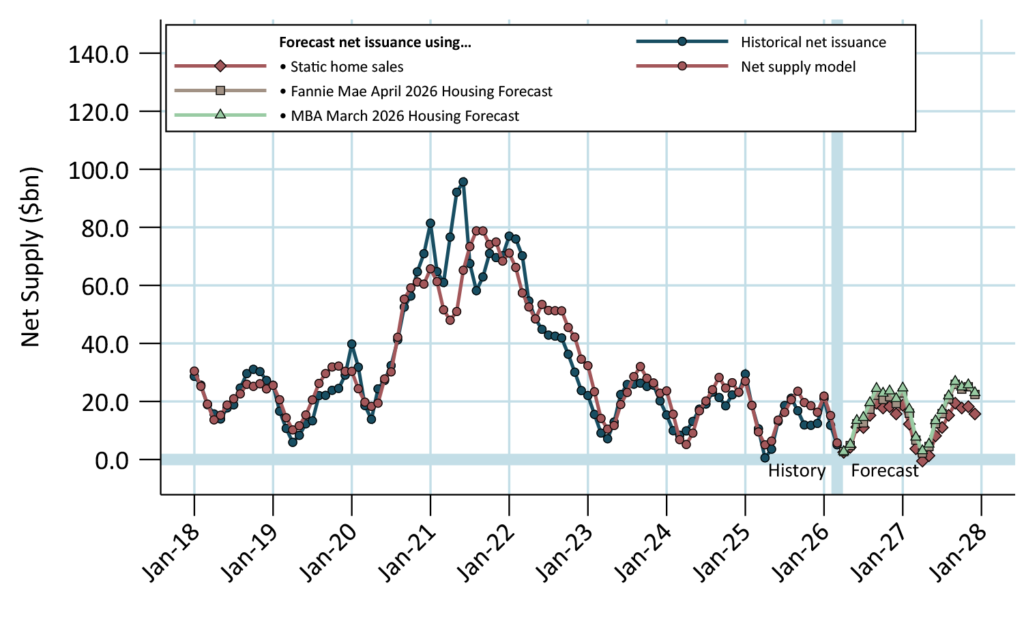
Three-month moving average was applied to all series.
Source: Fannie Mae, Freddie Mac, Ginnie Mae, Mortgage Bankers Association, Santander US Capital Markets.
Over the last few years, the model has been close to actual, although biased slightly high (Exhibit 4). It was generally a little low before and during the pandemic, with the worst miss coming in 2021 when MBS issuance peaked. The model error was smaller over the first quarter of 2026 compared to the four preceding years.
Exhibit 4. Agency MBS monthly net supply predicted vs. actual
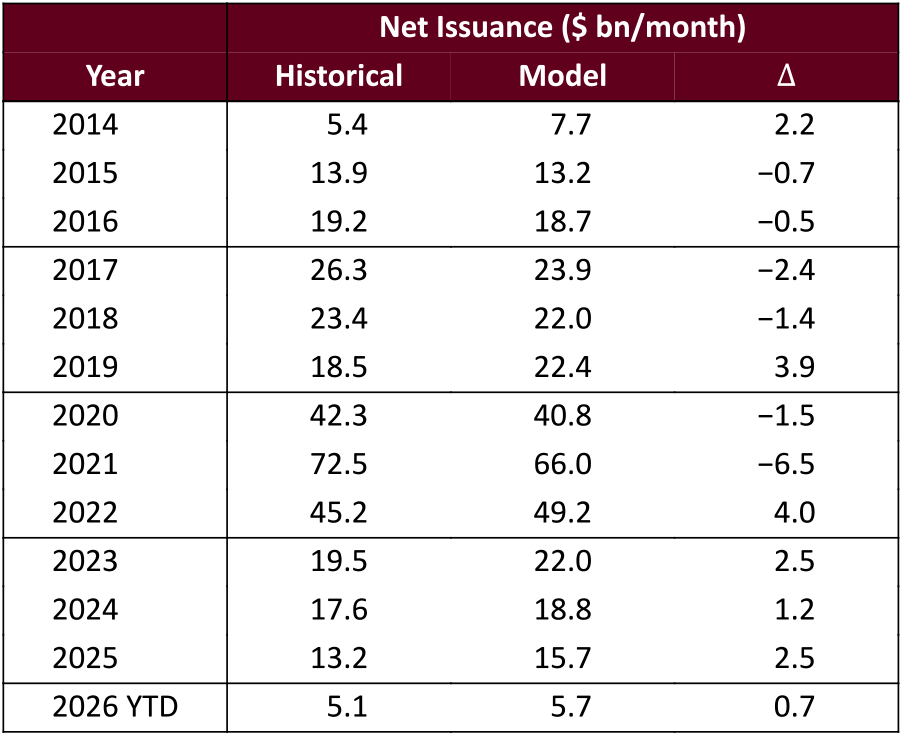
Source: Fannie Mae, Freddie Mac, Ginnie Mae, Mortgage Bankers Association, Santander US Capital Markets.
This material is intended only for institutional investors and does not carry all of the independence and disclosure standards of retail debt research reports. In the preparation of this material, the author may have consulted or otherwise discussed the matters referenced herein with one or more of SCM’s trading desks, any of which may have accumulated or otherwise taken a position, long or short, in any of the financial instruments discussed in or related to this material. Further, SCM may act as a market maker or principal dealer and may have proprietary interests that differ or conflict with the recipient hereof, in connection with any financial instrument discussed in or related to this material.
This message, including any attachments or links contained herein, is subject to important disclaimers, conditions, and disclosures regarding Electronic Communications, which you can find at https://portfolio-strategy.apsec.com/sancap-disclaimers-and-disclosures.
Important Disclaimers
Copyright © 2026 Santander US Capital Markets LLC and its affiliates (“SCM”). All rights reserved. SCM is a member of FINRA and SIPC. This material is intended for limited distribution to institutions only and is not publicly available. Any unauthorized use or disclosure is prohibited.
In making this material available, SCM (i) is not providing any advice to the recipient, including, without limitation, any advice as to investment, legal, accounting, tax and financial matters, (ii) is not acting as an advisor or fiduciary in respect of the recipient, (iii) is not making any predictions or projections and (iv) intends that any recipient to which SCM has provided this material is an “institutional investor” (as defined under applicable law and regulation, including FINRA Rule 4512 and that this material will not be disseminated, in whole or part, to any third party by the recipient.
The author of this material is an economist, desk strategist or trader. In the preparation of this material, the author may have consulted or otherwise discussed the matters referenced herein with one or more of SCM’s trading desks, any of which may have accumulated or otherwise taken a position, long or short, in any of the financial instruments discussed in or related to this material. Further, SCM or any of its affiliates may act as a market maker or principal dealer and may have proprietary interests that differ or conflict with the recipient hereof, in connection with any financial instrument discussed in or related to this material.
This material (i) has been prepared for information purposes only and does not constitute a solicitation or an offer to buy or sell any securities, related investments or other financial instruments, (ii) is neither research, a “research report” as commonly understood under the securities laws and regulations promulgated thereunder nor the product of a research department, (iii) or parts thereof may have been obtained from various sources, the reliability of which has not been verified and cannot be guaranteed by SCM, (iv) should not be reproduced or disclosed to any other person, without SCM’s prior consent and (v) is not intended for distribution in any jurisdiction in which its distribution would be prohibited.
In connection with this material, SCM (i) makes no representation or warranties as to the appropriateness or reliance for use in any transaction or as to the permissibility or legality of any financial instrument in any jurisdiction, (ii) believes the information in this material to be reliable, has not independently verified such information and makes no representation, express or implied, with regard to the accuracy or completeness of such information, (iii) accepts no responsibility or liability as to any reliance placed, or investment decision made, on the basis of such information by the recipient and (iv) does not undertake, and disclaims any duty to undertake, to update or to revise the information contained in this material.
Unless otherwise stated, the views, opinions, forecasts, valuations, or estimates contained in this material are those solely of the author, as of the date of publication of this material, and are subject to change without notice. The recipient of this material should make an independent evaluation of this information and make such other investigations as the recipient considers necessary (including obtaining independent financial advice), before transacting in any financial market or instrument discussed in or related to this material.
Important disclaimers for clients in the EU and UK
This publication has been prepared by Trading Desk Strategists within the Sales and Trading functions of Santander US Capital Markets LLC (“SanCap”), the US registered broker-dealer of Santander Corporate & Investment Banking. This communication is distributed in the EEA by Banco Santander S.A., a credit institution registered in Spain and authorised and regulated by the Bank of Spain and the CNMV. Any EEA recipient of this communication that would like to affect any transaction in any security or issuer discussed herein should do so with Banco Santander S.A. or any of its affiliates (together “Santander”). This communication has been distributed in the UK by Banco Santander, S.A.’s London branch, authorised by the Bank of Spain and subject to regulatory oversight on certain matters by the Financial Conduct Authority (FCA) and the Prudential Regulation Authority (PRA).
The publication is intended for exclusive use for Professional Clients and Eligible Counterparties as defined by MiFID II and is not intended for use by retail customers or for any persons or entities in any jurisdictions or country where such distribution or use would be contrary to local law or regulation.
This material is not a product of Santander´s Research Team and does not constitute independent investment research. This is a marketing communication and may contain ¨investment recommendations¨ as defined by the Market Abuse Regulation 596/2014 ("MAR"). This publication has not been prepared in accordance with legal requirements designed to promote the independence of research and is not subject to any prohibition on dealing ahead of the dissemination of investment research. The author, date and time of the production of this publication are as indicated herein.
This publication does not constitute investment advice and may not be relied upon to form an investment decision, nor should it be construed as any offer to sell or issue or invitation to purchase, acquire or subscribe for any instruments referred herein. The publication has been prepared in good faith and based on information Santander considers reliable as of the date of publication, but Santander does not guarantee or represent, express or implied, that such information is accurate or complete. All estimates, forecasts and opinions are current as at the date of this publication and are subject to change without notice. Unless otherwise indicated, Santander does not intend to update this publication. The views and commentary in this publication may not be objective or independent of the interests of the Trading and Sales functions of Santander, who may be active participants in the markets, investments or strategies referred to herein and/or may receive compensation from investment banking and non-investment banking services from entities mentioned herein. Santander may trade as principal, make a market or hold positions in instruments (or related derivatives) and/or hold financial interest in entities discussed herein. Santander may provide market commentary or trading strategies to other clients or engage in transactions which may differ from views expressed herein. Santander may have acted upon the contents of this publication prior to you having received it.
This publication is intended for the exclusive use of the recipient and must not be reproduced, redistributed or transmitted, in whole or in part, without Santander’s consent. The recipient agrees to keep confidential at all times information contained herein.


