The Big Idea
Mostly strong consumers, but not all
This material is a Marketing Communication and does not constitute Independent Investment Research.
Household finances remain in robust condition overall, a conclusion borne out by the aggregate statistics published by the Federal Reserve. The Fed also publishes, with a lag, more detailed data broken down by income. These data offer insight into why there is so much concern about households at the bottom end of the income scale.
A quick review of the aggregate data
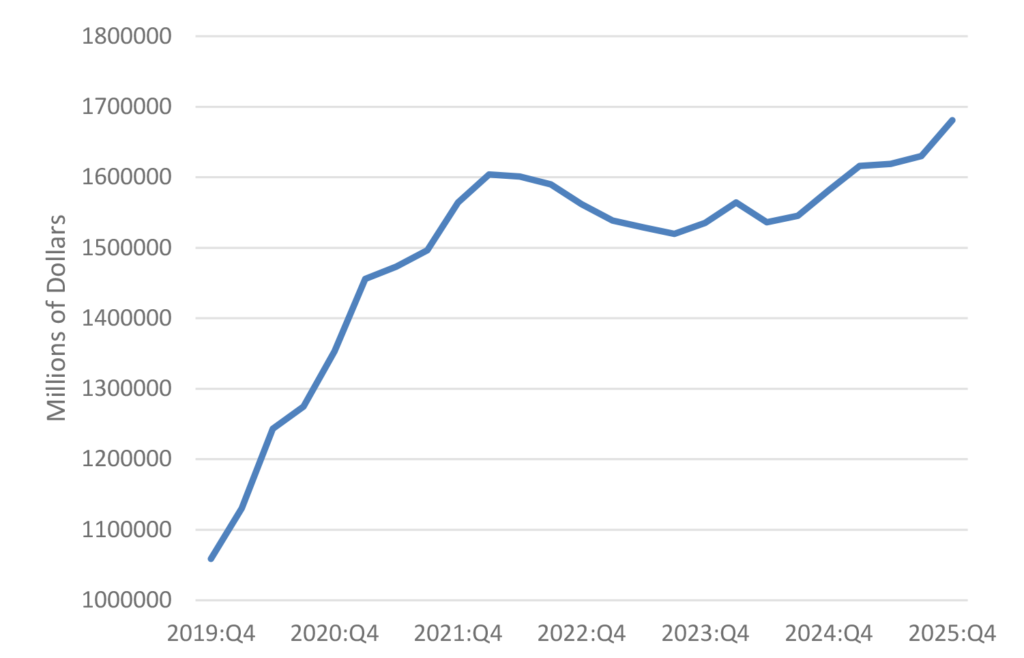
The best place to start is with the overall data. In particular, liquidity in real terms returned to more or less in line with where households wanted by 2023. That shows up in household liquid assets (cash plus bank deposits plus money market account balances) in real terms through the end of last year (Exhibit 1).
Exhibit 1: Real household liquid assets
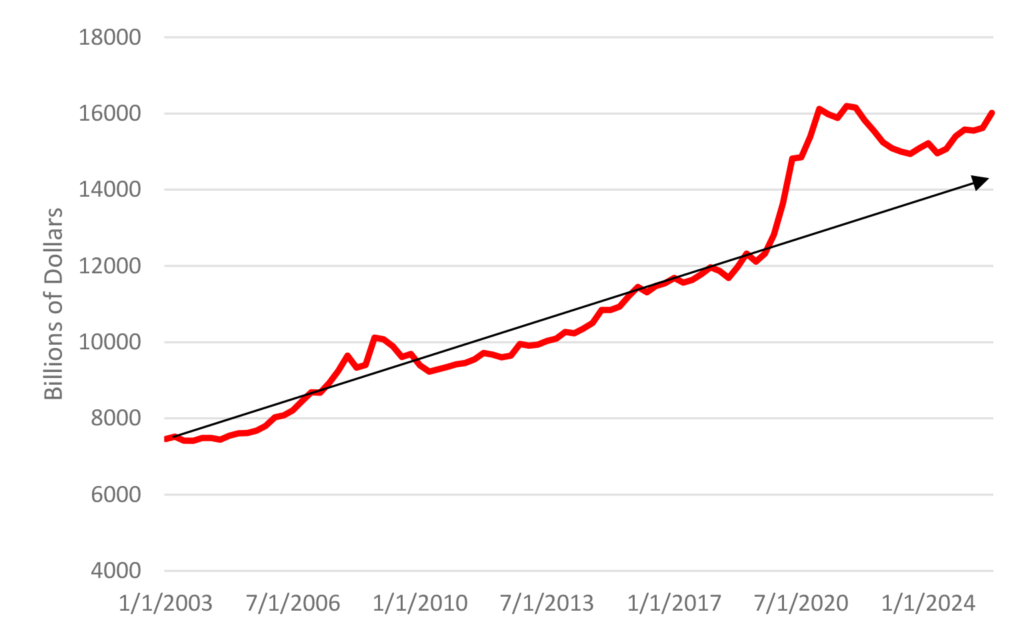
Source: Federal Reserve, BEA.
Over the past two years, the growth in real household liquid assets has once again outpaced the pre-pandemic trend. As of the end of 2025, the level of this measure, at $16.0 trillion, sat about $1.3 trillion, or nearly 9%, higher than if the trend rate of growth seen over the decade prior to the pandemic had continued going forward from the end of 2019. In sum, in the aggregate, households find themselves in a quite favorable liquidity position.
Liquid assets by income quintile
Shortly after the Fed’s aggregate Financial Accounts numbers are released each quarter, the Federal Reserve publishes more comprehensive data that break down the results in several different ways, including by income. These data, called the “Distributional Financial Accounts,” offer an interesting view of household finances across the income spectrum.
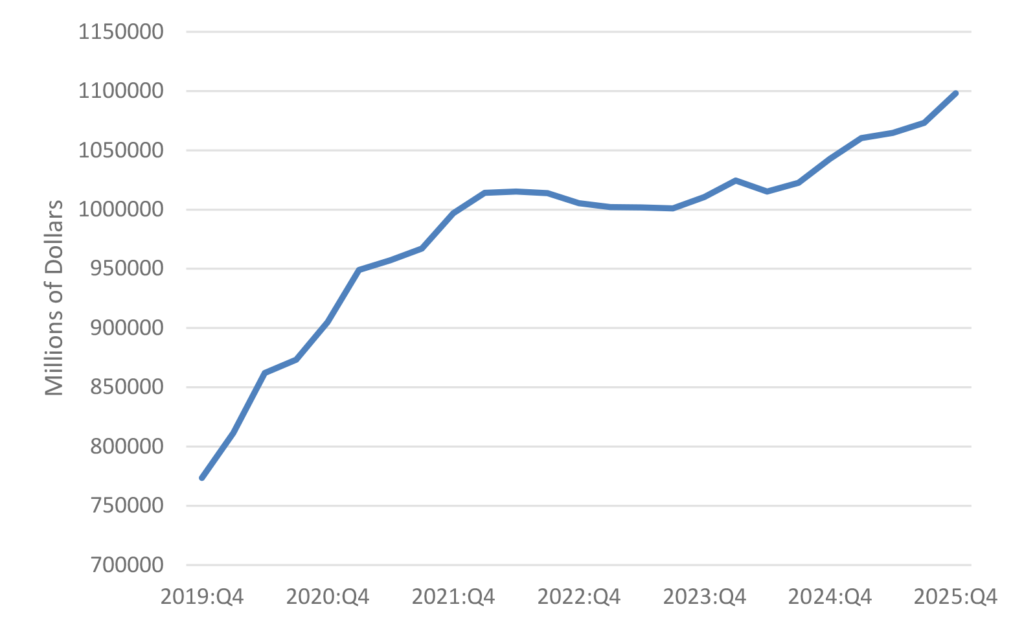
Households are divided into the following six groups along the income scale: the top 1%, 80% to 99%, 60% to 80%, 40% to 60%, 20% to 40%, and 0% to 20%. The following six charts show the household liquid assets for each of the six groups noted above through the end of last year.
Exhibit 2: Liquid Assets – Top 1% by Income
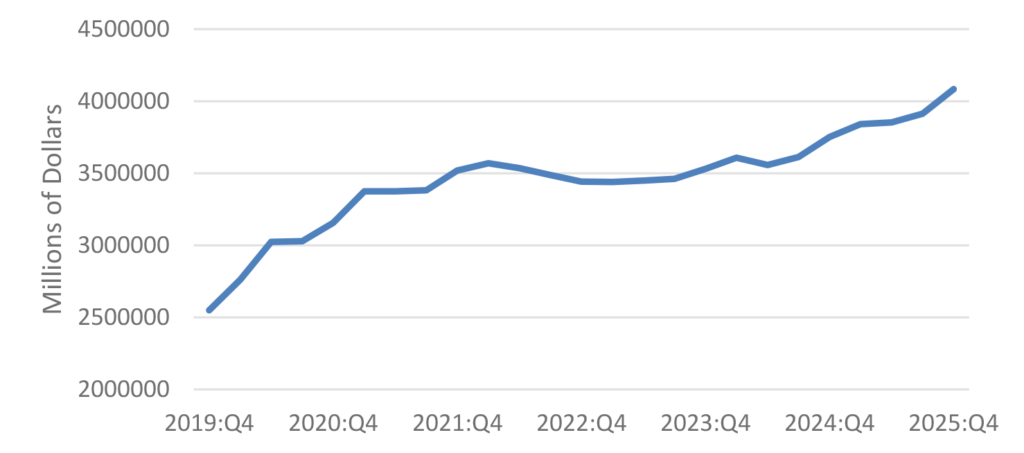
Source: Federal Reserve.
Exhibit 3: Liquid Assets – 80% to 99% Income
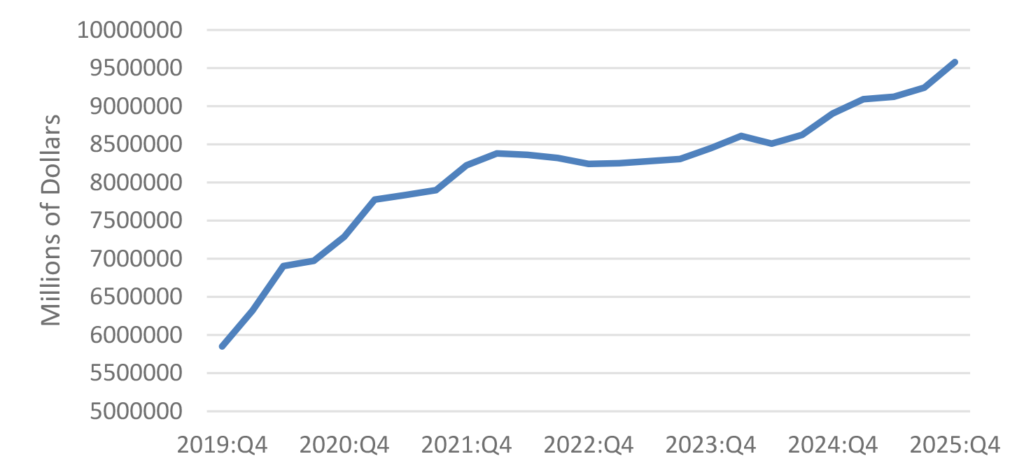
Source: Federal Reserve.
Exhibit 4: Liquid Assets – 60% to 80% Income
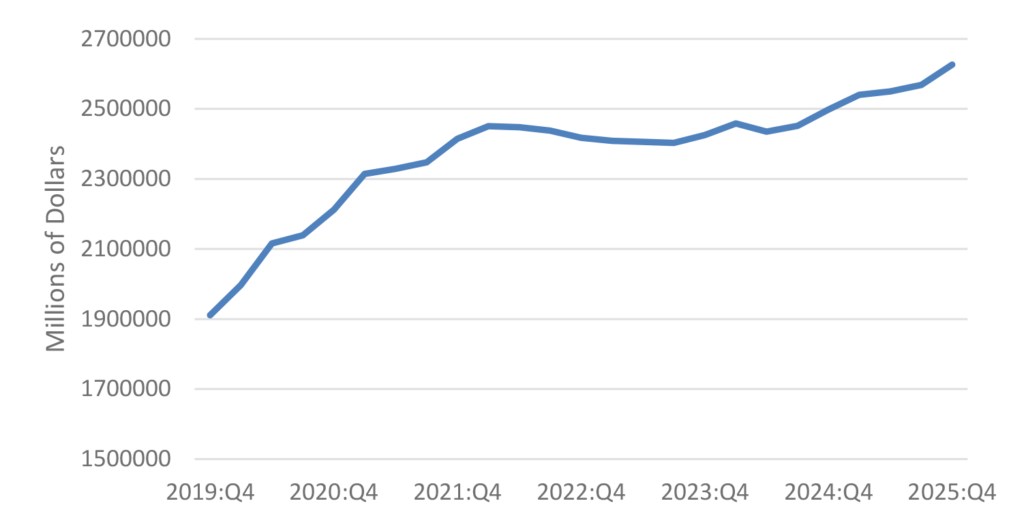
Source: Federal Reserve.
Exhibit 5: Liquid Assets – 40% to 60% Income
Source: Federal Reserve.
Exhibit 6: Liquid Assets – 20% to 40% Income
Source: Federal Reserve.
Exhibit 7: Liquid Assets – 0% to 20% Income
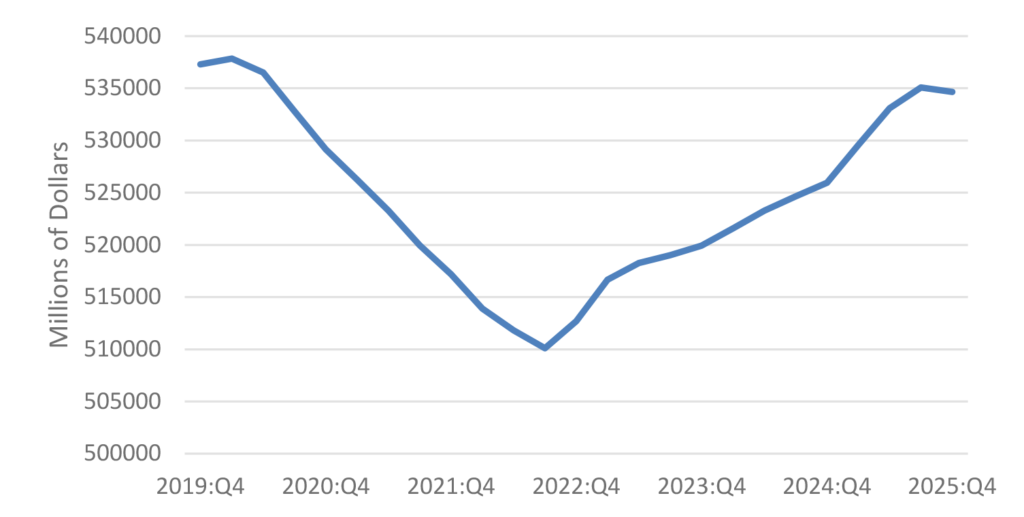
Source: Federal Reserve.
These pictures reveal a few key observations. First, for the top 80% of the income scale, these figures (which are in nominal terms) broadly mirror the aggregate figures (in real terms) from Exhibit 1. Liquid assets surged in 2020 and 2021, fell for a year and a half, and then resumed modest growth after mid-2023. In 2025, the pace of growth picked up, suggesting that households in the top 80% of households by income grew increasingly flush over the course of last year. For each of the top four income quintiles, liquid assets increased in 2025 by 7% or more, well ahead of inflation or even the increase in nominal GDP.
Exhibit 7 shows that the experience for the bottom quintile was substantially different. Households in this group generally drew down their liquid assets in 2020 and 2021 (when everyone else was accumulating them) and then increased liquidity at a modest pace, like everyone else, over the last two years. Perhaps the most telling aspect of these numbers is that the level of household liquid assets for the bottom quintile, even in nominal terms, is below the pre-COVID level.
Of course, inflation has eaten away at families’ purchasing power, especially for the bottom of the income scale. Prices rose by 23.2% from the end of 2019 through the fourth quarter of 2025 using the PCE deflator (arguably, given the composition of their purchases, inflation has been even higher for lower-income households). Exhibit 8 shows the percentage change in real liquid assets for each cohort. The top 80% of the income scale has boosted their liquid assets, even in real terms, since the pandemic. In contrast, the bottom quintile is in a much worse liquidity position.
Exhibit 8: Nominal and Real Liquid Assets Increases by Income Cohort
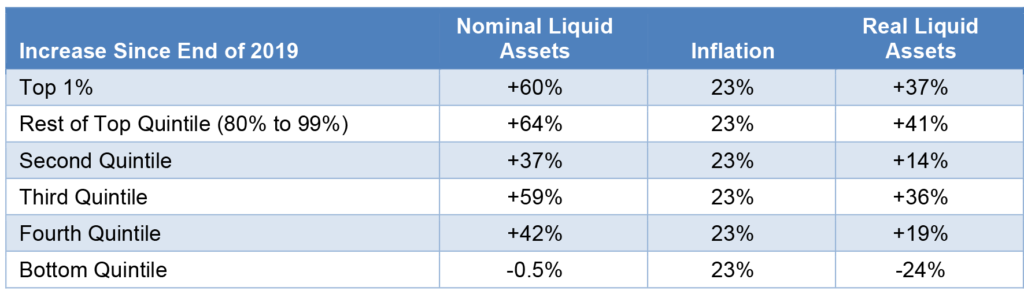
Source: Federal Reserve, BEA (PCE Inflation).
Over the six-year period from the end of 2019 to the end of 2025, nominal GDP rose by a little over 43%. Relative to that advance (since household liquid assets should probably expand not only to offset inflation but also to mirror the real growth in the economy), liquid assets for the top 20% of the income scale have increased substantially faster than the economy, and roughly in line with the expansion of the economy for the middle three quintiles. In contrast, the bottom 20% have fallen dramatically behind relative to everyone else.
Robust middle
The prevailing narrative in recent months has been that consumer spending is being held up by exorbitant outlays from flush wealthy households, while the vast majority of families struggle to get by. However, the Federal Reserve data turn that story on its head. In reality, while the bottom 20% of the income scale is indeed under stress, the bulk of households are in good position.
A recent study published by economists at the American Enterprise Institute came to a similar conclusion. First, they adjusted household income over time for family size. Then, using the government definition of the poverty line as a reference, they divided households into five groups; poor or near poor (less than 150% of the poverty line), lower-middle class (150% to 250%), core middle class (250% to 500%), upper middle class (500% to 1,500%), and rich (1500% and up). The share of families in the bottom two groups sank from 53.8% in 1979 to 34.5% in 2024. Conversely, the proportion of families in the top 2 categories soared from 10.7% in 1979 to 34.8% in 2024. In particular, in contrast to the popular narrative of the middle class being hollowed out, the authors found that around 20% of households shifted over a quarter century from poor or lower middle class to upper middle class. The broad point is that a rising proportion of households have raised their living standards and moved to a higher level of affluence and, therefore, spending.
Economic implications
The Federal Reserve data defines the bottom quintile as households with incomes up to $31,200 (as of the end of 2021). Based on annual Labor Department data for 2022, the bottom quintile of the income scale only accounts for about 9% of total consumer spending. Thus, if one believes that the top 80% of the income scale is in robust financial shape, then overall consumer spending growth should hold up well, even as those at the bottom face intense financial pressure.
While the popular narrative is that most families are struggling while a few super-wealthy households are sustaining the aggregate figures, the underlying reality appears to be the mirror image. Those at the bottom of the income scale are indeed under increasing pressure, but the vast majority of households are on solid financial footing and should remain so as long as the labor market remains healthy.
This material is intended only for institutional investors and does not carry all of the independence and disclosure standards of retail debt research reports. In the preparation of this material, the author may have consulted or otherwise discussed the matters referenced herein with one or more of SCM’s trading desks, any of which may have accumulated or otherwise taken a position, long or short, in any of the financial instruments discussed in or related to this material. Further, SCM may act as a market maker or principal dealer and may have proprietary interests that differ or conflict with the recipient hereof, in connection with any financial instrument discussed in or related to this material.
This message, including any attachments or links contained herein, is subject to important disclaimers, conditions, and disclosures regarding Electronic Communications, which you can find at https://portfolio-strategy.apsec.com/sancap-disclaimers-and-disclosures.
Important Disclaimers
Copyright © 2026 Santander US Capital Markets LLC and its affiliates (“SCM”). All rights reserved. SCM is a member of FINRA and SIPC. This material is intended for limited distribution to institutions only and is not publicly available. Any unauthorized use or disclosure is prohibited.
In making this material available, SCM (i) is not providing any advice to the recipient, including, without limitation, any advice as to investment, legal, accounting, tax and financial matters, (ii) is not acting as an advisor or fiduciary in respect of the recipient, (iii) is not making any predictions or projections and (iv) intends that any recipient to which SCM has provided this material is an “institutional investor” (as defined under applicable law and regulation, including FINRA Rule 4512 and that this material will not be disseminated, in whole or part, to any third party by the recipient.
The author of this material is an economist, desk strategist or trader. In the preparation of this material, the author may have consulted or otherwise discussed the matters referenced herein with one or more of SCM’s trading desks, any of which may have accumulated or otherwise taken a position, long or short, in any of the financial instruments discussed in or related to this material. Further, SCM or any of its affiliates may act as a market maker or principal dealer and may have proprietary interests that differ or conflict with the recipient hereof, in connection with any financial instrument discussed in or related to this material.
This material (i) has been prepared for information purposes only and does not constitute a solicitation or an offer to buy or sell any securities, related investments or other financial instruments, (ii) is neither research, a “research report” as commonly understood under the securities laws and regulations promulgated thereunder nor the product of a research department, (iii) or parts thereof may have been obtained from various sources, the reliability of which has not been verified and cannot be guaranteed by SCM, (iv) should not be reproduced or disclosed to any other person, without SCM’s prior consent and (v) is not intended for distribution in any jurisdiction in which its distribution would be prohibited.
In connection with this material, SCM (i) makes no representation or warranties as to the appropriateness or reliance for use in any transaction or as to the permissibility or legality of any financial instrument in any jurisdiction, (ii) believes the information in this material to be reliable, has not independently verified such information and makes no representation, express or implied, with regard to the accuracy or completeness of such information, (iii) accepts no responsibility or liability as to any reliance placed, or investment decision made, on the basis of such information by the recipient and (iv) does not undertake, and disclaims any duty to undertake, to update or to revise the information contained in this material.
Unless otherwise stated, the views, opinions, forecasts, valuations, or estimates contained in this material are those solely of the author, as of the date of publication of this material, and are subject to change without notice. The recipient of this material should make an independent evaluation of this information and make such other investigations as the recipient considers necessary (including obtaining independent financial advice), before transacting in any financial market or instrument discussed in or related to this material.
Important disclaimers for clients in the EU and UK
This publication has been prepared by Trading Desk Strategists within the Sales and Trading functions of Santander US Capital Markets LLC (“SanCap”), the US registered broker-dealer of Santander Corporate & Investment Banking. This communication is distributed in the EEA by Banco Santander S.A., a credit institution registered in Spain and authorised and regulated by the Bank of Spain and the CNMV. Any EEA recipient of this communication that would like to affect any transaction in any security or issuer discussed herein should do so with Banco Santander S.A. or any of its affiliates (together “Santander”). This communication has been distributed in the UK by Banco Santander, S.A.’s London branch, authorised by the Bank of Spain and subject to regulatory oversight on certain matters by the Financial Conduct Authority (FCA) and the Prudential Regulation Authority (PRA).
The publication is intended for exclusive use for Professional Clients and Eligible Counterparties as defined by MiFID II and is not intended for use by retail customers or for any persons or entities in any jurisdictions or country where such distribution or use would be contrary to local law or regulation.
This material is not a product of Santander´s Research Team and does not constitute independent investment research. This is a marketing communication and may contain ¨investment recommendations¨ as defined by the Market Abuse Regulation 596/2014 ("MAR"). This publication has not been prepared in accordance with legal requirements designed to promote the independence of research and is not subject to any prohibition on dealing ahead of the dissemination of investment research. The author, date and time of the production of this publication are as indicated herein.
This publication does not constitute investment advice and may not be relied upon to form an investment decision, nor should it be construed as any offer to sell or issue or invitation to purchase, acquire or subscribe for any instruments referred herein. The publication has been prepared in good faith and based on information Santander considers reliable as of the date of publication, but Santander does not guarantee or represent, express or implied, that such information is accurate or complete. All estimates, forecasts and opinions are current as at the date of this publication and are subject to change without notice. Unless otherwise indicated, Santander does not intend to update this publication. The views and commentary in this publication may not be objective or independent of the interests of the Trading and Sales functions of Santander, who may be active participants in the markets, investments or strategies referred to herein and/or may receive compensation from investment banking and non-investment banking services from entities mentioned herein. Santander may trade as principal, make a market or hold positions in instruments (or related derivatives) and/or hold financial interest in entities discussed herein. Santander may provide market commentary or trading strategies to other clients or engage in transactions which may differ from views expressed herein. Santander may have acted upon the contents of this publication prior to you having received it.
This publication is intended for the exclusive use of the recipient and must not be reproduced, redistributed or transmitted, in whole or in part, without Santander’s consent. The recipient agrees to keep confidential at all times information contained herein.


