


The Big Idea
Consumer balance sheets can buffer energy costs
Stephen Stanley | April 3, 2026
This material is a Marketing Communication and does not constitute Independent Investment Research.
The surge in gasoline prices in March has renewed concern about US consumers. At the margin, the jump in gasoline prices from around $3 a gallon to $4 will likely drain $10 billion to $15 billion a month from household coffers. Larger-than-usual tax refunds from last year’s tax package may help pay for the first couple of months of higher fuel costs, offering a temporary cushion. But beyond the fuel expense, the latest Federal Reserve data on household balance sheets covering the fourth quarter of last year suggests aggregate household balance sheets remain unusually robust, offering a reason for optimism about consumer spending in 2026.
Debt loads are light
The overall level of household debt is a good place to start for assessing the health of the consumer. As a percentage of GDP, household debt leveled off in the fourth quarter after falling for 17 straight quarters. It sits at the lowest level since 1999 (Exhibit 1). The series has fallen well below the trend from 1970 through 2000.
Exhibit 1: Household debt-to-GDP
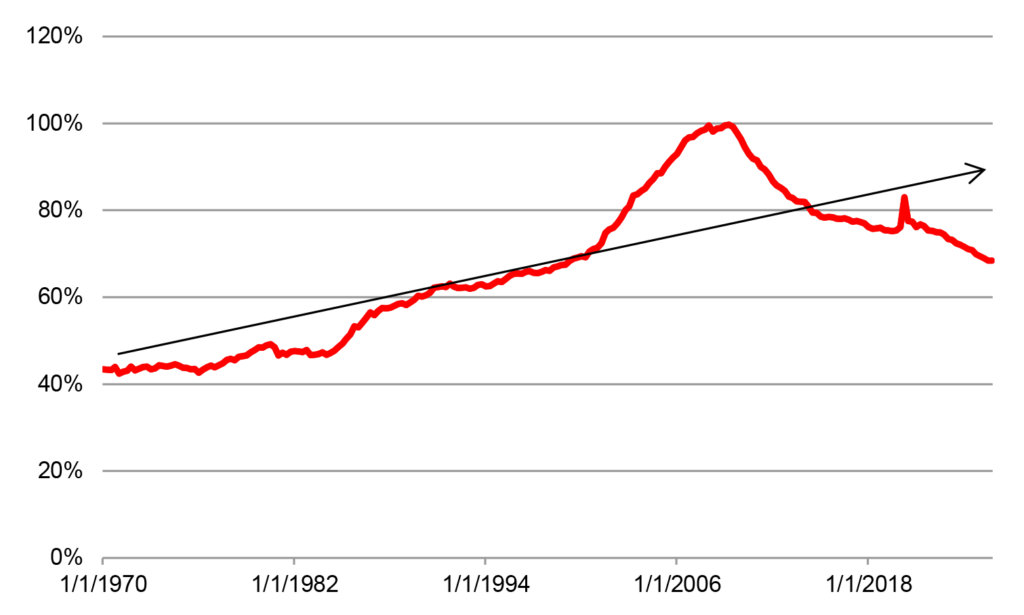
Source: BEA, Federal Reserve.
A similar way to assess household debt is to compare it to disposable income. This ratio inched up slightly in the second half of last year but, aside from some distorted readings during the pandemic, is at its lowest level since 1998 (Exhibit 2).
Exhibit 2: Household debt-to-disposable income
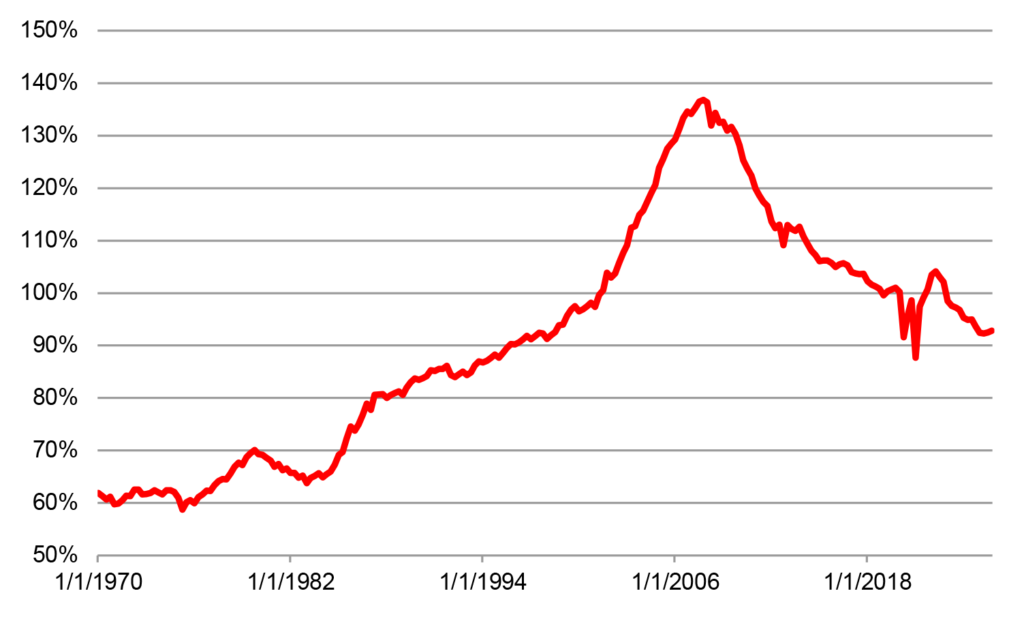
Source: BEA, Federal Reserve.
The bottom line is that, while individual households may be struggling with debt, households in the aggregate have extraordinarily light debt relative to the size of the economy or to their income.
These measures underscore a frequent mistake made by media and even some economists (who should know better). We frequently see assertions that household debt is at all-time highs, but of course almost any nominal dollar series in level terms will be setting all-time highs regularly. It is not particularly helpful to look at the nominal level of household debt without comparing it to some other nominal variable. The bottom line is that, relative to the size of the economy and to the size of household disposable income, household debt is at quarter-century lows.
Debt service burden
In a separate report, the Federal Reserve publishes estimates of the debt service burden, defined as the percentage of disposable income needed to stay current on debt payments. With interest rates up sharply since early 2022, one might imagine that even for a constant level of debt, the servicing burden of that borrowing would have risen substantially. However, the Fed data show the debt service burden remains slightly below 2019 levels at 11.3% in the fourth quarter last year compared to 11.5% to 11.7% in 2019. In fact, the measure is currently lower than at any time before the pandemic going back to 2005 (Exhibit 3).
This is a testament to the prevalence of fixed-rate debt held by households, most notably for mortgages. However, it is more than that. Even the debt service burden for consumer credit sat at 5.4% in the fourth quarter compared to 5.7% to 5.8% in 2019. Given that this component includes auto loans, student loans, and the required payments on credit cards, it should be far more sensitive to higher interest rates than the mortgage component. And yet, though it has risen modestly from its post-Covid lows—when, by the way, student loans were in a government-imposed payment moratorium—it has not even returned to pre-Covid levels much less increased above that range, even as borrowing rates are far higher than in the late 2010s.
Exhibit 3: Debt service burden
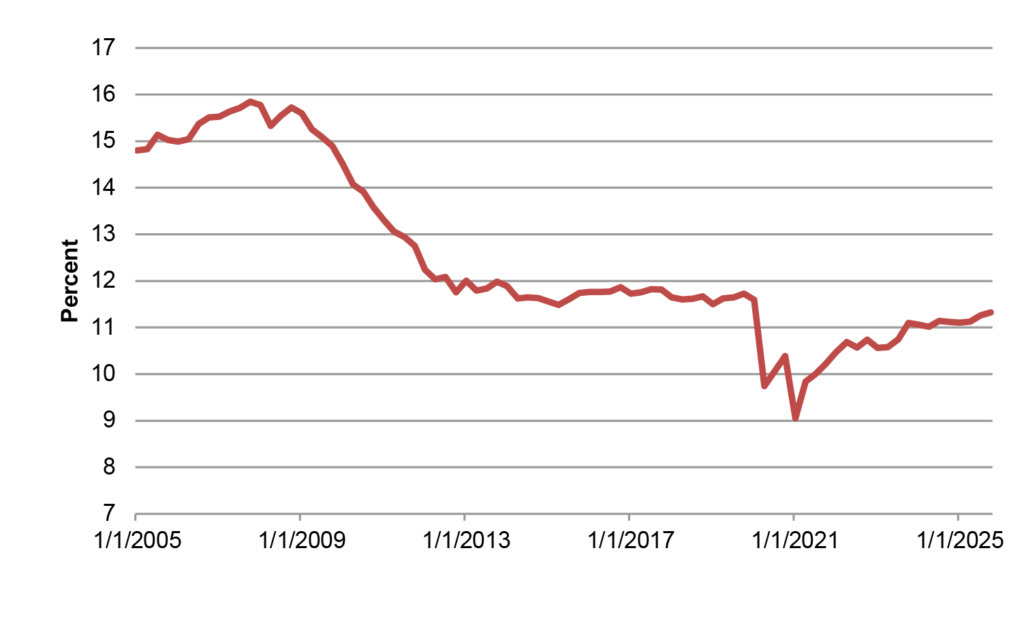
Source: Federal Reserve.
Household assets
The Fed’s latest Financial Accounts data show that the value of household assets rose by another $2.4 trillion in the fourth quarter to $205.6 trillion. For all of 2025, household assets surged by over $15 trillion, or about 8%. Household net worth also jumped by nearly $15 trillion last year, or 8.5%, to $184 trillion.
Tying household balance sheets back to consumer spending, there is an important point to be made. The Fed’s restrictive monetary policy has made it more difficult for households to liquify their soaring asset values, as high interest rates (and relatively tight lending standards) have made it difficult for households to tap what for many is their largest asset: their homes. In the 2000s, at the drop of a hat, homeowners could execute a cash-out refinancing when their home values shot up. With mortgage rates so much higher than before and during the pandemic, this is not a desirable option for most mortgage holders.
One indication of this dynamic is a measure that the Fed reports on in the Financial Accounts each quarter: owners’ equity as a percentage of real estate values. Throughout 2024 and 2025, this measure has hovered between 71% and 73%, the highest readings since the late 1950s. During the 2000s, even as home prices were soaring, homeowners were tapping their equity so fast that their ownership stake was actually falling (Exhibit 4). In contrast, the gauge has jumped by almost eight percentage points since the end of 2019.
Exhibit 4: Owners’ equity as a percentage of real estate values
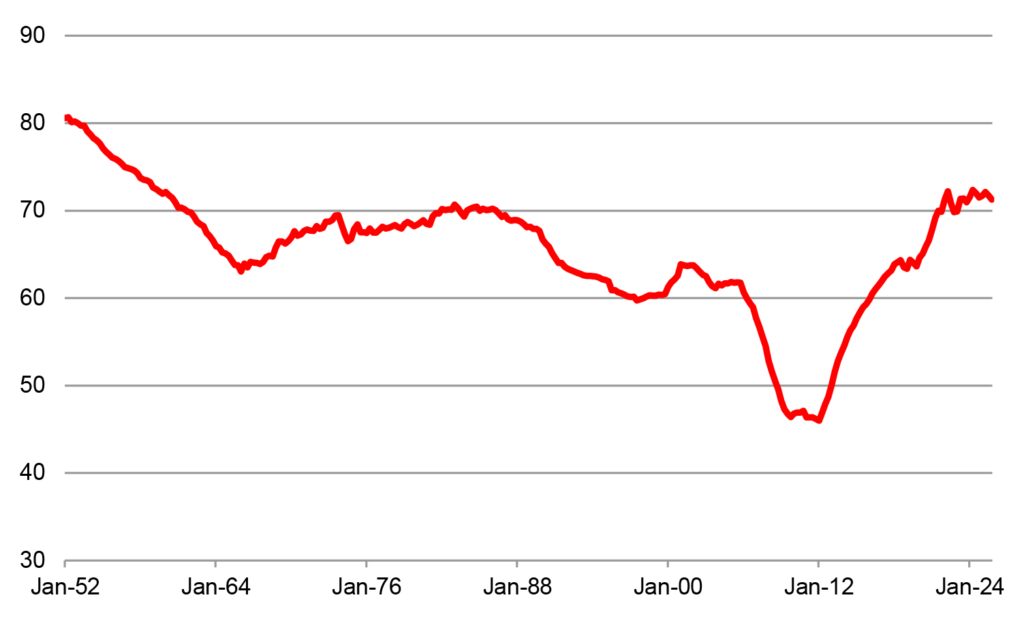
Source: Federal Reserve.
While balance sheets are historically strong, the marginal impact of rising net worth on consumer spending, what economists call the “wealth effect,” has likely been far more limited than it might have been under a different interest rate profile.
Household liquid assets
Given the windfall that households received during the pandemic, I have closely tracked in recent years the evolution of household liquid assets. This series covers the portion of the balance sheet that represents cash equivalents and includes currency, bank deposits, and money market fund shares. I have emphasized this measure is a proxy for spendable funds.
Household liquid assets spiked during the pandemic, reflecting in large part the unprecedented waves of federal government largesse. Most economists presumed that consumers would spend down those balances quickly once the economy fully reopened. However, liquid assets have remained elevated by historical standards (Exhibit 5). Indeed, this aggregate reaccelerated in 2025, posting the largest increase ever in dollar terms (over $1.3 trillion) aside from 2020 and 2021, roughly a 7% advance.
Exhibit 5: Household liquid assets
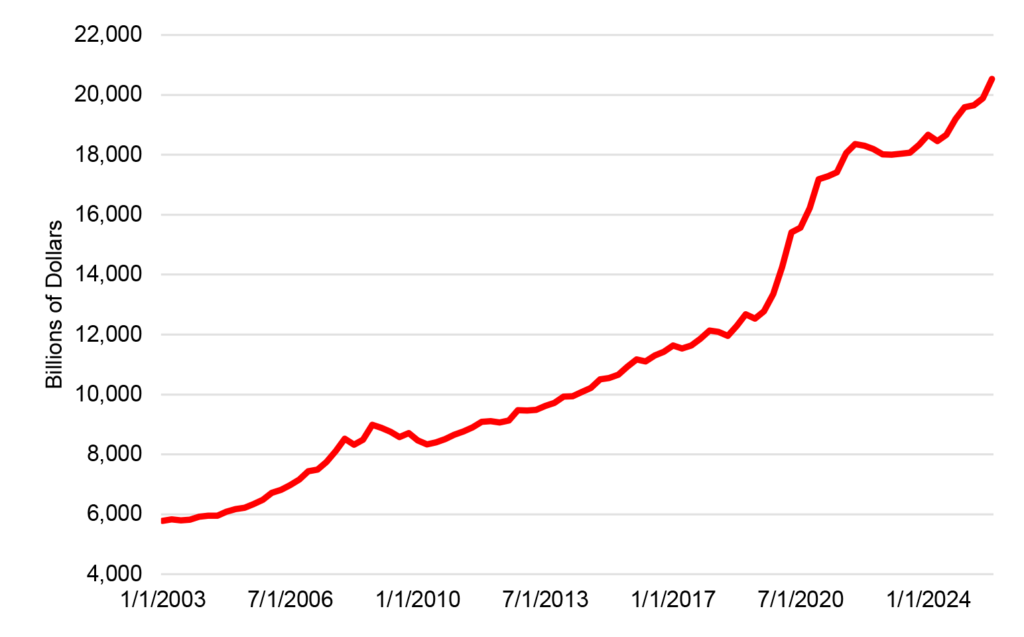
Source: Federal Reserve.
To be fair, a significant portion of the increase in spending power represented by these liquid assets has been eroded by inflation. The level of prices, as measured by the PCE deflator, has risen by over 23% since the end of 2019. It is important to look at real household liquid assets, using the PCE deflator as the price index (Exhibit 6).
Exhibit 6: Real household liquid assets
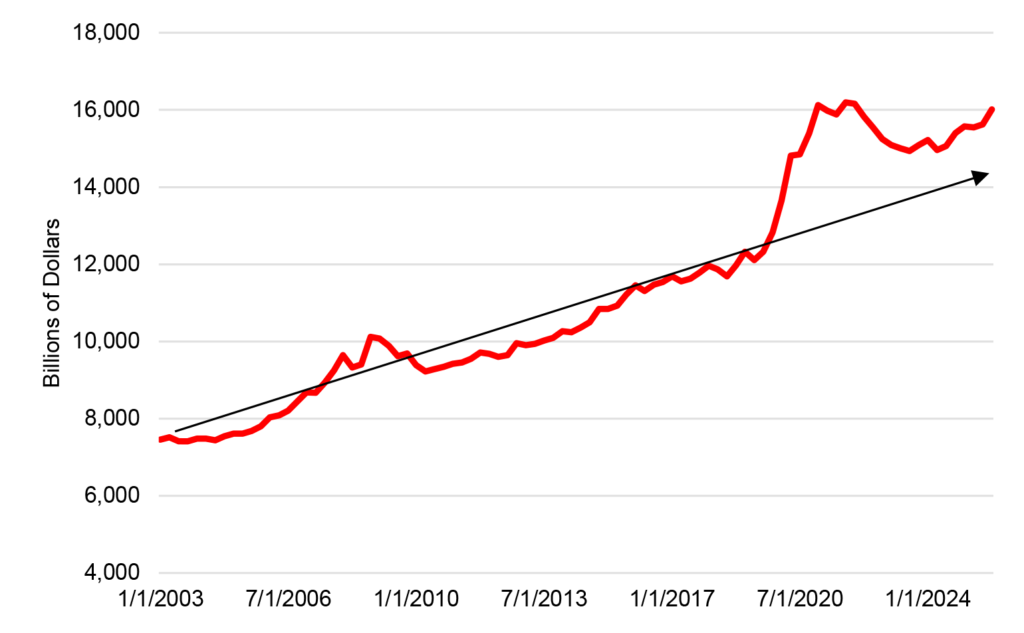
Source: Federal Reserve.
Real household liquid assets moved most of the way back to the trend line by the middle of 2023. After that, real liquid assets resumed growth, suggesting that households viewed their cash positions as back to “normal.” Presumably, if they were sitting on elevated liquidity that they intended to spend, the series would have continued to decline.
Over the past two years, however, the growth in real household liquid assets has once again outpaced the pre-pandemic trend. As of the end of 2025, the level of this measure, at $16.0 trillion, sat about $1.3 trillion, or nearly 9%, higher than if the trend rate of growth seen over the decade prior to the pandemic had continued going forward from the end of 2019.
While, as usual, the main driver of consumer spending going forward is likely to be the pace of income growth, household balance sheets continue to indicate that consumers have plenty of spending power available to them.
Fraying at the edges
While the aggregate balance sheet figures remain robust, some households, especially those at the lower end of the income scale, are struggling. While the prevailing narrative is that high-income households are thriving because of the robust gains in asset values in recent years that are underpinning the net worth figures cited above.
However, I believe that the core of the divergence reflects differences in income gains. Economists at the Bank of America Institute found last month that the 3-month average for year-over-year after-tax labor income growth has been decelerating for lower-income households and picking up for higher-income households. In February, the figures were 0.6% and 4.2%, respectively, the widest gap since the BoA Institute began collecting the data in 2015. Analysts at the institute found that the growing divergence in pay has translated into the card spending of Bank of America customers. The lowest third of households by income recorded a 1.1% year-over-year advance in card spending, while the middle and upper thirds posted 1.7% and 2.9% gains, respectively.
Analysts frequently cite rising credit card and auto loan delinquencies as evidence of financial stress. A careful examination of the credit card payment data suggests little reason for alarm, including the 30+-day and 90+-day credit card delinquencies for a group of servicers including Amex, Bank of America, Capital One, Chase, Citibank, and Discover (the numbers are compiled by Bloomberg) (Exhibit 7 and Exhibit 8). These data demonstrate that credit card delinquencies fell noticeably last year. They have both inched higher in the first two months of this year but remain at levels that do not signal widespread stress.
Exhibit 7: 30+-day credit card delinquencies
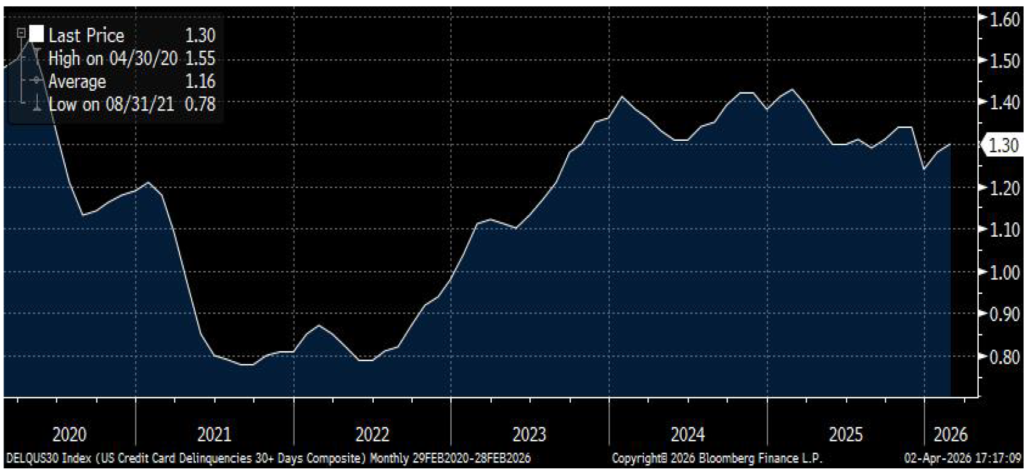
Source: Bloomberg.
Exhibit 8: 90+-day credit card delinquencies
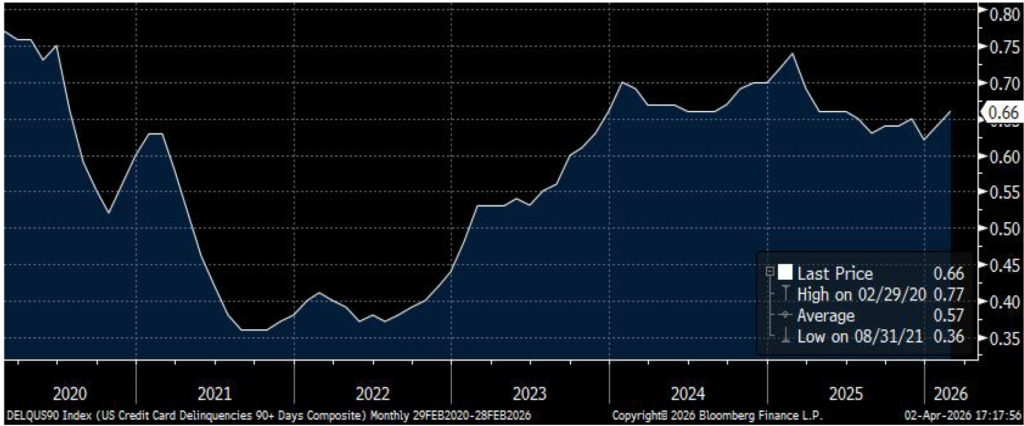
Source: Bloomberg.
Auto loans, at least 90+-day delinquencies as compiled by the New York Fed and Equifax, tell a different story (Exhibit 9). Here, the story is more troubling, as the delinquency rate is well above 2018-2019 levels. If there is a silver lining, it is that the delinquency rate has leveled off since the end of 2024, though at the highest readings since the Global Financial Crisis.
In my view, auto loans are a bit of a special case, hit by the perfect storm of a surge in used vehicle prices in 2021 and 2022, followed by price declines on balance since then. In other words, the particular issues faced for auto loans may be more indicative of what has transpired in the auto sector than a sign of broad acute stress for household finances. Still, for auto lenders and investors in that debt, this is a situation that warrants close scrutiny.
Exhibit 9: 90+-day auto loan delinquencies
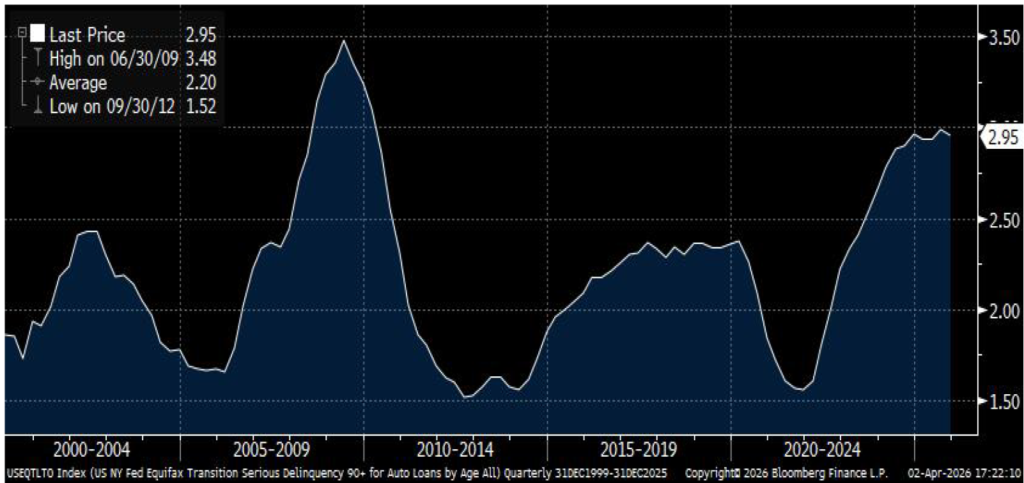
Source: NY Fed, Equifax, Bloomberg.
Robust balance sheets
The state of household finances is not perfect, but the latest aggregate data from the Fed confirm that, overall, balance sheets remain quite robust. Healthy finances should help to limit the stress for households in the wake of slower wage income gains and, most recently, a surge in energy costs. Despite these headwinds, I look for consumer spending in real terms to post a moderate gain of around 2% this year, likely skewed more to the second half of the year, with outlays in real terms clipped in the first and second quarters by higher energy prices.