By the Numbers
Low WALA and purchase loans drive faster second lien prepayments
This material is a Marketing Communication and does not constitute Independent Investment Research.
At-the-money prepayment speeds on recent second lien mortgages are more than 30% faster than pricing conventions on second lien securitizations. Newly originated loans, especially ones used to purchase a home, seem to be driving the faster speeds. But this phenomenon does not appear to be the same across all originators. Loans originated by Mr. Cooper, SpringEQ and PennyMac show slower at-the-money speeds than others.
Investors at the top of the capital structure in second lien securitizations are insulated from fast prepayments to some degree as coupons on investment grade debt are optimized for par pricing at issuance. Subordinate bond investors have benefitted from faster speeds as faster prepayments de-lever the open window ‘AAA’, building credit enhancement for investors lower in the capital structure. However, equity investors have likely seen elevated speeds, particularly on newly originated loans, erode returns if those investors assumed it would take longer for prepayments to ramp up.
A high-level look at second lien speeds
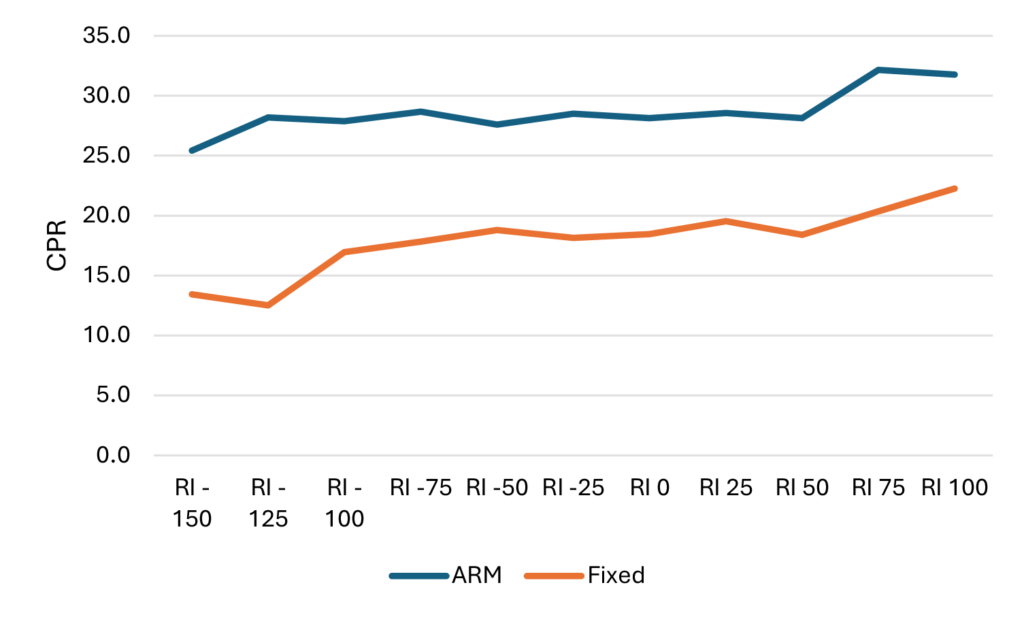
Non-agency investors likely ascribe significant value to second lien collateral as both floating-rate HELOCs and fixed-rate closed-end second lien loans both exhibit very flat prepayment S-curves. The out-of-the-money speeds on these types of loans are bolstered by borrowers who look to extract additional home equity while in-the-money speeds get suppressed by fixed costs associated with refinancing smaller balances. Floating-rate HELOCs prepay faster across all observations of relative moneyness, but some of that differential can be explained by the fact that prepayments are calculated based on the initial securitized balance and do not factor in subsequent draws on the untapped balance (Exhibit 1).
Exhibit 1: HELOCs prepay faster than closed end second liens
Source: Santander US Capital Markets, Core Logic Loan Performance
Note: S-curve observations are over a two-year horizon from January 2023 through December 2025. Incentive is SATO adjusted. Incentive for floating-rate collateral is calculated based on the prevailing fixed 30-year PMMS rate at time of abatement.
Digging in on second lien collateral attributes
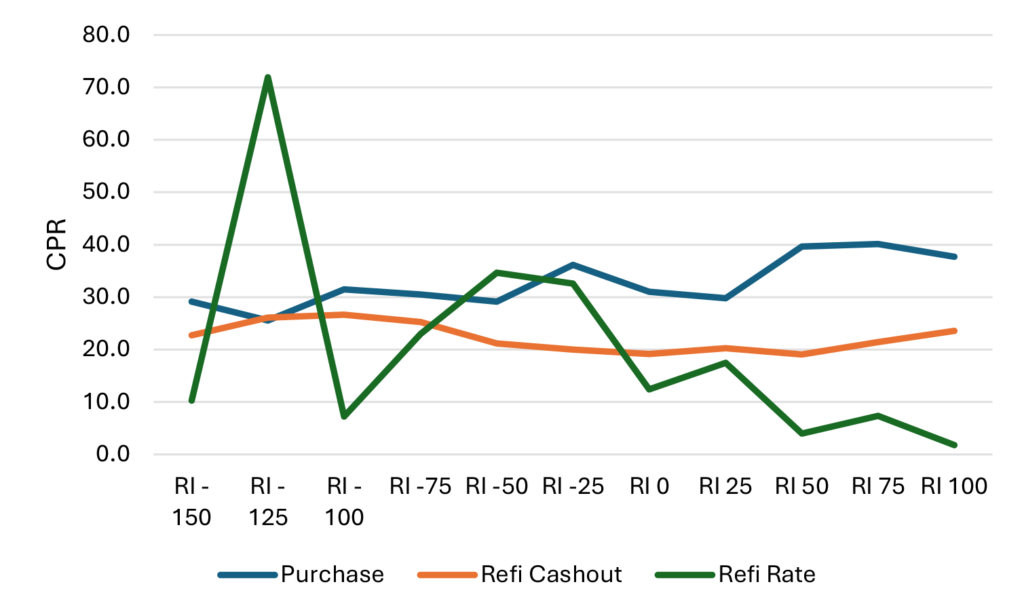
With cohort level at-the-money speeds hovering around 20 CPR, roughly one third faster than pricing conventions of 15 CPR, the prepayment dynamic in second liens merits a more granular look into what loan attributes are driving these faster speeds. One interesting phenomenon observed in second lien prepayments is the presence of elevated at-the-money speeds on purchase loan second liens. Second liens put in place when a borrower purchases a home have prepaid at 31 CPR, 12 CPR faster than loans that were used for equity extraction and 19 CPR faster than loans where the borrower refinanced their second lien (Exhibit 2).
Exhibit 2: Purchase loans pay faster than rate and cash-out refinances
Source: Santander US Capital Markets, Core Logic Loan Performance
Note: S-curve observations are over a two-year horizon from January 2023 through December 2025. Incentive is SATO adjusted. Incentive for floating-rate collateral is calculated based on the prevailing fixed 30-year PMMS rate at time of abatement.
While somewhat anecdotal in nature, there are likely a couple circumstances that could drive elevated speeds on purchase loan seconds. A borrower could take out subordinate financing to perform renovations on a purchased home and, on completion of those capital expenditures and subsequent increase in the home’s value, the borrower may be able to consolidate the existing first and second liens into a lower rate than the blended cost of financing on the two loans. Secondly, the majority of closed end second liens are originated on the back of loans with conventional conforming balances. Given the relatively small balances on these second liens, increases in FHFA conforming limits could trigger the ability to consolidate the second lien into a single GSE-eligible loan if conforming limits increase enough to do so. Interestingly, the differential in prepayment rates between HELOCs and closed end second liens is far more muted on purchase loans with at-the-money speeds on purchase HELOCs coming in at 31 CPR versus 29 CPR for closed-end loans.
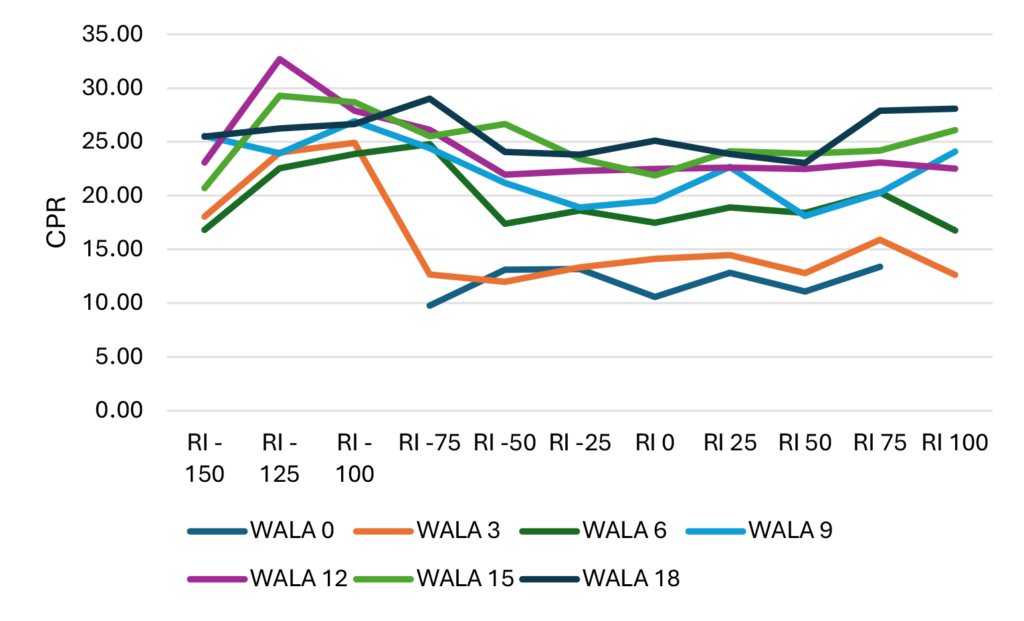
Another curious phenomenon is the presence of somewhat substantial prepayments in newly originated second liens. Loans seasoned less than three months are prepaying at 10 CPR at-the-money while loans with three to five months of seasoning are prepaying at nearly 15 CPR (Exhibit 3). Once again while somewhat anecdotal in nature, it appears that borrowers may be using second liens as some form of bridge financing, potentially using equity from one property to fund the purchase of another and then paying down the second lien debt once permanent financing is secured for the second property.
Exhibit 3: Low WALA loans prepay fast in second lien trusts
Source: Santander US Capital Markets, Core Logic Loan Performance
Note: S-curve observations are over a two-year horizon from January 2023 through December 2025. Incentive is SATO adjusted. Incentive for floating-rate collateral is calculated based on the prevailing fixed 30-year PMMS rate at time of abatement.
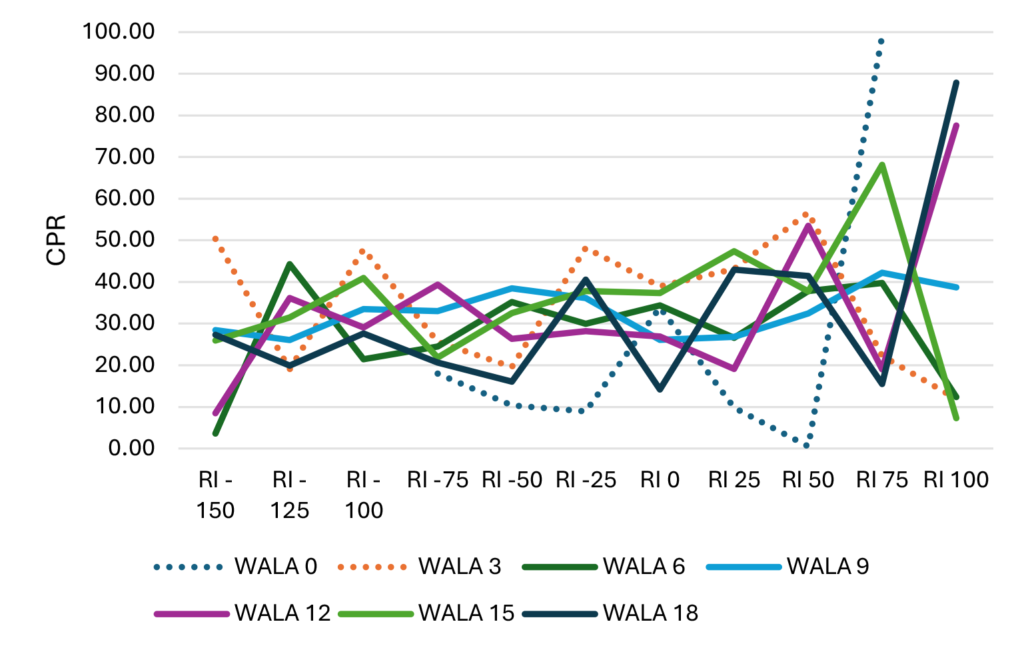
And combining the two loan attributes magnifies the effect. At-the-money prepayment rates on zero to two WALA purchase second liens are nearly 34 CPR. While three to five WALA purchase second liens prepay nearly 39 CPR at-the-money (Exhibit 4). Admittedly, the majority of second liens being securitized are cash out refinances where the phenomenon is far more muted and in-line with the above cohort level analysis.
Exhibit 4: Low WALA purchase loans prepay upwards of 35 CPR at-the-money
Source: Santander US Capital Markets, Core Logic Loan Performance
Note: S-curve observations are over a two-year horizon from January 2023 through December 2025. Incentive is SATO adjusted. Incentive for floating-rate collateral is calculated based on the prevailing fixed 30-year PMMS rate at time of abatement.
Originators matter
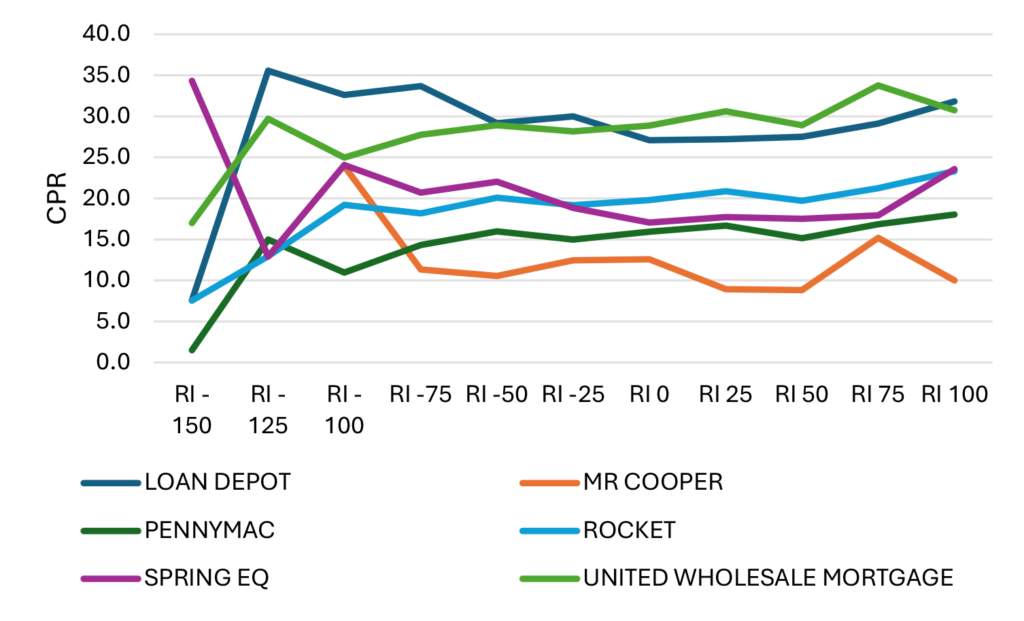
Elevated prepayments are by no means a universal phenomenon across the cohort of securitized second liens. And one of the biggest observable drivers of more muted speeds can be seen when cutting the universe by originator. Mr. Cooper stands out as having by far the slowest at-the-money speeds, prepaying at just 12 CPR, roughly 40% slower than the broader cohort. PennyMac and SpringEQ originated loans stand out as being significantly slower than cohort as well, prepaying at 16 and 17 CPR respectively at-the-money (Exhibit 5).
Exhibit 5: Prepayment S-curves vary significantly by originator
Source: Santander US Capital Markets, Core Logic Loan Performance
Note: S-curve observations are over a two-year horizon from January 2023 through December 2025. Incentive is SATO adjusted. Incentive for floating-rate collateral is calculated based on the prevailing fixed 30-year PMMS rate at time of abatement.
Elevated speeds across other originators could be a function of a number of factors. Greter efficiency and lower costs and frictions associated with refinancing can certainly be one. Differences in original LTV could be another as loans with higher original LTVs can roll down a steep risk-based pricing curve as the loan de-levers. And how active an originator is in soliciting refinances could be another. With that said, investors in different portions of the capital structure will likely favor certain originators over others given potential upside or downside to faster speeds.
This material is intended only for institutional investors and does not carry all of the independence and disclosure standards of retail debt research reports. In the preparation of this material, the author may have consulted or otherwise discussed the matters referenced herein with one or more of SCM’s trading desks, any of which may have accumulated or otherwise taken a position, long or short, in any of the financial instruments discussed in or related to this material. Further, SCM may act as a market maker or principal dealer and may have proprietary interests that differ or conflict with the recipient hereof, in connection with any financial instrument discussed in or related to this material.
This message, including any attachments or links contained herein, is subject to important disclaimers, conditions, and disclosures regarding Electronic Communications, which you can find at https://portfolio-strategy.apsec.com/sancap-disclaimers-and-disclosures.
Important Disclaimers
Copyright © 2026 Santander US Capital Markets LLC and its affiliates (“SCM”). All rights reserved. SCM is a member of FINRA and SIPC. This material is intended for limited distribution to institutions only and is not publicly available. Any unauthorized use or disclosure is prohibited.
In making this material available, SCM (i) is not providing any advice to the recipient, including, without limitation, any advice as to investment, legal, accounting, tax and financial matters, (ii) is not acting as an advisor or fiduciary in respect of the recipient, (iii) is not making any predictions or projections and (iv) intends that any recipient to which SCM has provided this material is an “institutional investor” (as defined under applicable law and regulation, including FINRA Rule 4512 and that this material will not be disseminated, in whole or part, to any third party by the recipient.
The author of this material is an economist, desk strategist or trader. In the preparation of this material, the author may have consulted or otherwise discussed the matters referenced herein with one or more of SCM’s trading desks, any of which may have accumulated or otherwise taken a position, long or short, in any of the financial instruments discussed in or related to this material. Further, SCM or any of its affiliates may act as a market maker or principal dealer and may have proprietary interests that differ or conflict with the recipient hereof, in connection with any financial instrument discussed in or related to this material.
This material (i) has been prepared for information purposes only and does not constitute a solicitation or an offer to buy or sell any securities, related investments or other financial instruments, (ii) is neither research, a “research report” as commonly understood under the securities laws and regulations promulgated thereunder nor the product of a research department, (iii) or parts thereof may have been obtained from various sources, the reliability of which has not been verified and cannot be guaranteed by SCM, (iv) should not be reproduced or disclosed to any other person, without SCM’s prior consent and (v) is not intended for distribution in any jurisdiction in which its distribution would be prohibited.
In connection with this material, SCM (i) makes no representation or warranties as to the appropriateness or reliance for use in any transaction or as to the permissibility or legality of any financial instrument in any jurisdiction, (ii) believes the information in this material to be reliable, has not independently verified such information and makes no representation, express or implied, with regard to the accuracy or completeness of such information, (iii) accepts no responsibility or liability as to any reliance placed, or investment decision made, on the basis of such information by the recipient and (iv) does not undertake, and disclaims any duty to undertake, to update or to revise the information contained in this material.
Unless otherwise stated, the views, opinions, forecasts, valuations, or estimates contained in this material are those solely of the author, as of the date of publication of this material, and are subject to change without notice. The recipient of this material should make an independent evaluation of this information and make such other investigations as the recipient considers necessary (including obtaining independent financial advice), before transacting in any financial market or instrument discussed in or related to this material.
Important disclaimers for clients in the EU and UK
This publication has been prepared by Trading Desk Strategists within the Sales and Trading functions of Santander US Capital Markets LLC (“SanCap”), the US registered broker-dealer of Santander Corporate & Investment Banking. This communication is distributed in the EEA by Banco Santander S.A., a credit institution registered in Spain and authorised and regulated by the Bank of Spain and the CNMV. Any EEA recipient of this communication that would like to affect any transaction in any security or issuer discussed herein should do so with Banco Santander S.A. or any of its affiliates (together “Santander”). This communication has been distributed in the UK by Banco Santander, S.A.’s London branch, authorised by the Bank of Spain and subject to regulatory oversight on certain matters by the Financial Conduct Authority (FCA) and the Prudential Regulation Authority (PRA).
The publication is intended for exclusive use for Professional Clients and Eligible Counterparties as defined by MiFID II and is not intended for use by retail customers or for any persons or entities in any jurisdictions or country where such distribution or use would be contrary to local law or regulation.
This material is not a product of Santander´s Research Team and does not constitute independent investment research. This is a marketing communication and may contain ¨investment recommendations¨ as defined by the Market Abuse Regulation 596/2014 ("MAR"). This publication has not been prepared in accordance with legal requirements designed to promote the independence of research and is not subject to any prohibition on dealing ahead of the dissemination of investment research. The author, date and time of the production of this publication are as indicated herein.
This publication does not constitute investment advice and may not be relied upon to form an investment decision, nor should it be construed as any offer to sell or issue or invitation to purchase, acquire or subscribe for any instruments referred herein. The publication has been prepared in good faith and based on information Santander considers reliable as of the date of publication, but Santander does not guarantee or represent, express or implied, that such information is accurate or complete. All estimates, forecasts and opinions are current as at the date of this publication and are subject to change without notice. Unless otherwise indicated, Santander does not intend to update this publication. The views and commentary in this publication may not be objective or independent of the interests of the Trading and Sales functions of Santander, who may be active participants in the markets, investments or strategies referred to herein and/or may receive compensation from investment banking and non-investment banking services from entities mentioned herein. Santander may trade as principal, make a market or hold positions in instruments (or related derivatives) and/or hold financial interest in entities discussed herein. Santander may provide market commentary or trading strategies to other clients or engage in transactions which may differ from views expressed herein. Santander may have acted upon the contents of this publication prior to you having received it.
This publication is intended for the exclusive use of the recipient and must not be reproduced, redistributed or transmitted, in whole or in part, without Santander’s consent. The recipient agrees to keep confidential at all times information contained herein.


