


The Big Idea
The rising option value of cash
Steven Abrahams | December 5, 2025
This material is a Marketing Communication and does not constitute Independent Investment Research.
Liquidity in the markets for funding debt is showing steady signs of running thin these days. The cost of financing Treasury positions now routinely posts at the high end of the Fed’s target range and periodically above it. More buyers than sellers, of course. But it’s a small vulnerability worth noting in a market that’s generally behaving well. Thin liquidity has a record of giving way to bigger problems under stress. That gives cash, or assets easily turned into cash, increasing option value in this market.
Repo runs hot
One sign of the rising value of cash is in the Treasury repo markets. SOFR has been running near the top of the Fed’s target range since mid-October and jumping above the range whenever funding markets run into the slightest bit of pressure (Exhibit 1). SOFR breached the top in mid-October when several large Treasury auctions settled, again at the end of October when many US banks pared back on repo lending and when many Canadian banks pared back to close their fiscal year, and again at the end of November when banks pared back again to reduce balance sheets.
Exhibit 1: Repo has started clearing above the Fed’s target range
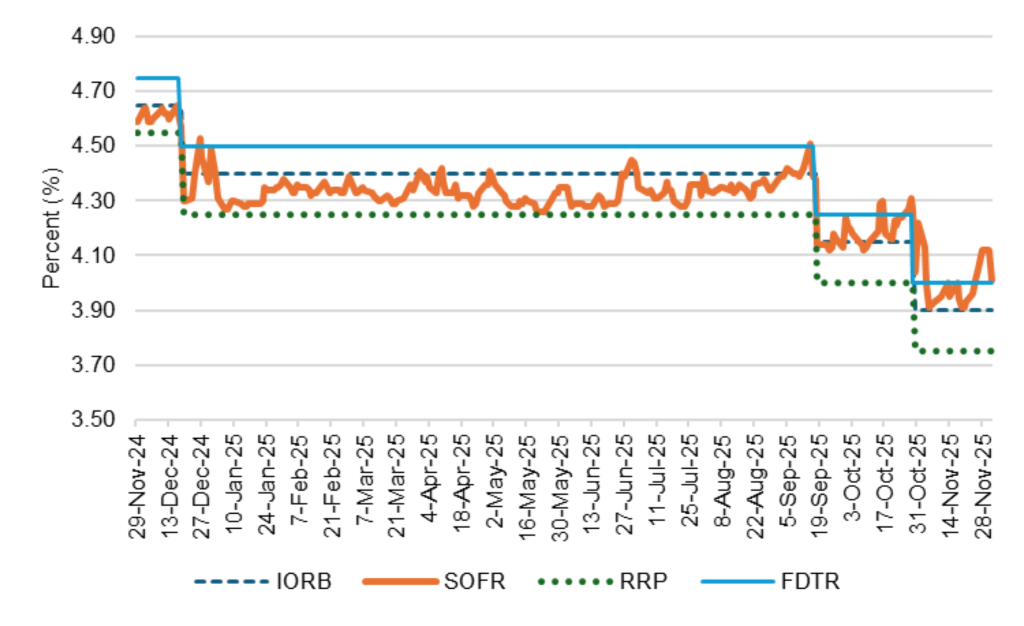
Source: Bloomberg, Santander US Capital Markets
Reflecting rising demand to finance positions
The high price for repo partly reflects a surge in demand. Demand to finance Treasury positions has gone up steadily over the last year, but especially since early October. SOFR financing balances jumped from $3.07 trillion on October 1 to $3.36 trillion on December 1, up 9.3% (Exhibit 2). A rolling 30-day average of SOFR balances, good for filtering monthly noise out of the numbers, shows the same thing. Since the start of October, that average is up 11.9%. Fed data shows primary dealers holding bigger Treasury positions over that period, and hedge funds anecdotally have added to positions as well. Both need financing.
Exhibit 2: A surge in demand to finance Treasury positions
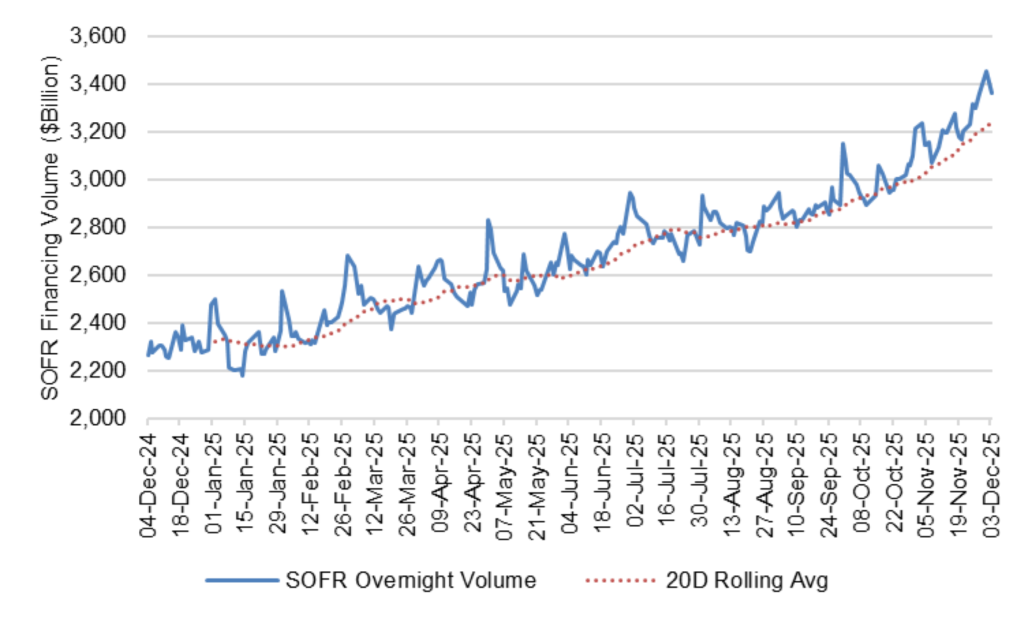
Source: Bloomberg, Santander US Capital Markets
Less cash available that can move immediately to repo
Demand to finance has clearly outstripped the immediate supply of cash. Bank reserves have declined this fall while balances at money market mutual funds have set one record high after another (Exhibit 3). But a dollar in reserves is not as readily available to repo markets as a dollar in a money fund. A dollar in reserves can flow almost immediately into repo. But a dollar in a fund may be tied up in Treasury bills, agency debt, term repo or other investments. Fund AUM does not measure the cash available to meet rising demand for financing or arbitrage away the overnight spikes in repo. Deployable cash clearly is not enough.
Exhibit 3: Bank reserves fall, money fund AUM rises
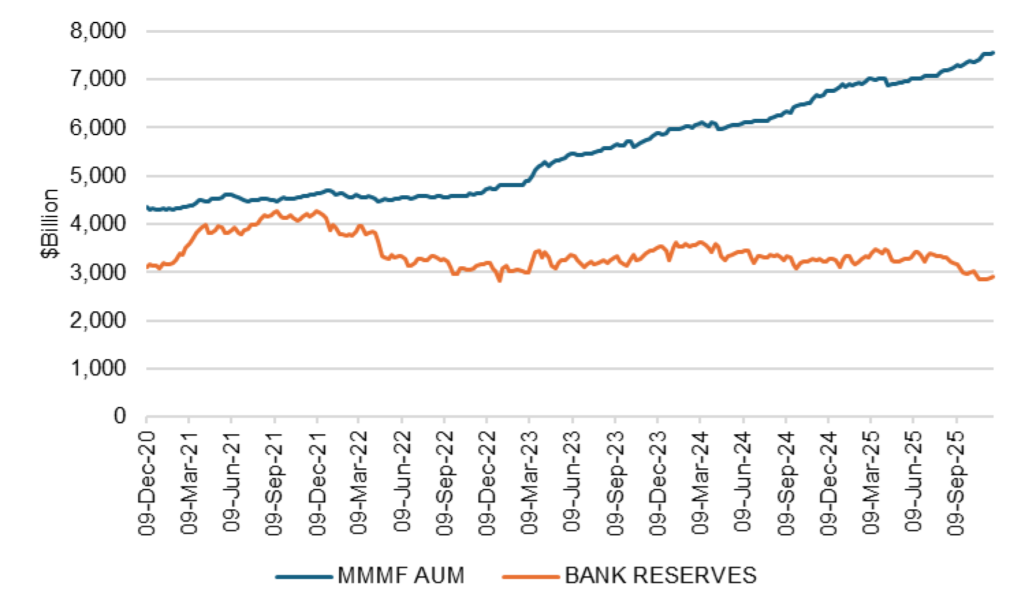
Source: Bloomberg, Santander US Capital Markets
Not the way things are supposed to work
This isn’t supposed to happen. The Fed launched the Standing Repo Facility in July 2021 to try to flood the market with cash whenever repo breaches the top end of the range. The SRF currently lends at 4.0% to primary dealers and to some banks and credit unions against Treasury debt and agency MBS. That should let the borrowers arbitrage away the higher repo rates. The SRF has seen lending spike when SOFR rises, but not quickly enough or in enough size to immediately bring SOFR in line (Exhibit 4). The potential sigma of borrowing from the Fed, the need for repo desks to get senior management approval, and the ballooning of balance sheets are all creating frictions. The Fed will need to do some re-engineering.
Exhibit 4: SRF has made loans lately, but not enough to cap repo rates
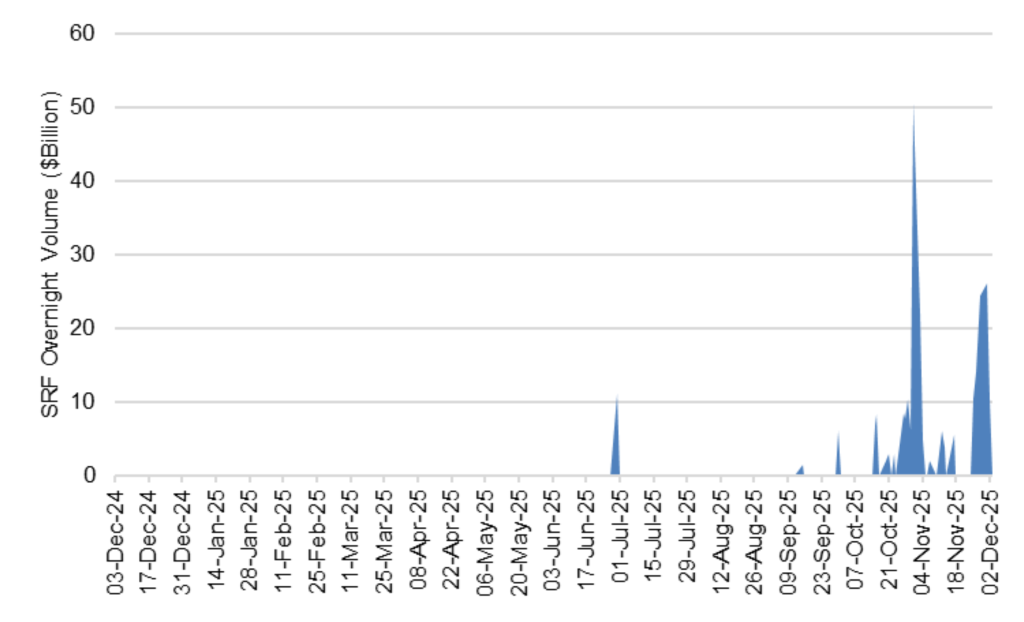
Source: Bloomberg, Santander US Capital Markets
In the meantime, the market without the SRF would be much more vulnerable to episodes like September 17, 2019, when overnight repo rates jumped during the day as high as 10%. That led the Fed to push cash into the market by buying Treasury bills and eventually led to the SRF. But the underlying dynamic today seems the same. Funding is showing fragility.
Thin funding gives cash and liquid assets option value
It should be straightforward to pencil out a list of things that could add pressure to markets beyond the predictable stress of balance sheet reporting dates:
- Surprises in Fed policy or politics
- An unexpected uptick in the federal deficit
- Significant shifts in tariffs
- Fraying in the edges of credit
Treasuries tend to trade a little more in these circumstances and often need to get financed. When Treasury debt becomes harder to finance, other assets become harder to finance, too, if they can be financed at all. And when any asset becomes harder to finance, it becomes harder to trade with dealers that may end up positioning and financing the assets on balance sheet.
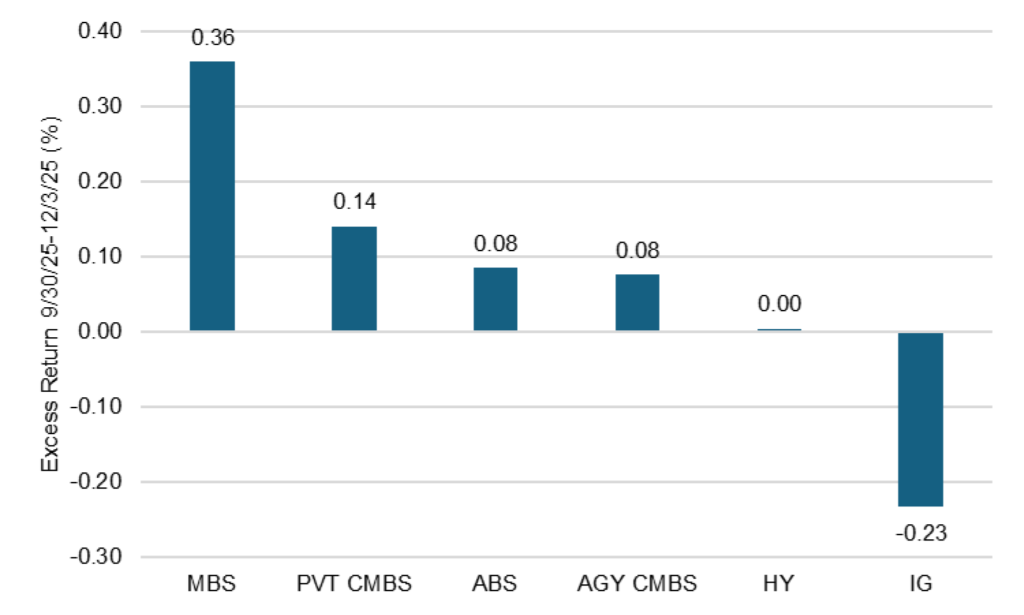
The rising value of liquidity may explain some of the recent spread action in risk assets. Across sectors, agency MBS, which is second only to the Treasury market in daily trading volume, has turned in much stronger excess returns since September than other sectors (Exhibit 5). Some of that, of course, almost certainly came from falling rate volatility. And credit and other sectors may have lagged MBS for a range of reasons, but liquidity is a possibility.
Exhibit 5: Except for MBS, excess return is flat or down since September 30
Source: Bloomberg, Santander US Capital Markets
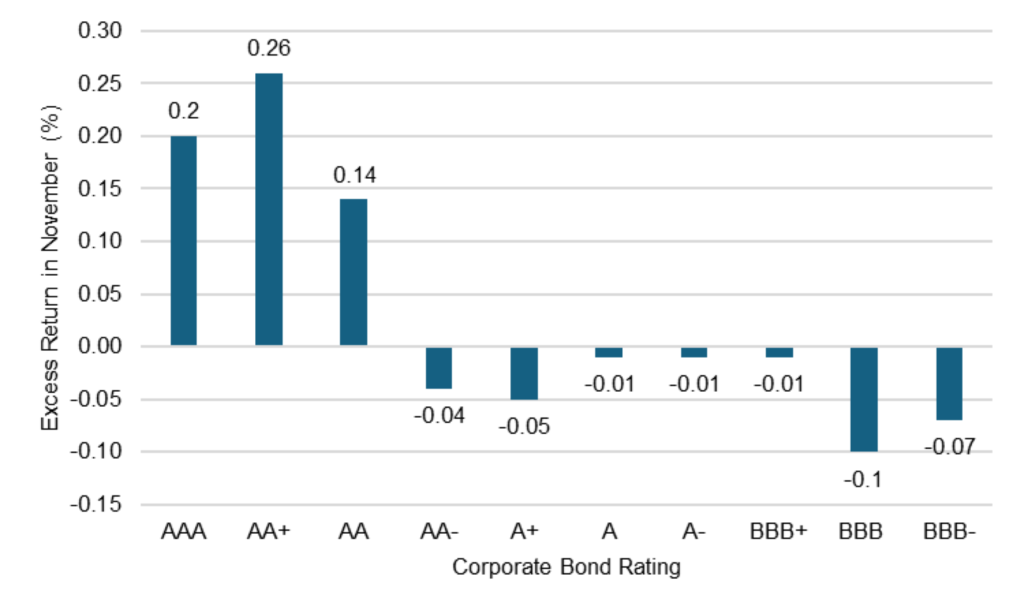
Within credit, assets with higher ratings and generally more liquidity have seen a better bid than assets with lower ratings and less liquidity. Corporates with ‘AA’ and higher ratings outperformed in November, and issues with ‘BBB’ and lower ratings underperformed (Exhibit 6).
Exhibit 6: Higher-rated corporate bonds topped lower-rated in November
Source: Bloomberg, Santander US Capital Markets
Investors should have opportunity in coming months and beyond to redeploy cash and other liquid assets for excess return. Thin funding markets should help create those opportunities. And with Treasury repo clearing at the top end of the Fed target range and a strong possibility that the Fed will cut less than the market expects next year, the relative cost of liquidity is low.
* * *
The view in rates
Fed funds futures now price a 95% chance of a 25 bp cut on December 10. If the Fed does cut, my colleague Stephen Stanley continues to expect no more cuts through the first half of 2026 and possibly through the full year. Inflation is still running above the Fed target and labor markets are soft but not recessionary, making it hard for the Fed to cut very much.
It also seems better to own duration on the front of the yield curve than on the back. The back of the yield curve has to wrestle with Treasury supply and the prospect of weaker demand from Japan as yields on Japanese government bonds rise and draw demand away from Treasury debt.
Key market levels:
- Fed RRP balances settled on Friday at $1.5 billion as other repo rates offer much higher yields
- Setting on 3-month term SOFR traded Friday at 374 bp, reflecting market expectations for a Fed rate cut on December 10
- Further out the curve, the 2-year note traded Friday at 3.56%, up 7 bp in the last week. The 10-year note traded at 4.14%, up 3 bp in the last week
- The Treasury yield curve traded Friday with 2s10s at 57 bp, steeper by 5 bp in the last week. The 5s30s traded Friday at 108 bp, steeper by 1 bp
- Breakeven 10-year inflation traded Friday at 227 bp, up 4 bp in the last week. The 10-year real rate finished the week at 185 bp, up 9 bp in the last week
The view in spreads
Credit markets remain nervous. The case for investment grade risk remains good: Start with an easier Fed, add good fundamentals for bigger business and higher income households, lower volatility, continuing inflows to credit buyers and relatively heavy Treasury supply. Those tides continue to flow. But smaller and more leveraged balance sheets look vulnerable. The Bloomberg US investment grade corporate bond index OAS traded on Friday at 78 bp, tighter by 2 bp in a week. Nominal par 30-year MBS spreads to the blend of 5- and 10-year Treasury yields traded Friday at 122 bp, tighter by 2 bp in the last week. Par 30-year MBS TOAS closed Friday at 19 bp, tighter by 3 bp.
The view in credit
Bank lending to non-bank financial institutions has expanded at an extraordinary pace in the last few years, raising the possibility that lending has outstripped experience and infrastructure for underwriting and monitoring. Consumers in the lowest tier of income look vulnerable, and renewed student payments and cuts to government programs should keep the pressure on. The balance sheets of smaller companies show signs of rising leverage and lower operating margins. Leveraged loans also are showing signs of stress, with the combination of payment defaults and liability management exercises, or LMEs, often pursued instead of bankruptcy, back to 2020 post-Covid peaks. If persistent inflation keeps the Fed at higher rates, fewer leveraged companies will be able to outrun interest rates, and signs of stress should increase. LMEs are very opaque transactions, so a material increase could make important parts of the leveraged loan market hard to evaluate.