By the Numbers
The CMO machine keeps humming through October
This material is a Marketing Communication and does not constitute Independent Investment Research.
For the majority of this year, CMOs have taken an outsized share of gross MBS issuance and October was no exception. CMO desks across the Street took out a quarter of all MBS issued last month. Net demand from depositories and attractive relative value look to be the primary catalysts for continued, elevated levels of demand. A flatter curve and steadily declining rate volatility points towards going down in cap in floaters.
CMOs continue to take a big chunk of gross supply
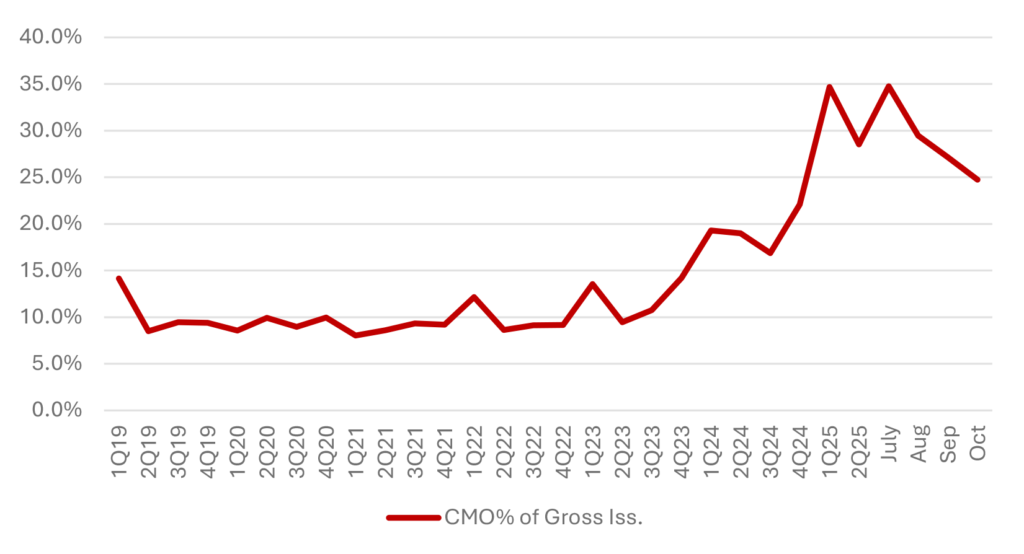
When CMO trusts took out more than one-third of gross MBS supply in the first quarter of this year, many market participants likely viewed it as an aberration against the backdrop of seasonally low levels of supply. Fast forward seven months and CMOs continue to take out meaningful swaths of gross supply with roughly a quarter of MBS issued in October being vacuumed up by CMO desks (Exhibit 1). CMO issuance topped $30 billion last month against the backdrop of $120 billion in gross MBS supply.
Exhibit 1: CMOs took a quarter of MBS issued last month
Source: Santander US Capital Markets, eMBS, Fannie Mae, Freddie Mac, Ginnie Mae
Gauging the shape of CMO demand
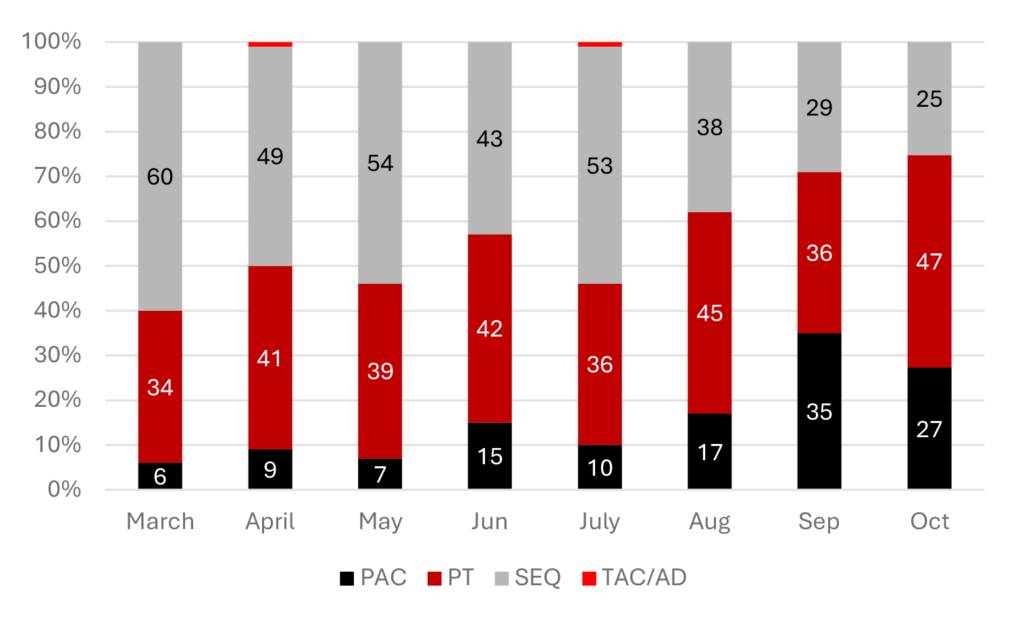
Floating rate CMOs, more specifically Ginnie Mae floaters, dominated the October issuance cycle. Floaters accounted for roughly $20 billion of bonds deal last month or two thirds of total issuance. Pass through or strip structures represented half of CMOs created in October as most floaters are structured as pass through strips. Increased strip issuance came at the expense of PAC structures which fell from 35% of September supply to just 27% of October’s. The decline in demand for PAC structures is likely a manifestation of decreased investor demand for convexity against the backdrop of steadily falling rate volatility which currently sits at roughly 4-year lows (Exhibit 2).
Exhibit 2: Strip floaters dominate the October issuance cycle
Source: Santander US Capital Markets, Fannie Mae, Freddie Mac, Ginnie Mae
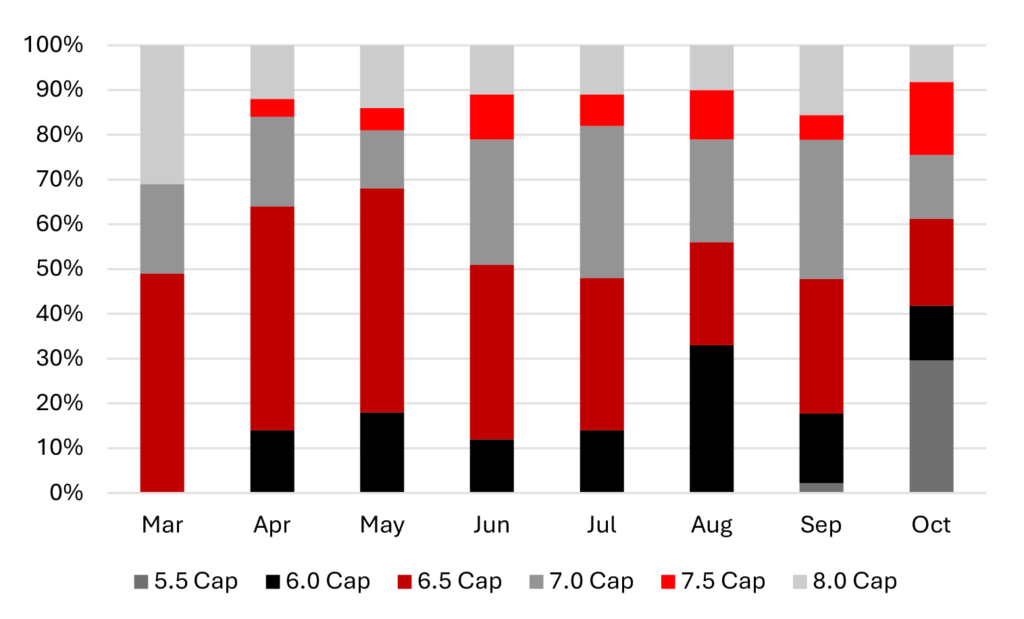
Demand for Ginnie Mae floaters spiked last month as $13.6 billion were dealt, dwarfing conventional issuance of just $6.3 billion. The $13.6 billion dealt last month represents the second-highest issuance month this year, only falling shy of the $15.4 billion of Ginnie floaters issued in August. Demand for Ginnie floaters has been anchored by an uptick in net demand from depositories for CMOs. Elevated bank demand was coupled with what appears to be continued strong demand from fast money. October saw a surge in demand for lower cap floaters as Fed cuts pushed buyers looking for more spread duration and greater sensitivity to further rate cuts into 5.5% cap floaters. Issuance of 5.5% caps jumped from just 2% of all floaters created in September to almost one-third of last month’s supply (Exhibit 3).
Exhibit 3: Fast money buyers move down in cap in October
Source: Santander US Capital markets, Fannie Mae, Freddie Mac, Ginnie Mae
Thoughts on bank demand and relative value
Bank demand for MBS actually weakened in the third quarter as depositories with more than $100 billion in assets reduced their RMBS holdings by $23 billion with holdings falling to $1.985 trillion. Reductions in MBS were driven in large part by JP Morgan, Bank of America, Citigroup and Charles Schwab collectively reducing MBS exposure by more than $18 billion. Despite this, CMO holdings across large banks increased by $3 billion quarter-over-quarter and roughly $15 billion year-to-date, fueled in large part by net purchases from large regional and super regional depositories.
While still mainly idiosyncratic, the recent bankruptcies of Tricolor and First brands and losses on associated warehouse loans to those entities may have the ripple effect of the broader depository base tightening credit availability and underwriting standards, choosing to add securities over loans. While growth in the securities portfolio should be constructive for MBS demand, it is far from a foregone conclusion. Despite multi-year lows in rate volatility, banks may still choose to add floating rate exposure by asset swapping Treasuries or other bullet-like cash flows like agency CMBS which has lagged the tightening in MBS spreads.
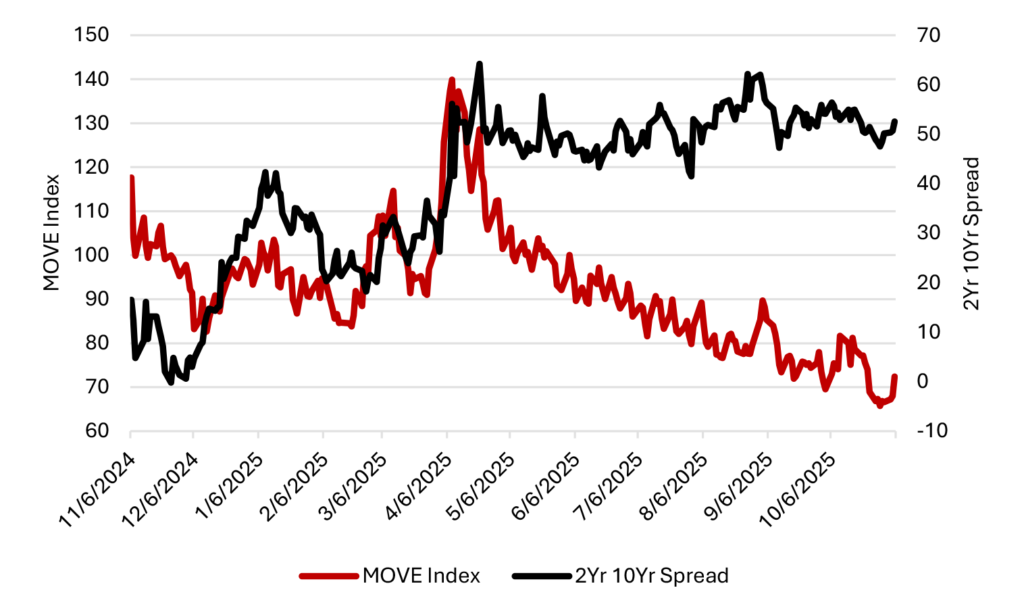
Despite the aforementioned tightening, floaters still look like an attractive means by which to get MBS basis exposure. Both 6.5% and 7.0% cap floaters offer roughly 55 bp of SOFR OAS, roughly in-line with the spread offered by current coupon MBS, which admittedly, is the richest part of the coupon stack. The steady decline in rate volatility coupled with the recent flattening of the yield curve should shift relative value to lower cap floaters which should outperform in a low vol, flat curve environment (Exhibit 4).
Exhibit 4: Low vol and a flatter curve should be constructive for lower cap floaters
Source: Santander US Capital Markets, Bloomberg LP
While the curve and volatility suggest moving down in cap, positioning should be moderated to some extent by recent, more hawkish rhetoric from the Fed. Recent migration down into 5.5% cap floaters feels like a bit of an overreach if the Fed moderates the timing of additional cuts. Floaters with 6.5% caps backed by more positively convex collateral that will not extend materially into a steepening of the yield curve look to be the sweet spot.
This material is intended only for institutional investors and does not carry all of the independence and disclosure standards of retail debt research reports. In the preparation of this material, the author may have consulted or otherwise discussed the matters referenced herein with one or more of SCM’s trading desks, any of which may have accumulated or otherwise taken a position, long or short, in any of the financial instruments discussed in or related to this material. Further, SCM may act as a market maker or principal dealer and may have proprietary interests that differ or conflict with the recipient hereof, in connection with any financial instrument discussed in or related to this material.
This message, including any attachments or links contained herein, is subject to important disclaimers, conditions, and disclosures regarding Electronic Communications, which you can find at https://portfolio-strategy.apsec.com/sancap-disclaimers-and-disclosures.
Important Disclaimers
Copyright © 2026 Santander US Capital Markets LLC and its affiliates (“SCM”). All rights reserved. SCM is a member of FINRA and SIPC. This material is intended for limited distribution to institutions only and is not publicly available. Any unauthorized use or disclosure is prohibited.
In making this material available, SCM (i) is not providing any advice to the recipient, including, without limitation, any advice as to investment, legal, accounting, tax and financial matters, (ii) is not acting as an advisor or fiduciary in respect of the recipient, (iii) is not making any predictions or projections and (iv) intends that any recipient to which SCM has provided this material is an “institutional investor” (as defined under applicable law and regulation, including FINRA Rule 4512 and that this material will not be disseminated, in whole or part, to any third party by the recipient.
The author of this material is an economist, desk strategist or trader. In the preparation of this material, the author may have consulted or otherwise discussed the matters referenced herein with one or more of SCM’s trading desks, any of which may have accumulated or otherwise taken a position, long or short, in any of the financial instruments discussed in or related to this material. Further, SCM or any of its affiliates may act as a market maker or principal dealer and may have proprietary interests that differ or conflict with the recipient hereof, in connection with any financial instrument discussed in or related to this material.
This material (i) has been prepared for information purposes only and does not constitute a solicitation or an offer to buy or sell any securities, related investments or other financial instruments, (ii) is neither research, a “research report” as commonly understood under the securities laws and regulations promulgated thereunder nor the product of a research department, (iii) or parts thereof may have been obtained from various sources, the reliability of which has not been verified and cannot be guaranteed by SCM, (iv) should not be reproduced or disclosed to any other person, without SCM’s prior consent and (v) is not intended for distribution in any jurisdiction in which its distribution would be prohibited.
In connection with this material, SCM (i) makes no representation or warranties as to the appropriateness or reliance for use in any transaction or as to the permissibility or legality of any financial instrument in any jurisdiction, (ii) believes the information in this material to be reliable, has not independently verified such information and makes no representation, express or implied, with regard to the accuracy or completeness of such information, (iii) accepts no responsibility or liability as to any reliance placed, or investment decision made, on the basis of such information by the recipient and (iv) does not undertake, and disclaims any duty to undertake, to update or to revise the information contained in this material.
Unless otherwise stated, the views, opinions, forecasts, valuations, or estimates contained in this material are those solely of the author, as of the date of publication of this material, and are subject to change without notice. The recipient of this material should make an independent evaluation of this information and make such other investigations as the recipient considers necessary (including obtaining independent financial advice), before transacting in any financial market or instrument discussed in or related to this material.
Important disclaimers for clients in the EU and UK
This publication has been prepared by Trading Desk Strategists within the Sales and Trading functions of Santander US Capital Markets LLC (“SanCap”), the US registered broker-dealer of Santander Corporate & Investment Banking. This communication is distributed in the EEA by Banco Santander S.A., a credit institution registered in Spain and authorised and regulated by the Bank of Spain and the CNMV. Any EEA recipient of this communication that would like to affect any transaction in any security or issuer discussed herein should do so with Banco Santander S.A. or any of its affiliates (together “Santander”). This communication has been distributed in the UK by Banco Santander, S.A.’s London branch, authorised by the Bank of Spain and subject to regulatory oversight on certain matters by the Financial Conduct Authority (FCA) and the Prudential Regulation Authority (PRA).
The publication is intended for exclusive use for Professional Clients and Eligible Counterparties as defined by MiFID II and is not intended for use by retail customers or for any persons or entities in any jurisdictions or country where such distribution or use would be contrary to local law or regulation.
This material is not a product of Santander´s Research Team and does not constitute independent investment research. This is a marketing communication and may contain ¨investment recommendations¨ as defined by the Market Abuse Regulation 596/2014 ("MAR"). This publication has not been prepared in accordance with legal requirements designed to promote the independence of research and is not subject to any prohibition on dealing ahead of the dissemination of investment research. The author, date and time of the production of this publication are as indicated herein.
This publication does not constitute investment advice and may not be relied upon to form an investment decision, nor should it be construed as any offer to sell or issue or invitation to purchase, acquire or subscribe for any instruments referred herein. The publication has been prepared in good faith and based on information Santander considers reliable as of the date of publication, but Santander does not guarantee or represent, express or implied, that such information is accurate or complete. All estimates, forecasts and opinions are current as at the date of this publication and are subject to change without notice. Unless otherwise indicated, Santander does not intend to update this publication. The views and commentary in this publication may not be objective or independent of the interests of the Trading and Sales functions of Santander, who may be active participants in the markets, investments or strategies referred to herein and/or may receive compensation from investment banking and non-investment banking services from entities mentioned herein. Santander may trade as principal, make a market or hold positions in instruments (or related derivatives) and/or hold financial interest in entities discussed herein. Santander may provide market commentary or trading strategies to other clients or engage in transactions which may differ from views expressed herein. Santander may have acted upon the contents of this publication prior to you having received it.
This publication is intended for the exclusive use of the recipient and must not be reproduced, redistributed or transmitted, in whole or in part, without Santander’s consent. The recipient agrees to keep confidential at all times information contained herein.


