The Big Idea
Housing affordability inches up
This material is a Marketing Communication and does not constitute Independent Investment Research.
Affordability has been a substantial problem in housing over the past several years. Steep home price increases and relatively high mortgage rates have made it difficult for households to buy homes. In its September existing home sales press release, the National Association of Realtors touted “improved housing affordability” as a contributor to rising sales. However, the NAR’s own data on housing affordability suggests that the situation has only modestly brightened and is consistent with continued tepid demand.
Affordability index
The NAR publishes a simple housing affordability index on a monthly basis. The inputs are the median family income level, as reported by the Census Bureau, the median existing home price, included in the NAR’s existing home sales publications, and the prevailing mortgage rate, the effective rate on loans closed on existing homes from the Federal Housing Finance Agency.
Assuming a 20% down payment and a qualifying ratio of 25%—that is, the monthly principal and interest payment cannot exceed 25% of median family monthly income—the NAR calculates the level of income needed to qualify for a mortgage on the median priced existing home. An index reading of 100 would indicate that the qualifying income level is exactly equal to the Census Bureau’s median household income reading. A higher number means that the median income is more than sufficient (greater affordability), while a number lower than 100 means that a higher than median income level is needed to qualify for the median-priced home.
In practice, the Census Bureau data on the median income is reported on an annual basis with a long lag, so the NAR has to extrapolate forward using wage figures and the prior year’s pace of income growth. As a result, the income side of the calculation tends to follow a relatively smooth path in the most recent period (data are revised historically once the Census Bureau data are updated). The bulk of the variability in the index in real time stems from swings in the NAR’s measure of home prices and in mortgage rates.
Historical perspective
A quick reading of the NAR Affordability Index reveals that the index appears to be driven mainly by the level of mortgage rates (Exhibit 1). Affordability plunged in the late 1970s and early 1980s, when mortgage rates surged to a high of 18%, gradually recovered in the 1980s and 1990s, surged in the 2000s, when Chair Greenspan’s “conundrum”—falling long-term rates even as the Fed was raising its policy rates—prevailed, and stayed at elevated levels throughout the period after the financial crisis, when rates were historically low. Then, in 2022, when borrowing costs soared, affordability plummeted.
Exhibit 1: NAR Housing Affordability Index

Source: National Association of Realtors.
Even during the housing boom, when home prices were soaring, affordability was actually rising because falling mortgage rates were a more powerful force than rising prices. It was only in 2006 and 2007, when mortgage rates ticked up that affordability eroded. For anyone who has ever spent time plugging numbers into a mortgage payment calculator, this was probably already obvious. In any case, mortgage rates account for 84% of the movement in the NAR Affordability Index, providing some hard statistical backing to the visual observation. Plotting the Freddie Mac 30-year mortgage rate on an inverted scale against the NAR index further illustrates the point (Exhibit 2).
Exhibit 2: Affordability index and mortgage rates
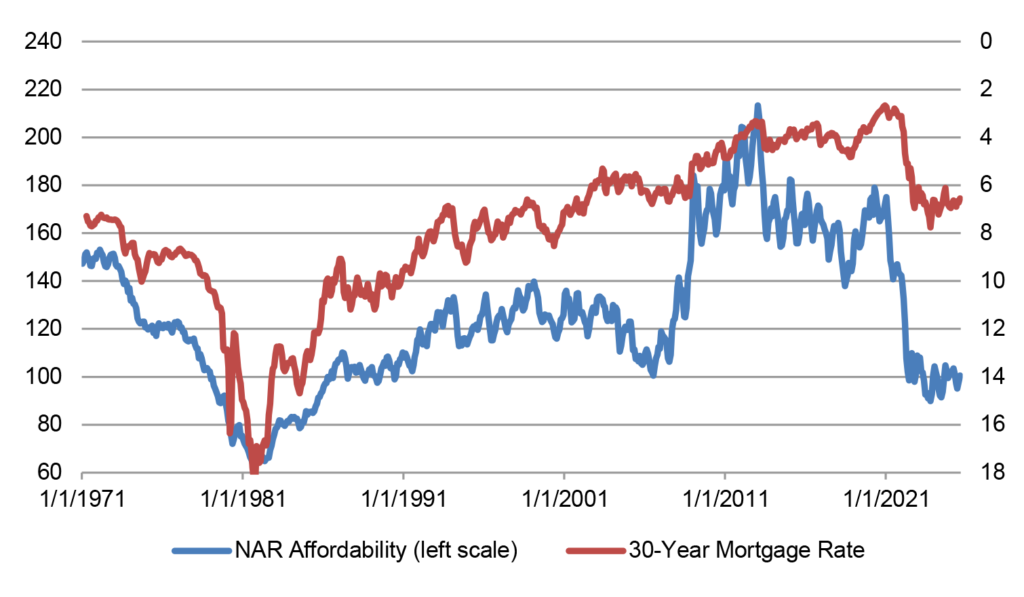
Source: NAR, Freddie Mac.
Current conditions
The post-pandemic period has been a particularly difficult one for housing affordability. Households have been squeezed by a double whammy: mortgage rates shot up when the Fed had to sharply raise its policy rate to tamp down inflation at the same time that home prices were surging. Affordability fell below 100 for the first time since the mid-1980s, a period when mortgage rates were still in the teens. For perspective, the historical average for the NAR Affordability Index is 126.
The Affordability Index averaged 97.6 in 2023 and 98.8 in 2024. There have been a few relatively modest swings in affordability so far in 2025. Affordability improved early in the year, when mortgage rate slid from almost 7% at the turn of the year to an average of 6.64% in March. Affordability improved by close to 5%, rising to as high as 103.5 in March. Then, once it became evident that expectations of aggressive Fed easing in early 2025 would not come to fruition, mortgage rates backed up, returning to nearly 7%, and affordability slid to a low of 95.1 in June. Since then, mortgage rates have declined again, nudging the Affordability Index back up to 100.5 in August (the September reading will presumably inch up further but was not yet available as of this writing).
The main takeaway is that while affordability has improved at the margin in recent months, it remains poor by historical standards, around 25% lower than the all-time average, and has not moved by enough to plausibly anticipate a sharp revival in demand.
The relationship between the NAR Affordability Index and home sales over the past decade, not surprisingly, is tight (Exhibit 3). The chart shows that the modest improvement in affordability seen through August should be expected to drive only a slight rise in home sales. In fact, the uptick in combined new and existing home sales from a 4.6 million unit annualized pace in June to a 4.8 million unit clip in August may be close to the entirety of what we can expect to see unless affordability rises noticeably further going forward.
Exhibit 3: Affordability Index and Combined New and Existing Home Sales
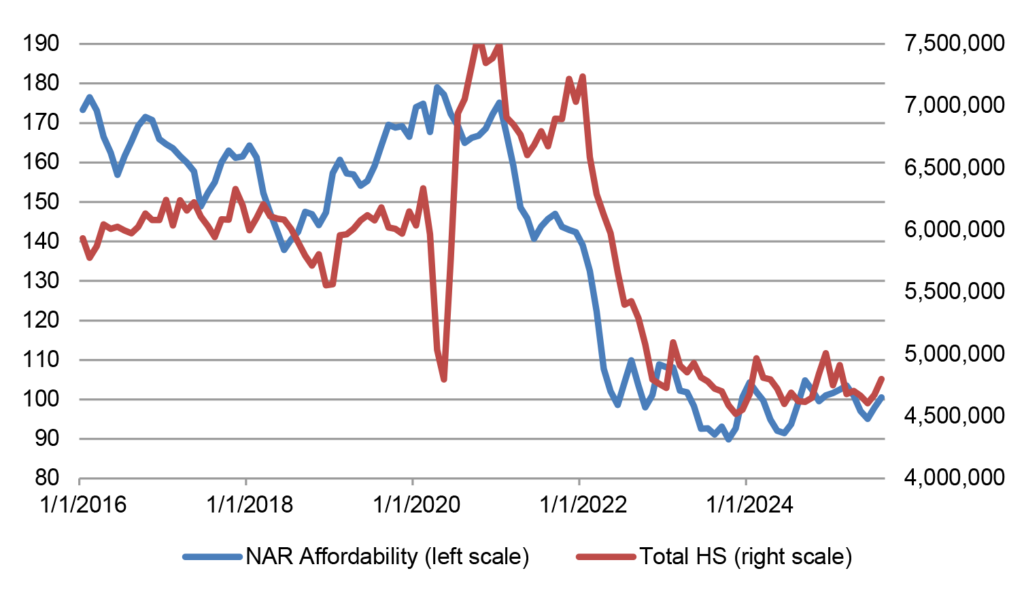
Source: NAR, Census Bureau.
This material is intended only for institutional investors and does not carry all of the independence and disclosure standards of retail debt research reports. In the preparation of this material, the author may have consulted or otherwise discussed the matters referenced herein with one or more of SCM’s trading desks, any of which may have accumulated or otherwise taken a position, long or short, in any of the financial instruments discussed in or related to this material. Further, SCM may act as a market maker or principal dealer and may have proprietary interests that differ or conflict with the recipient hereof, in connection with any financial instrument discussed in or related to this material.
This message, including any attachments or links contained herein, is subject to important disclaimers, conditions, and disclosures regarding Electronic Communications, which you can find at https://portfolio-strategy.apsec.com/sancap-disclaimers-and-disclosures.
Important Disclaimers
Copyright © 2026 Santander US Capital Markets LLC and its affiliates (“SCM”). All rights reserved. SCM is a member of FINRA and SIPC. This material is intended for limited distribution to institutions only and is not publicly available. Any unauthorized use or disclosure is prohibited.
In making this material available, SCM (i) is not providing any advice to the recipient, including, without limitation, any advice as to investment, legal, accounting, tax and financial matters, (ii) is not acting as an advisor or fiduciary in respect of the recipient, (iii) is not making any predictions or projections and (iv) intends that any recipient to which SCM has provided this material is an “institutional investor” (as defined under applicable law and regulation, including FINRA Rule 4512 and that this material will not be disseminated, in whole or part, to any third party by the recipient.
The author of this material is an economist, desk strategist or trader. In the preparation of this material, the author may have consulted or otherwise discussed the matters referenced herein with one or more of SCM’s trading desks, any of which may have accumulated or otherwise taken a position, long or short, in any of the financial instruments discussed in or related to this material. Further, SCM or any of its affiliates may act as a market maker or principal dealer and may have proprietary interests that differ or conflict with the recipient hereof, in connection with any financial instrument discussed in or related to this material.
This material (i) has been prepared for information purposes only and does not constitute a solicitation or an offer to buy or sell any securities, related investments or other financial instruments, (ii) is neither research, a “research report” as commonly understood under the securities laws and regulations promulgated thereunder nor the product of a research department, (iii) or parts thereof may have been obtained from various sources, the reliability of which has not been verified and cannot be guaranteed by SCM, (iv) should not be reproduced or disclosed to any other person, without SCM’s prior consent and (v) is not intended for distribution in any jurisdiction in which its distribution would be prohibited.
In connection with this material, SCM (i) makes no representation or warranties as to the appropriateness or reliance for use in any transaction or as to the permissibility or legality of any financial instrument in any jurisdiction, (ii) believes the information in this material to be reliable, has not independently verified such information and makes no representation, express or implied, with regard to the accuracy or completeness of such information, (iii) accepts no responsibility or liability as to any reliance placed, or investment decision made, on the basis of such information by the recipient and (iv) does not undertake, and disclaims any duty to undertake, to update or to revise the information contained in this material.
Unless otherwise stated, the views, opinions, forecasts, valuations, or estimates contained in this material are those solely of the author, as of the date of publication of this material, and are subject to change without notice. The recipient of this material should make an independent evaluation of this information and make such other investigations as the recipient considers necessary (including obtaining independent financial advice), before transacting in any financial market or instrument discussed in or related to this material.
Important disclaimers for clients in the EU and UK
This publication has been prepared by Trading Desk Strategists within the Sales and Trading functions of Santander US Capital Markets LLC (“SanCap”), the US registered broker-dealer of Santander Corporate & Investment Banking. This communication is distributed in the EEA by Banco Santander S.A., a credit institution registered in Spain and authorised and regulated by the Bank of Spain and the CNMV. Any EEA recipient of this communication that would like to affect any transaction in any security or issuer discussed herein should do so with Banco Santander S.A. or any of its affiliates (together “Santander”). This communication has been distributed in the UK by Banco Santander, S.A.’s London branch, authorised by the Bank of Spain and subject to regulatory oversight on certain matters by the Financial Conduct Authority (FCA) and the Prudential Regulation Authority (PRA).
The publication is intended for exclusive use for Professional Clients and Eligible Counterparties as defined by MiFID II and is not intended for use by retail customers or for any persons or entities in any jurisdictions or country where such distribution or use would be contrary to local law or regulation.
This material is not a product of Santander´s Research Team and does not constitute independent investment research. This is a marketing communication and may contain ¨investment recommendations¨ as defined by the Market Abuse Regulation 596/2014 ("MAR"). This publication has not been prepared in accordance with legal requirements designed to promote the independence of research and is not subject to any prohibition on dealing ahead of the dissemination of investment research. The author, date and time of the production of this publication are as indicated herein.
This publication does not constitute investment advice and may not be relied upon to form an investment decision, nor should it be construed as any offer to sell or issue or invitation to purchase, acquire or subscribe for any instruments referred herein. The publication has been prepared in good faith and based on information Santander considers reliable as of the date of publication, but Santander does not guarantee or represent, express or implied, that such information is accurate or complete. All estimates, forecasts and opinions are current as at the date of this publication and are subject to change without notice. Unless otherwise indicated, Santander does not intend to update this publication. The views and commentary in this publication may not be objective or independent of the interests of the Trading and Sales functions of Santander, who may be active participants in the markets, investments or strategies referred to herein and/or may receive compensation from investment banking and non-investment banking services from entities mentioned herein. Santander may trade as principal, make a market or hold positions in instruments (or related derivatives) and/or hold financial interest in entities discussed herein. Santander may provide market commentary or trading strategies to other clients or engage in transactions which may differ from views expressed herein. Santander may have acted upon the contents of this publication prior to you having received it.
This publication is intended for the exclusive use of the recipient and must not be reproduced, redistributed or transmitted, in whole or in part, without Santander’s consent. The recipient agrees to keep confidential at all times information contained herein.


