


The Big Idea
One more underlying inflation gauge
Stephen Stanley | October 3, 2025
This material is a Marketing Communication and does not constitute Independent Investment Research.
Some might argue that the last thing the world needs is another alternative inflation measure, but that is exactly what I am going to offer. With tariffs distorting the goods component of core inflation indices, policymakers and financial market participants have increasingly focused on core services, or portions of it, as a superior gauge of underlying inflation. This piece offers a refinement, excluding the volatile airfare and hotel rate components, which tend to gyrate wildly. By that basis, it is difficult to argue that inflation is close to returning to the FOMC’s 2% target.
Finding a benchmark period
One starting point for measuring various components and alternatives for inflation is finding the proper benchmark period. It is straightforward to say that if we are using headline or core inflation, then the proper goal is 2%, the Fed’s inflation target. However, if we focus on, for example, core services inflation, then the proper target is less obvious. Typically, to get to 2% overall inflation, core services inflation can run considerably higher because core goods prices have tended to run flat to slightly negative over time.
Fed officials often compare current measures against periods when inflation ran reasonably close to 2%. For example, in her September 30 speech, Boston Fed President Collins noted that core inflation averaged close to 2% over the 2001-2007 period. Another candidate would be 2016-2019, when core inflation ran slightly below target but not by a wide margin.
It helps to compare these two periods to current figures for a rough gauge of what might be a pace of core services inflation consistent with 2% inflation (Exhibit 1).
Exhibit 1: Core Inflation Metrics
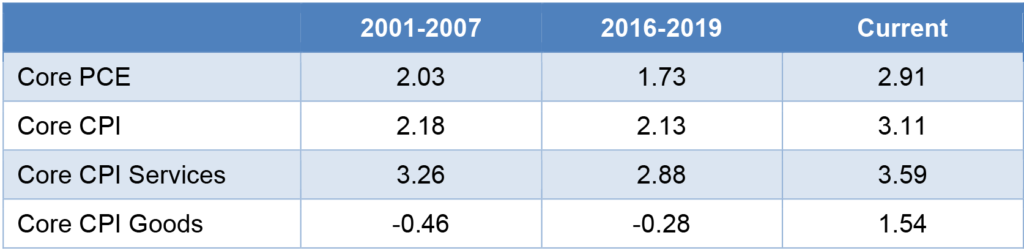
Source: BEA, BLS.
President Collins is correct that the core PCE deflator averaged almost exactly 2% from 2001 to 2007. I am a little dubious of choosing a period when inflation was trending, as opposed to steady. From 2001 to 2007, inflation ran modestly below 2% in the early part of the span and accelerated to moderately above 2% in the last few years. Nonetheless, this is not a terrible starting point. Core CPI goods prices fell over the seven years on average by about 0.5% per year and core CPI services prices rose by around 3.25% per year.
Over the four years through 2019, core PCE inflation ran at a 1.73% annual pace, about a quarter of a percentage point below target. Core CPI goods prices were slightly negative, while core CPI services prices rose by 2.9%.
These two periods suggest that a proper range for core CPI services inflation is somewhere in the neighborhood of 3%, assuming that we can expect goods prices to gently fall over time.
A clear problem for President Collins and other doves who are pushing a benign narrative for inflation is that the current numbers do not line up with either of those two periods. Core CPI services inflation over the past 12 months has been 3.6%, not terribly distant from our 2%-consistent levels, but far enough above to suggest that we have not arrived yet in our journey back down to a 2% inflation trend.
Picking the proper parts of core services
One tweak that Fed officials have been making for several years now is to exclude shelter costs from the rest of core services. The original rationale for this framework, which was introduced by Chair Powell back in 2022, was that shelter costs were surging at a steep rate but were widely expected to cool, reflecting the long lags between market-based rents and the rent and owners’ equivalent rent (OER) categories in the CPI. Though one might still make the case that shelter costs could decelerate further from here, in light of softening rent gauges this year, the fact is that shelter costs are no longer pushing core services inflation higher by a meaningful amount. In August, rent and OER posted year-over-year advances of 3.5% and 4.0%, respectively, not much different than the 3.6% increase for overall core services. I am not going to bother with the “supercore” variant of core services ex-housing. In my view, this diversion is no longer necessary and not particularly helpful.
However, there is a small tweak that I view as worth considering. Those who have followed my CPI recap pieces for any length of time are quite familiar with my Fearsome Five formulation. I have long argued that it is helpful to exclude the five most volatile categories within the core CPI when assessing the underlying trend.
I would extend this concept to the analysis of core services prices. Two of the Fearsome Five are services categories, airfares and hotel rates. Both of these line items tend to swing wildly up and down over time, reflecting big shifts in the demand for travel. I believe that, rather than excluding shelter costs, we would be far better off excluding these two line items from core services inflation to get a better read on the underlying trend. Another advantage to this approach is that it leaves most of the core services index intact. Shelter costs represent the largest component by far in the core CPI (over 40% of the total) and one of the largest chunks of the core PCE deflator (almost 20%), but airfares and hotel rates carry modest weights (combined, about 2.5% of the core CPI), even though they often have outsized impacts on the broader gauges.
Over a longer period of time, the swings in airfares and hotel rates tend to even out. As a result, there is not much difference between the core CPI services (CS) gauge and the core services excluding travel (CSXT) measure over the multi-year periods referenced above. For 2001-2007, the averages are 3.26% for CS and 3.26% for CSXT. For 2016-2019, the figures are 2.88% and 2.96%, respectively.
However, over shorter periods of time, a big swing in travel prices can distort the broader aggregates. For all of the talk about tariffs producing price hikes for imported goods, that effect has been slow in coming and less than generally expected so far. Ironically, I would argue that the one area in which the Trump Administration’s trade policies had an immediate and powerful impact on inflation was in the travel sector, and the effect was in the opposite direction. Foreign travel demand into the U.S. plunged early this year, contributing to a cumulative 15% plunge in airfares from February through June and a drop of nearly 10% in hotel rates from March through July.
Airfares have since rebounded and are running up 3.3% year-over-year through August, but hotel rates are down by 3.7% over the past 12 months. Given the modest weights, the impact on the year-over-year core services figures is limited. CS rose year-over-year by 3.6%, while CSXT advanced by 3.7%.
However, this masks sharp shifts within the last year. Dovish Fed officials with great fanfare have celebrated the deceleration in core services inflation so far this year. However, much of the apparent improvement reflects the softness in travel demand that is not a sustainable basis for getting to a 2% inflation trend.
The year-to-date figures through August, accounting for the first two-thirds of the year, show the significance of the travel sector. The core CPI services index posted a 12-month advance of 4.41% in December of 2024 and rose at an annualized pace of 3.51% so far this year, a slowdown of 90 bp, bringing the figure to within around half a percentage point of our goal based on historical averages. However, the core CPI services ex-travel measure advanced by 4.35% in the 12 months of 2024 and decelerated to a 3.86% pace in the first eight months of 2025, a moderation of only 49 bp, and much further from our 3% sweet spot.
Indeed, the experience of the past two months underscores the unsustainability of the moderation in the first half of the year. In July and August, airfares surged by 4.0% and 5.9%, respectively, driving monthly core services inflation higher. The CPI core services measure, benefiting from falling travel costs, posted monthly rises of 0.25%, 0.11%, 0.29%, 0.17%, and 0.25% from February through June, working out to a 2.6% annualized pace. Those making the case for benign inflation were understandably touting those figures. However, with airfares and hotel rates rebounding this summer, the core CPI services gauge rose by 0.36% in July and 0.35% in August, an annualized pace of 4.3%. Chicago Fed President Goolsbee, among others, has expressed concern over the reacceleration of core services in recent months (evidence that he and many other policymakers are watching the wrong metric!).
In contrast, since the beginning of the year, the CSXT monthly readings have been 0.48%, 0.31%, 0.27%, 0.34%, 0.22%, 0.33%, 0.34%, and 0.23%, a much smoother set of readings, reflecting the removal of the two erratic line items.
The bottom line is that neither the core CPI services gauge, running at a 3.5% annualized pace year to date, nor the core CPI services ex-travel, running at 3.9% year to date, is low enough yet to be consistent with 2% core inflation. However, the latter, the more reliable of the two, is running nearly half a percentage point higher so far this year and has decelerated far less, suggesting that the progress toward 2% is substantially less than meets the eye and certainly insufficient to allow the FOMC to let down its guard on inflation just yet.