


The Big Idea
A strong consumer with pockets of weakness
Stephen Stanley | September 19, 2025
This material is a Marketing Communication and does not constitute Independent Investment Research.
There is increasing concern that the economy is no longer working for everyone. A recent Wall Street Journal article entitled “Divergent American Economy Gets More Divided” reported that while upper-income households are thriving, trouble is brewing for others that have largely missed the surge in recent years in home and asset prices and are at risk if the labor market weakens further. While there are undoubtedly concerns at the lower end of the income scale, the Federal Reserve’s latest quarterly Financial Accounts of the United States, released September 11 and covering the second quarter of 2025, confirmed that household balance sheets in aggregate remain unusually strong.
Debt loads are light
When assessing the health of the consumer, a good place to start is the overall level of household debt. As a percentage of GDP, household debt fell in the second quarter for the 16th straight quarter, reaching its lowest reading in over 25 years (Exhibit 1). The series has fallen well below the trend established from 1970 through 2000. It slipped below 70% in the fourth quarter for the first time since 2000 and has continued to slide since.
Exhibit 1: Household debt-to-GDP ratio
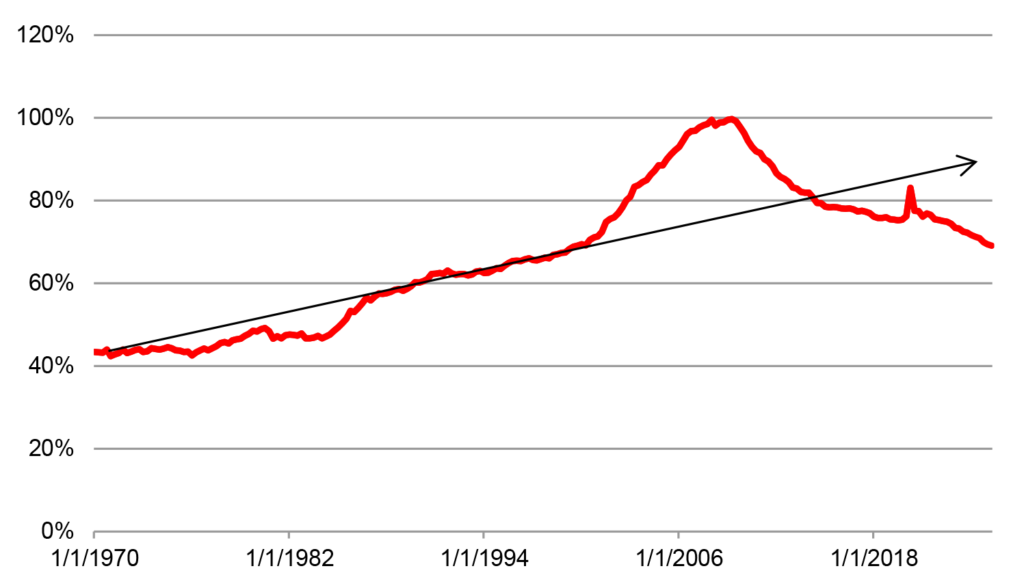
Source: BEA, Federal Reserve.
A similar way to assess the scale of household debt is to compare it to disposable income. This ratio also slid again in the second quarter, the 11th drop in the past 12 quarters and reached its lowest level since 1998, aside from some distorted readings during the pandemic (Exhibit 2).
Exhibit 2: Household debt-to-disposable income ratio
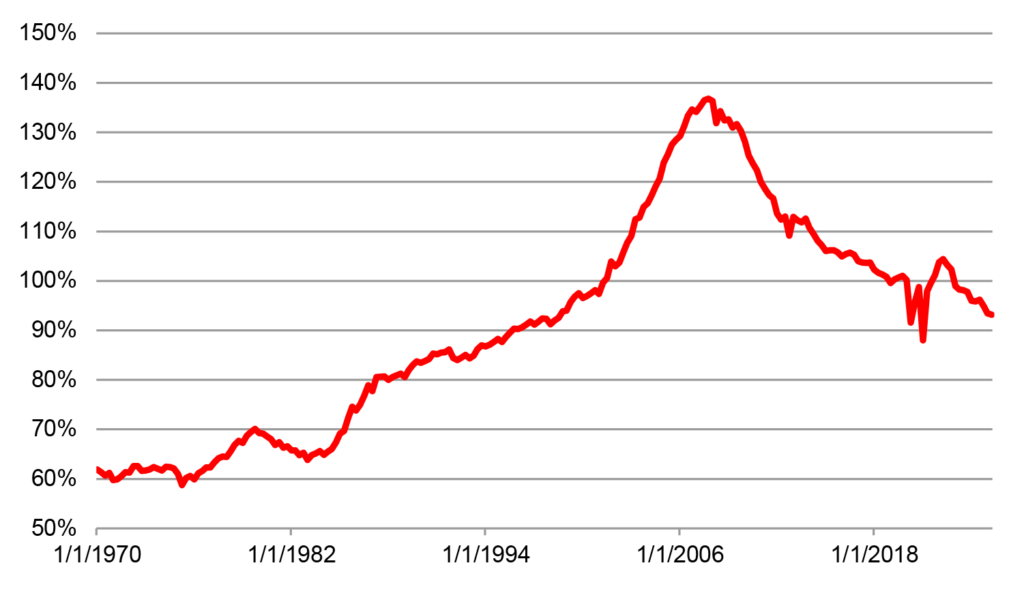
Source: BEA, Federal Reserve.
The bottom line is that, while individual households may be struggling with debt, households in the aggregate have extraordinarily light debt relative to the size of the economy or to their income.
Debt service burden
In a separate report, the Federal Reserve publishes estimates of the debt service burden, defined as the percentage of disposable income needed to stay current on debt payments. With interest rates surging since early 2022, one might imagine that even for a constant level of debt, the servicing burden of that borrowing would have risen sharply. However, the Fed data show that the debt service burden remains slightly below 2019 levels—11.2% in the second quarter compared to 11.5% to 11.7% in 2019. In fact, the measure is lower than at any time before the pandemic going back to 2005 (Exhibit 3).
This is a testament to the prevalence of fixed rate debt held by households, most notably for mortgages. However, it is more than that. Even the debt service burden for consumer credit sat at 5.4% in Q2, vs. 5.7% to 5.8% in 2019. Given that this component includes auto loans, student loans, and the required payments on credit cards, it should be far more sensitive to higher interest rates than the mortgage component. And yet, though it has risen from its post-Covid lows (when, by the way, student loans were in a government-imposed payment moratorium), it has not even returned to pre-Covid levels much less increased above that range, even as borrowing rates are far higher than in the late 2010s.
Exhibit 3: Debt service burden
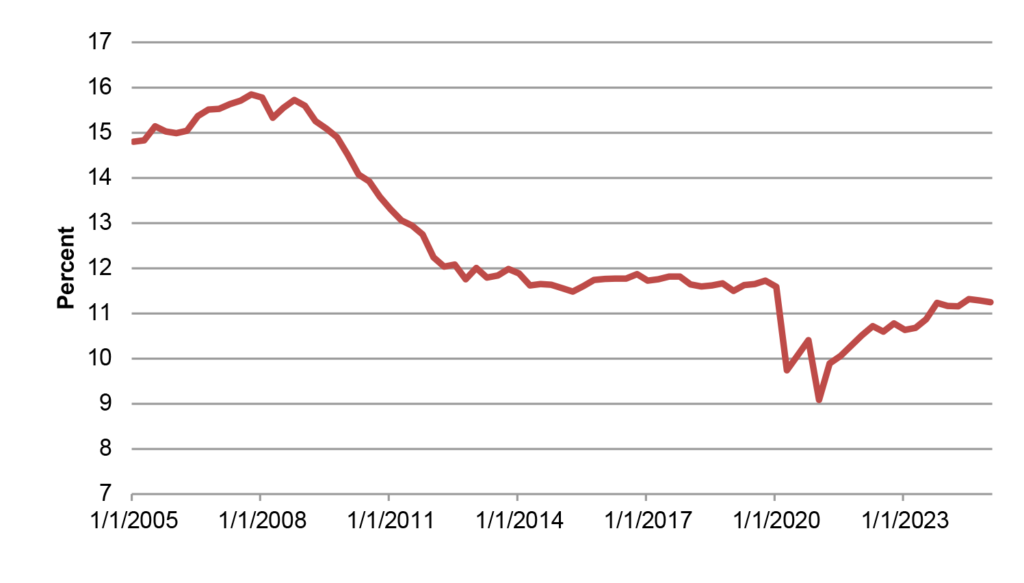
Source: Federal Reserve.
Household assets
The Fed’s latest Financial Accounts show that the value of household assets exploded higher by more than $7 trillion in the second quarter to $197.3 trillion, easily reversing the $1.7 trillion decline in the first quarter. For the first half of the year, household assets have risen by 2.9% (not annualized) from the end of 2024. Household net worth also jumped by $7 trillion in the second quarter.
Tying household balance sheets back to consumer spending, there is an important point to be made. The Fed’s restrictive monetary policy has made it more difficult for households to liquify their soaring asset values, as high interest rates and relatively tight lending standards have made it difficult for households to tap what for many is their largest asset: their homes. In the 2000s, at the drop of a hat, homeowners could execute a cash-out refinancing when their home values shot up. With mortgage rates so much higher than before and during the pandemic, this is not a desirable option for most mortgage holders.
One indication of this dynamic is a measure that the Fed reports on in the Financial Accounts each quarter: owners’ equity as a percentage of real estate values. Throughout 2024 and the first half of 2025, this measure has hovered between 72% and 73%, the highest readings since the late 1950s (Exhibit 4). During the 2000s, even as home prices were soaring, homeowners were tapping their equity so fast that their ownership stake was actually falling. In contrast, the gauge has jumped by more than 7% since the end of 2019.
Exhibit 4: Owners’ equity as a percentage of real estate values
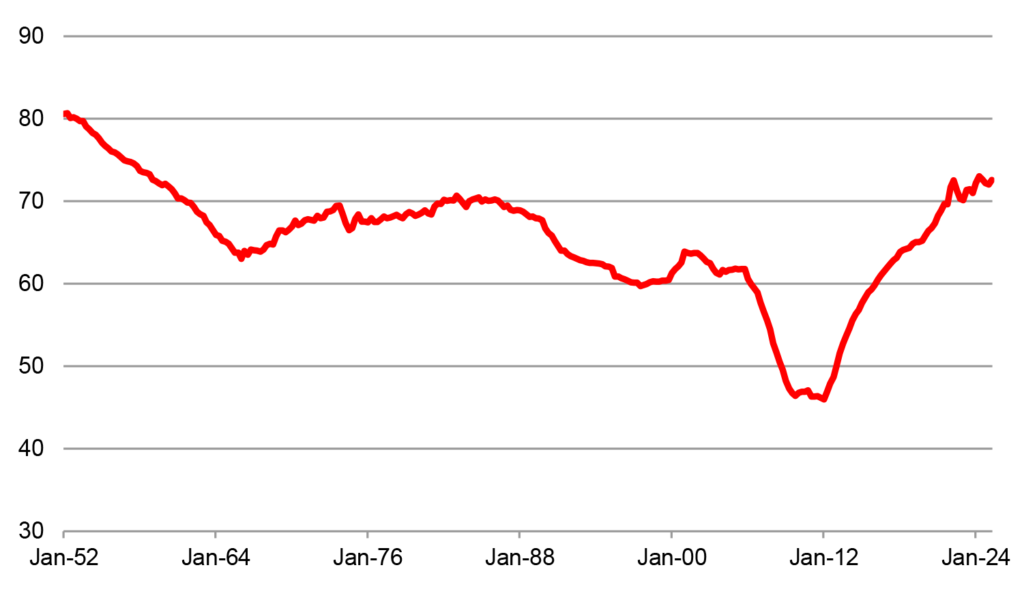
Source: Federal Reserve.
While balance sheets are historically strong, the marginal impact of rising net worth on consumer spending, what economists call the “wealth effect,” has likely been far more limited than it might have been under a different interest rate profile.
Household liquid assets
Given the windfall that households received during the pandemic, I have closely tracked in recent years the evolution of household liquid assets. This series covers the portion of the balance sheet that represents cash equivalents and includes currency, bank deposits, and money market fund shares. I have emphasized this measure is a proxy for spendable funds.
Household liquid assets spiked during the pandemic, reflecting in large part the unprecedented waves of federal government largesse. Most economists presumed that consumers would spend down those balances quickly once the economy fully reopened. However, liquid assets have remained elevated by historical standards (Exhibit 5).
Exhibit 5: Household liquid assets
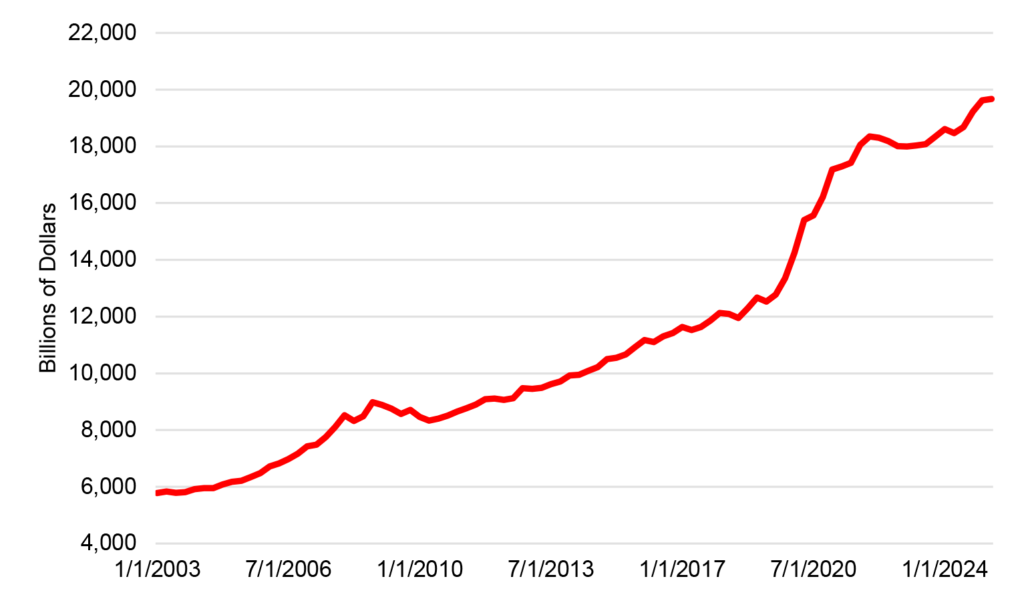
Source: Federal Reserve.
To be fair, a significant portion of the increase in spending power represented by these liquid assets has been eroded by inflation. The level of prices, as measured by the PCE deflator, has risen by over 21% since the end of 2019 (Exhibit 6).
Exhibit 6: Real household liquid assets
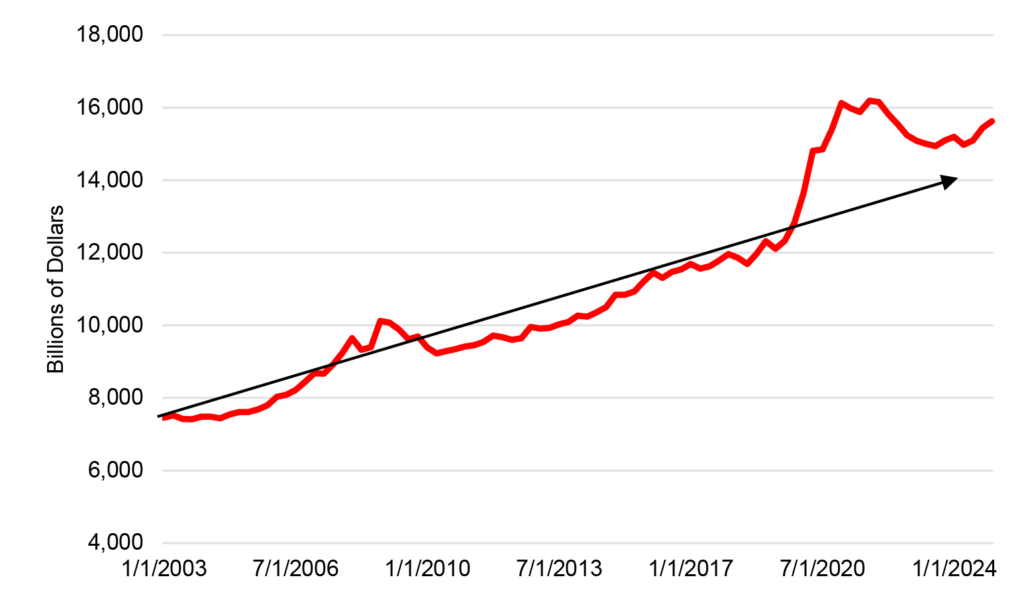
Source: Federal Reserve.
The exhibit shows that the series was most of the way back to the trend line by the middle of 2023. After that, real liquid assets resumed growth, suggesting that households viewed their cash positions as back to “normal.” Presumably, if they were sitting on elevated liquidity that they intended to spend, the series would have continued to decline.
Over the past two years, however, if anything, the growth in real household liquid assets has outpaced the pre-pandemic trend. As of mid-2025, the level of this measure, at $15.6 trillion, sat about $800 billion, or roughly 5%, higher than if the trend rate of growth seen over the decade prior to the pandemic had continued going forward from the end of 2019.
While the main driver of consumer spending going forward is likely to be the pace of income growth, household balance sheets continue to indicate that consumers have plenty of spending power available to them.
Fraying at the edges
While the aggregate household figures remain robust, some, especially at the lower end of the income scale, have begun to struggle somewhat under the weight of the surge in prices seen over the past several years. The Wall Street Journal article explores this theme at length. Other metrics confirm the diverging fortunes of high-income and low-income households. An analysis by Moody’s Analytics cited in the article estimates that the top 10% of households by income, those earning $250,000 a year or more, accounted for 49.2% of consumer spending in the second quarter, up from 45.7% a decade ago.
Economists at the Bank of America Institute found last month that year-over-year after-tax labor income growth has been decelerating for lower-income households and picking up for higher-income households. In July, the figures were 1.3% and 3.2%, respectively, the widest gap since early 2021. Analysts at the institute found that the growing divergence in pay has translated into the card spending of Bank of America customers. The lowest third of households by income recorded flat year-over-year card spending per household, while the middle and upper thirds posted 1.0% and 1.8% gains, respectively, both up from a few months ago. Still, the Bank of America data do not point to acute stress, as lower-income households have not cut back on discretionary spending, are not returning goods at a higher rate than before, and continue to hold higher inflation-adjusted deposit balances than in 2019.
Analysts frequently cite rising credit card and auto loan delinquencies as evidence of financial stress. A careful examination of the credit card payment data suggests little reason for alarm, at least based on 30- and 90-day or longer credit card delinquencies for a group of servicers including Amex, Bank of America, Capital One, Chase, Citibank, and Discover (Exhibit 7, Exhibit 8). These data demonstrate that credit card delinquencies leveled off last year after rebounding from historically low levels during the pandemic but have actually fallen so far this year and remain below pre-Covid levels.
Exhibit 7: 30-day or longer credit card delinquencies
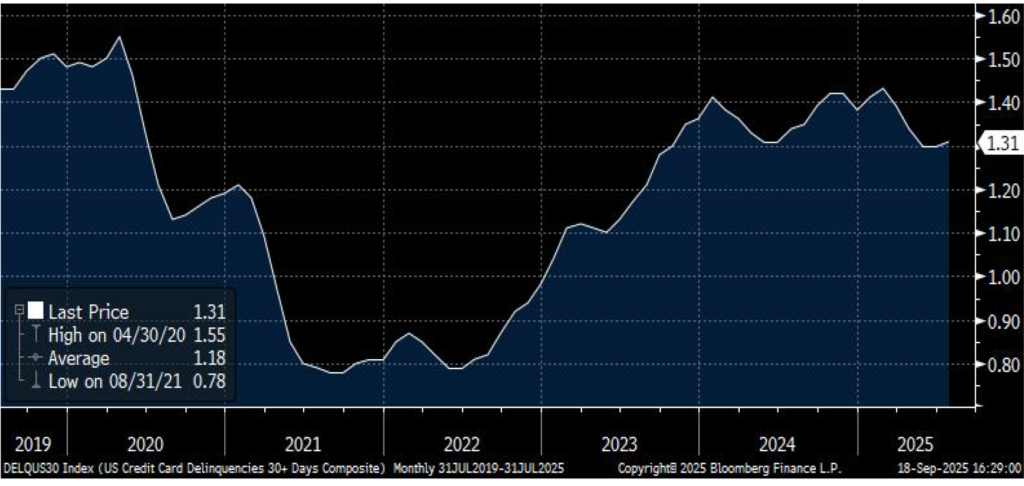
Source: Bloomberg.
Exhibit 8: 90-day or longer credit card delinquencies
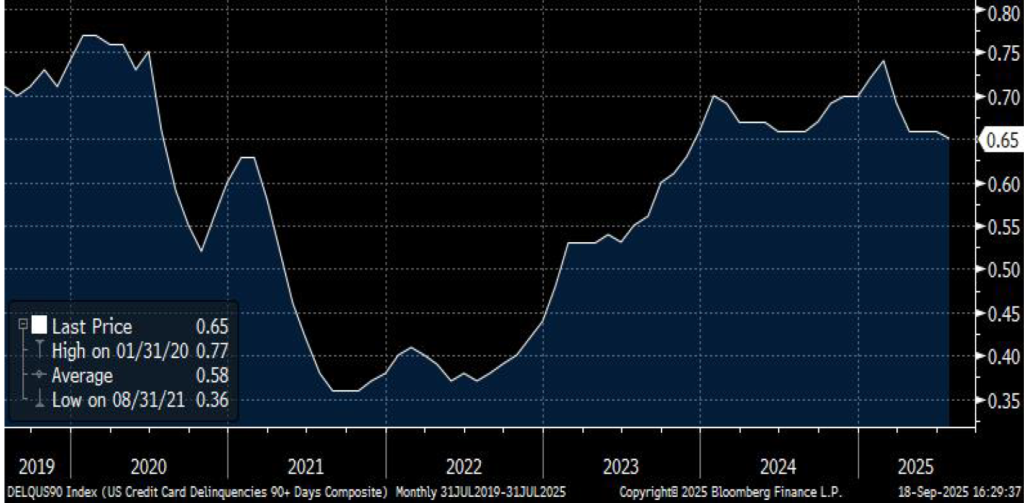
Source: Bloomberg.
The story is more troubling for auto loans as the delinquency rate has moved well above 2018-2019 levels (Exhibit 9). In addition, unlike credit card delinquencies, which have fallen back since the start of last year, this measure has merely leveled off at the highest readings since the Global Financial Crisis.
In my view, auto loans are a bit of a special case, hit by the perfect storm of a surge in used vehicle prices in 2021 and 2022, followed by price declines on balance since then. In other words, the particular issues faced for auto loans may be more indicative of what has transpired in the auto sector than a sign of broad acute stress for household finances. Still, for auto lenders and investors in that debt, this is a situation that warrants close scrutiny.
Exhibit 9: 90-day or longer auto loan delinquencies
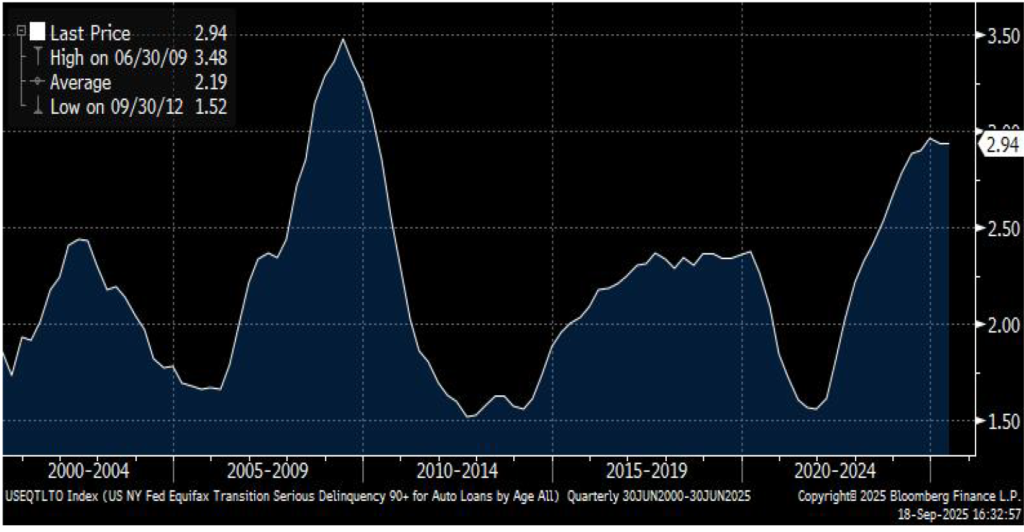
Source: NY Fed, Equifax, Bloomberg.
Finally, a recent analysis by the Santander US Capital Markets Strategy team shows that for mortgage loans, delinquency rates have surged for FHA loans, which tend to be taken mainly by lower-income households, while delinquency rates for conventional loans and prime jumbo mortgage loans have barely ticked up. These findings support the story that lower-income households are facing rising financial stress even as the majority of households remain in good shape.
Conclusion
The state of household finances is not perfect, but the latest aggregate data from the Fed confirm that, overall, balance sheets remain quite robust. Healthy finances should help to limit the stress for households as the labor market cools. Nevertheless, slowing real income growth, reflecting moderating job gains and the passthrough of higher tariffs to final goods prices, seems likely to at least temporarily restrain consumer spending advances in the near term. Moreover, even if the aggregate figures remain robust, lower-income households could face difficulty, especially if the labor market continues to cool.