By the Numbers
Big refi index jump caused by more than low rates
This material is a Marketing Communication and does not constitute Independent Investment Research.
Mortgage rates have dropped to the lowest level of 2025, pushing the risk of refinancing higher. One sign of this comes from the MBA’s refinance index, which has jumped nearly 80% since the end of August. The index is also about 40% higher than it reached last fall, even though mortgage rates are not as low as last year. The stronger response can be largely explained by changes in the composition of 30-year 6.0% and 6.5% coupons—they are much larger and more seasoned. The larger size brings more volume but not faster speeds. However, the added seasoning should lift speeds, particularly for’ loans originated after roughly April 2024.
The MBA refinance index has jumped to the highest level in the last two years (Exhibit 1). Each index—conventional, FHA, VA and total—is rescaled to 100 at the start of the series. The VA index is much higher than the conventional and FHA index, reflecting the stronger refinance response of these borrowers and the lower mortgage rate these borrowers receive when refinancing.
Exhibit 1. MBA refinance indices (rescaled to 100 two years ago)
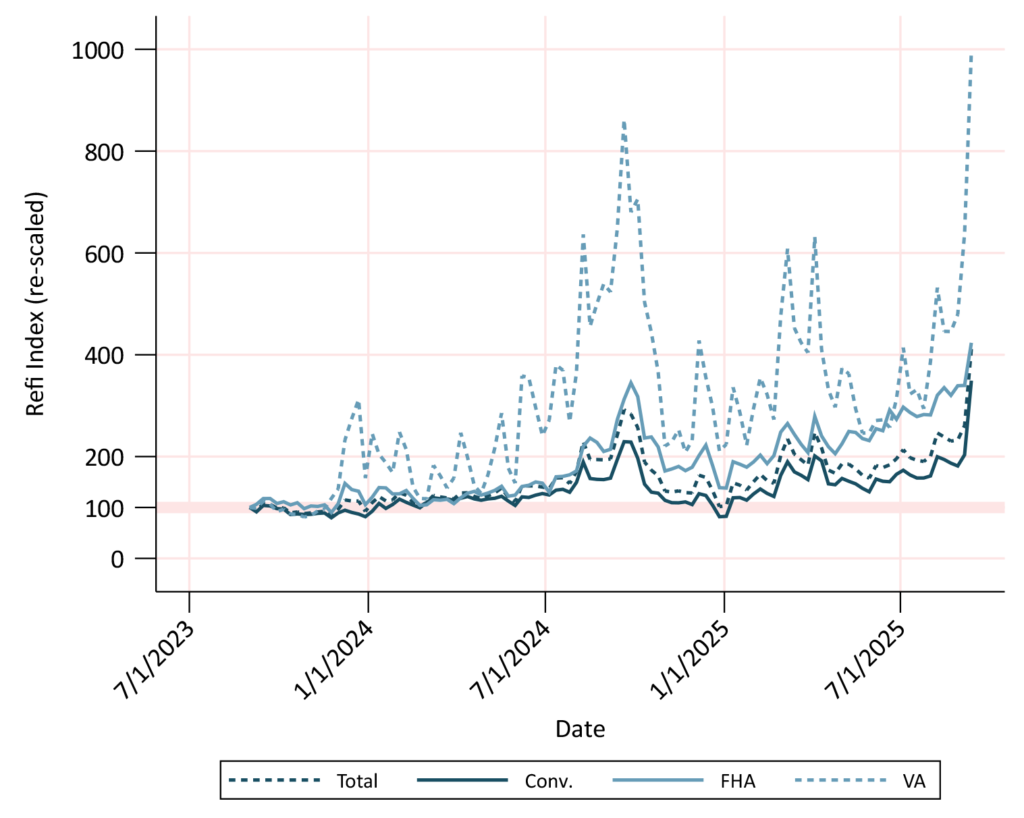
Source: Mortgage Bankers Association, Bloomberg, Santander US Capital Markets.
The refinance index is up because mortgage rates have dropped (Exhibit 2). However, conventional, FHA and VA rates were each lower in September 2024. But the refinance response is stronger today.
Exhibit 2. Primary mortgage rates
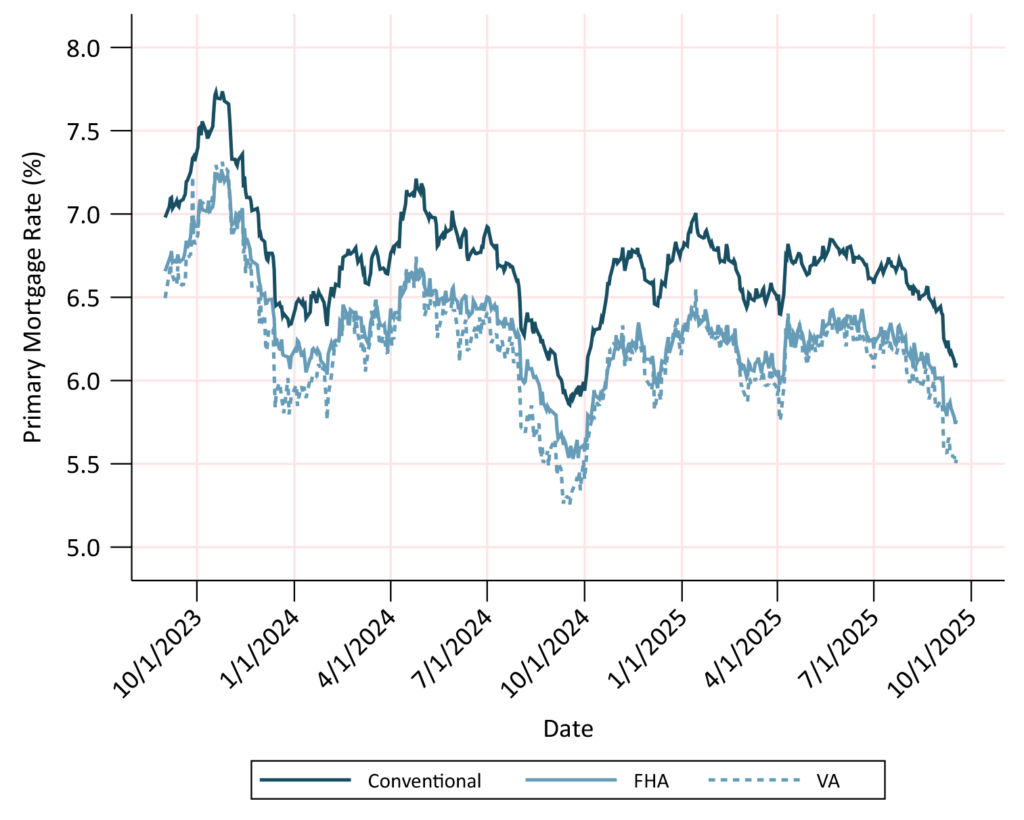
Mortgage rate calculated using rate lock data from Optimal Blue and an adjustment to calibrate to observed loan originations. Conventional rates are based off the FICO≥740, Orig LTV≤80 index.
Source: Optimal Blue, Fannie Mae, Freddie Mac, Ginnie Mae, Santander US Capital Markets.
One reason the refinance index is higher than one year ago is that the in-the-money coupons are larger. The 30-year 6.0% coupon, for example, is about 50% larger than it was last October. Overall, the in-the-money population is 20% larger even though mortgage rates are higher. That growth will contribute to greater refinancing volume and lift the refinance index. But it should not influence prepayment speeds.
However, speeds should be lifted by additional seasoning in the in-the-money coupons. Many loans were not seasoned enough to refinance quickly last fall. They should prepay much faster today after a year of extra seasoning. For example, the balance of loans in the 6.0% coupon that is at least six months seasoned has grown 75% over the last year.
In total, the balance of in-the-money loans that are at least six months seasoned has grown 44%. On a loan count basis—which is a better comparison to the refinance index—this population has grown 40%, which is in-line with the refi index increase from last fall to today.
Loans less than six months seasoned have been refinancing at roughly 50% of the pace of more seasoned loans (Exhibit 3). The two S-curves for loans less than 6-months seasoned are very similar, as are the S-curves for loans more than 6-months seasoned. Peaks speeds have been in the 9-to-18-month range. The added seasoning should lift speeds in affected cohorts compared to last year—specifically, loans originated after roughly April 2024. The 2023 vintage, and early 2024 issuance, should be less affected by the greater seasoning.
Exhibit 3. Newly originated loans have a muted refinance response
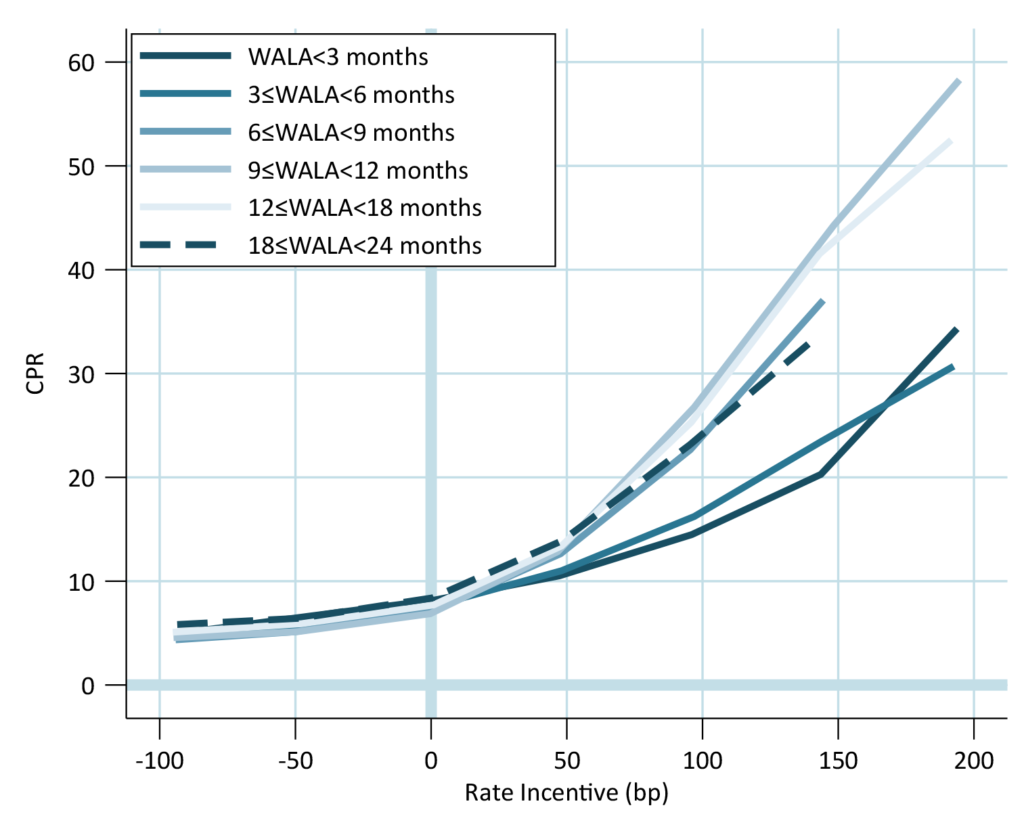
Fixed rate, 30-year, owner occupied, ≥700 FICO, ≤80 Original LTV. Performance from January 2023 to August 2025.
Source: Fannie Mae, Freddie Mac, Santander US Capital Markets.
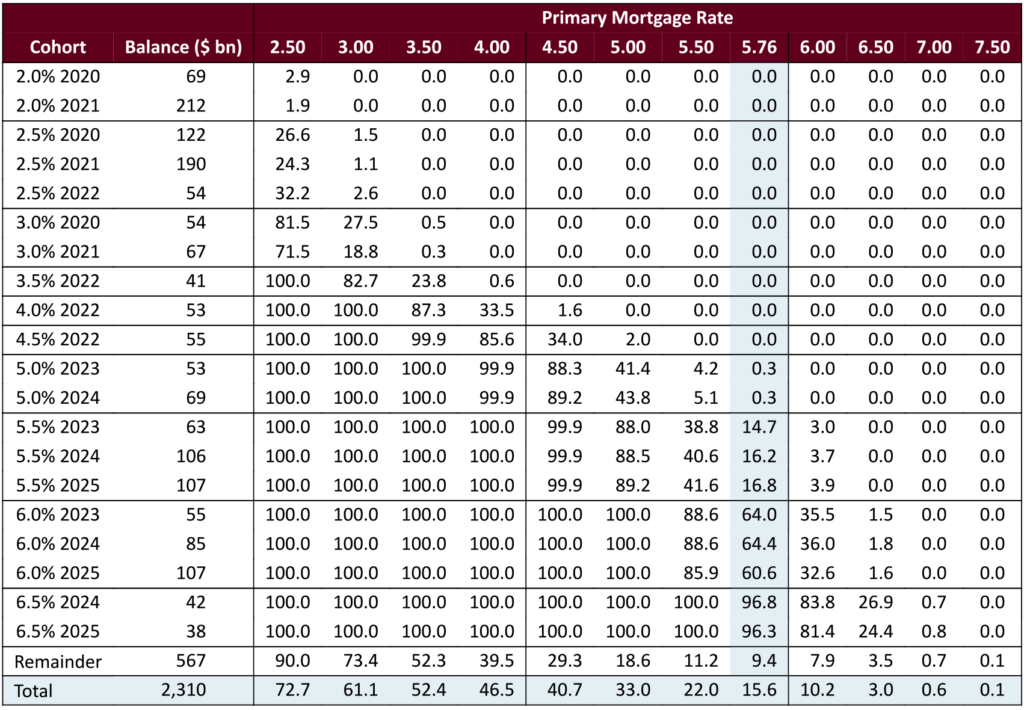
At current rates, the 5.5% cohorts are roughly 10% to 15% refinanceable (Exhibit 4). This uses a 75 bp threshold to determine moneyness, to pick out only loans that have a clear incentive to refinance. To be conservative it includes all loans regardless of seasoning. The 6%s are about half in-the-money, and higher coupons are almost fully in-the-money. Further rallies should have a much larger effect on speeds in 5.5%s and 6%s than on higher coupons.
Exhibit 4. Conventional 30-year % in-the-money by cohort
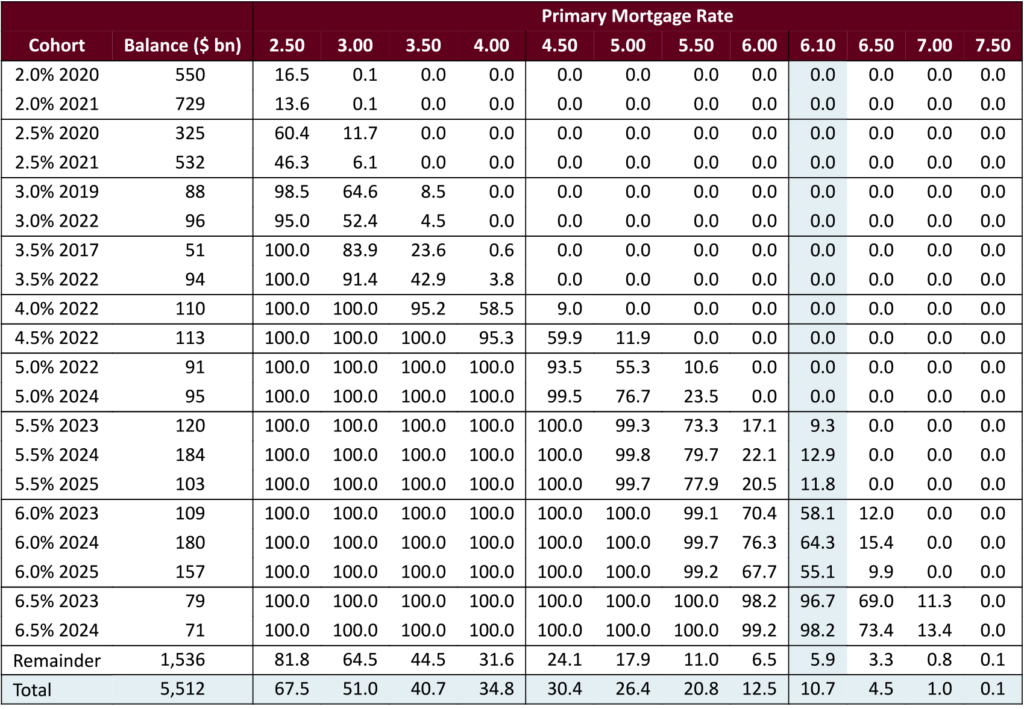
Loans must be at least 75 bp in-the-money.
Source: Fannie Mae, Freddie Mac, Santander US Capital Markets.
Ginnie Mae MBS tend to be somewhat more in-the-money than conventional MBS, since FHA and VA mortgage rates are lower than conventional (Exhibit 5). Partially offsetting this are higher gross coupons in conventional MBS compared to Ginnie Mae MBS. But expect a stronger prepayment response in Ginnie 5.5%s since more VA loans are in-the-money and those S-curves are much steeper.
Exhibit 5. Ginnie Mae 30-year % in-the-money by cohort
Loans must be at least 75 bp in-the-money.
Source: Ginnie Mae, Santander US Capital Markets.
This material is intended only for institutional investors and does not carry all of the independence and disclosure standards of retail debt research reports. In the preparation of this material, the author may have consulted or otherwise discussed the matters referenced herein with one or more of SCM’s trading desks, any of which may have accumulated or otherwise taken a position, long or short, in any of the financial instruments discussed in or related to this material. Further, SCM may act as a market maker or principal dealer and may have proprietary interests that differ or conflict with the recipient hereof, in connection with any financial instrument discussed in or related to this material.
This message, including any attachments or links contained herein, is subject to important disclaimers, conditions, and disclosures regarding Electronic Communications, which you can find at https://portfolio-strategy.apsec.com/sancap-disclaimers-and-disclosures.
Important Disclaimers
Copyright © 2026 Santander US Capital Markets LLC and its affiliates (“SCM”). All rights reserved. SCM is a member of FINRA and SIPC. This material is intended for limited distribution to institutions only and is not publicly available. Any unauthorized use or disclosure is prohibited.
In making this material available, SCM (i) is not providing any advice to the recipient, including, without limitation, any advice as to investment, legal, accounting, tax and financial matters, (ii) is not acting as an advisor or fiduciary in respect of the recipient, (iii) is not making any predictions or projections and (iv) intends that any recipient to which SCM has provided this material is an “institutional investor” (as defined under applicable law and regulation, including FINRA Rule 4512 and that this material will not be disseminated, in whole or part, to any third party by the recipient.
The author of this material is an economist, desk strategist or trader. In the preparation of this material, the author may have consulted or otherwise discussed the matters referenced herein with one or more of SCM’s trading desks, any of which may have accumulated or otherwise taken a position, long or short, in any of the financial instruments discussed in or related to this material. Further, SCM or any of its affiliates may act as a market maker or principal dealer and may have proprietary interests that differ or conflict with the recipient hereof, in connection with any financial instrument discussed in or related to this material.
This material (i) has been prepared for information purposes only and does not constitute a solicitation or an offer to buy or sell any securities, related investments or other financial instruments, (ii) is neither research, a “research report” as commonly understood under the securities laws and regulations promulgated thereunder nor the product of a research department, (iii) or parts thereof may have been obtained from various sources, the reliability of which has not been verified and cannot be guaranteed by SCM, (iv) should not be reproduced or disclosed to any other person, without SCM’s prior consent and (v) is not intended for distribution in any jurisdiction in which its distribution would be prohibited.
In connection with this material, SCM (i) makes no representation or warranties as to the appropriateness or reliance for use in any transaction or as to the permissibility or legality of any financial instrument in any jurisdiction, (ii) believes the information in this material to be reliable, has not independently verified such information and makes no representation, express or implied, with regard to the accuracy or completeness of such information, (iii) accepts no responsibility or liability as to any reliance placed, or investment decision made, on the basis of such information by the recipient and (iv) does not undertake, and disclaims any duty to undertake, to update or to revise the information contained in this material.
Unless otherwise stated, the views, opinions, forecasts, valuations, or estimates contained in this material are those solely of the author, as of the date of publication of this material, and are subject to change without notice. The recipient of this material should make an independent evaluation of this information and make such other investigations as the recipient considers necessary (including obtaining independent financial advice), before transacting in any financial market or instrument discussed in or related to this material.
Important disclaimers for clients in the EU and UK
This publication has been prepared by Trading Desk Strategists within the Sales and Trading functions of Santander US Capital Markets LLC (“SanCap”), the US registered broker-dealer of Santander Corporate & Investment Banking. This communication is distributed in the EEA by Banco Santander S.A., a credit institution registered in Spain and authorised and regulated by the Bank of Spain and the CNMV. Any EEA recipient of this communication that would like to affect any transaction in any security or issuer discussed herein should do so with Banco Santander S.A. or any of its affiliates (together “Santander”). This communication has been distributed in the UK by Banco Santander, S.A.’s London branch, authorised by the Bank of Spain and subject to regulatory oversight on certain matters by the Financial Conduct Authority (FCA) and the Prudential Regulation Authority (PRA).
The publication is intended for exclusive use for Professional Clients and Eligible Counterparties as defined by MiFID II and is not intended for use by retail customers or for any persons or entities in any jurisdictions or country where such distribution or use would be contrary to local law or regulation.
This material is not a product of Santander´s Research Team and does not constitute independent investment research. This is a marketing communication and may contain ¨investment recommendations¨ as defined by the Market Abuse Regulation 596/2014 ("MAR"). This publication has not been prepared in accordance with legal requirements designed to promote the independence of research and is not subject to any prohibition on dealing ahead of the dissemination of investment research. The author, date and time of the production of this publication are as indicated herein.
This publication does not constitute investment advice and may not be relied upon to form an investment decision, nor should it be construed as any offer to sell or issue or invitation to purchase, acquire or subscribe for any instruments referred herein. The publication has been prepared in good faith and based on information Santander considers reliable as of the date of publication, but Santander does not guarantee or represent, express or implied, that such information is accurate or complete. All estimates, forecasts and opinions are current as at the date of this publication and are subject to change without notice. Unless otherwise indicated, Santander does not intend to update this publication. The views and commentary in this publication may not be objective or independent of the interests of the Trading and Sales functions of Santander, who may be active participants in the markets, investments or strategies referred to herein and/or may receive compensation from investment banking and non-investment banking services from entities mentioned herein. Santander may trade as principal, make a market or hold positions in instruments (or related derivatives) and/or hold financial interest in entities discussed herein. Santander may provide market commentary or trading strategies to other clients or engage in transactions which may differ from views expressed herein. Santander may have acted upon the contents of this publication prior to you having received it.
This publication is intended for the exclusive use of the recipient and must not be reproduced, redistributed or transmitted, in whole or in part, without Santander’s consent. The recipient agrees to keep confidential at all times information contained herein.


