By the Numbers
What’s driving the tightening in MBS spreads?
This material is a Marketing Communication and does not constitute Independent Investment Research.
Current coupon MBS spreads recently touched the tightest levels of the past three years, tighter by roughly 25 bp since the beginning of the month. A more dovish Fed, a steeper yield curve, delta hedging needs and fund inflows look like clear drivers of recent MBS performance. But potential demand from the Fed and Fannie Mae and Freddie Mac are also important if more abstract catalysts for tighter MBS spreads.
Nominal MBS current coupon spreads closed at just 116 bp within the last week, a level last seen in a pronounced albeit brief tightening in August 2022. MBS spreads had been gradually grinding tighter as they tracked the post-Liberation Day drop in rate volatility. However, the recent gap tighter is likely fueled by more than just the lowest rate volatility readings in roughly three years (Exhibit 1).
Exhibit 1: Spreads tighten as volatility drops
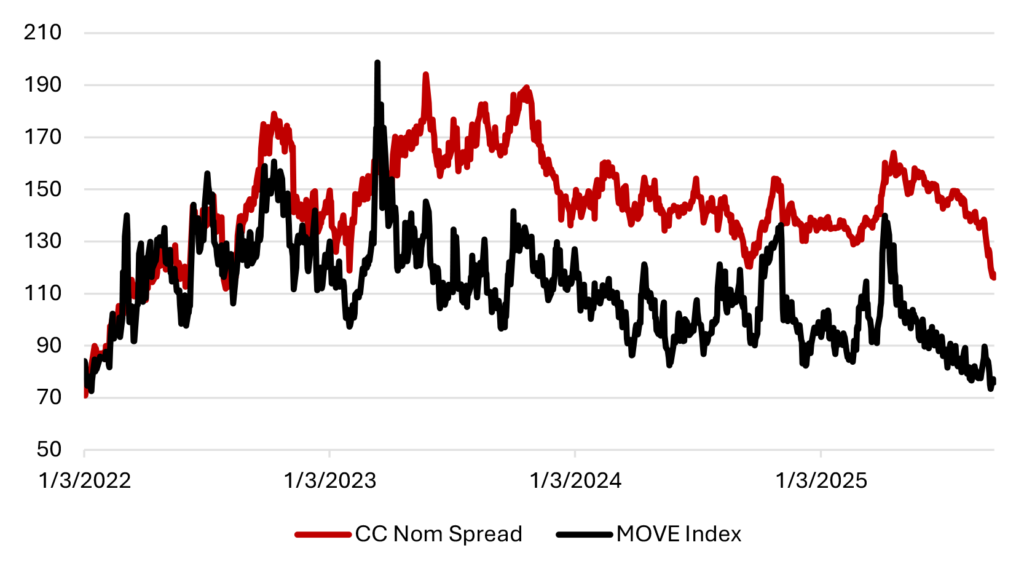
Source: Santander US Capital Markets, Bloomberg LP
A steeper curve should translate to more MBS buying…
At the September FOMC release, the 2025 median dot projection fell to 3.625%, implying 25 bp cuts in both October and December. The recasting of the dot plot was the culmination of market expectations that the Fed would cut three times this year. Some element of recent MBS tightening should be attributed to expectations that lower front-end rates will improve MBS carry and drive more demand from depositories and other levered investors like REITs and hedge funds. It is not difficult to draw a connection between the slope of the yield curve and bank demand for MBS as bank holdings of MBS tend to grow faster against a steeper yield curve and slower against a flatter one (Exhibit 2). Embedded in market-based expectations for a more dovish Fed is the underpinning assumption that a steeper curve and low levels of rate volatility creates somewhat of a Goldilocks scenario for MBS.
Exhibit 2: Banks buy more MBS against a steeper yield curve
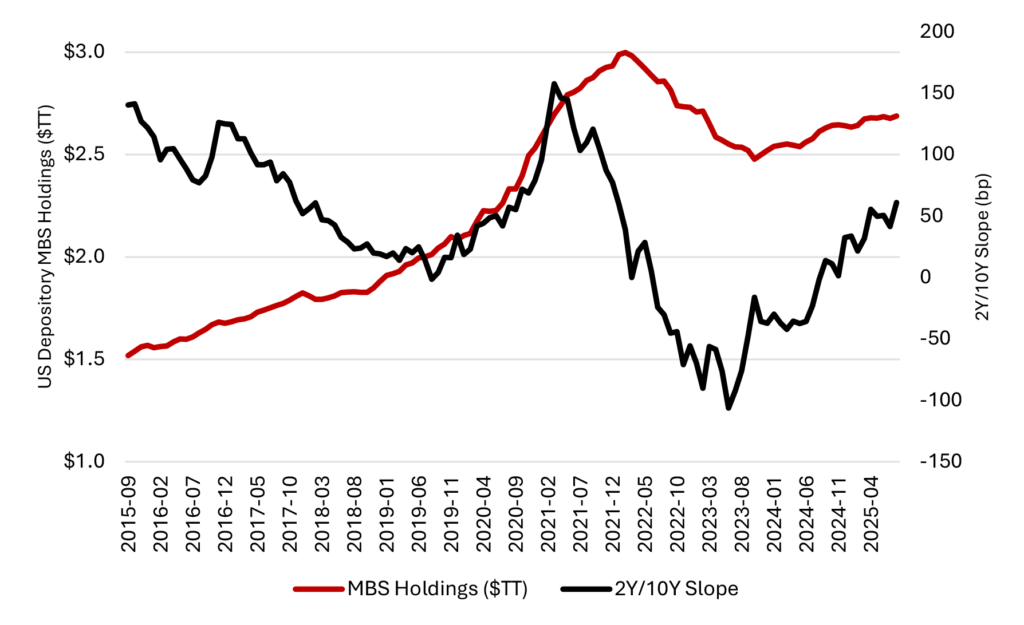
Source: Santander US Capital Markets, Federal Reserve H.8, Bloomberg LP
Delta hedging needs drove demand for MBS as well
The bull flattening of the yield curve in the wake of the most recent non-farm payroll release pushed long yields down and mortgage rates along with them. Based on estimates by my colleague Brian Landy, the move from a 6.5% to 6.1% primary mortgage rate roughly doubled the amount of the MBS universe that is currently refinanceable from 4.5% to 10.7% of the universe. The move lower in rates reduced the duration of the Bloomberg MBS index by roughly one third of a year, leaving the index the most negatively convex in three years (Exhibit 3).
Exhibit 3: The MBS universe shortens and becomes more negatively convex
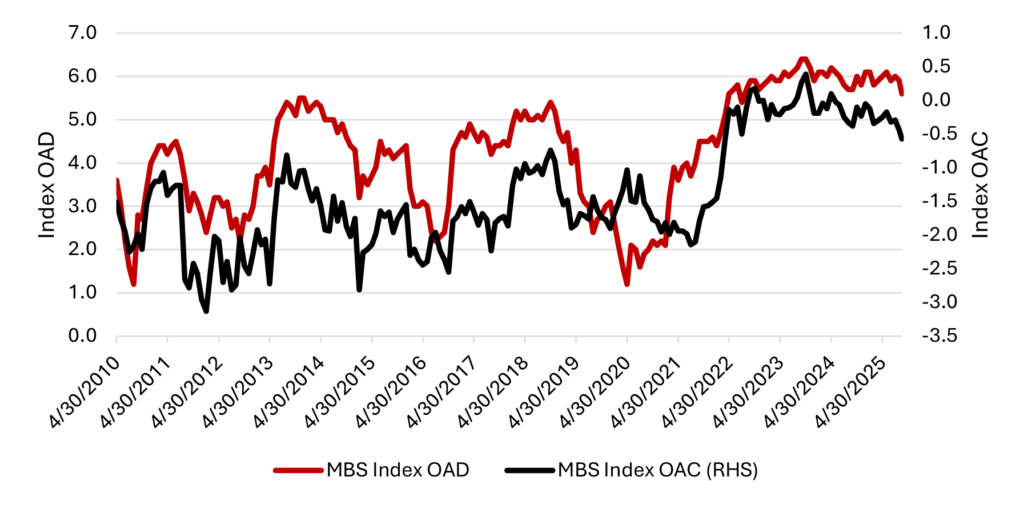
Source: Santander US Capital Markets, Bloomberg LP
Brian’s analysis estimates that at current rate levels, roughly 50% of the conventional 6.0% cohort is in-the-money while just 10% of the 5.5% cohort is currently refinanceable and that a push to a 5.5% primary rate would once again double the float of in-the-money MBS to slightly less than 21%.
With that said, it appears the universe may be approaching peak negative convexity. Based on YieldBook metrics, conventional TBA 5.0%s and 5.5% carry convexity of -2.5 years and are the most negatively convex coupons in the stack. A further rally in mortgage rates would make 5.5%s less negatively convex, looking more like conventional 6.0%s which have a convexity measure of -1.9. Conversely conventional 4.5% would become more negatively convex but given the somewhat bimodal nature of the coupon stack, the overall convexity of the universe may improve modestly into a further rally.
Fund inflows provide further support to MBS spreads
Another factor contributing to tighter MBS spreads are elevated fund inflows. Net inflows into ETFs benchmarked to the Bloomberg US Aggregate Index totaled nearly $21 billion over the past month, which should be invested in MBS proportional to their weighting in the Index. The past month saw an additional $14 billion in government and mortgage-backed ETFs over the past month. Fund inflows to actively managed benchmarked funds threw even more weight behind the tightening in MBS spreads given substantial MBS over-weights in the largest actively managed benchmarked funds.
Thoughts on demand from the Fed, Fannie Mae and Freddie Mac
Some market participants have speculated that the rally has been fueled, to some degree, not only by more dovish Fed positioning with regards to the policy rate but to the portfolio as well and that the end to QT may be nigh. Holding the size of the Fed’s portfolio constant would reduce MBS supply by roughly $18 billion a month in runoff that is not currently being reinvested. An article published by portfolio managers at PIMCO this week suggests that the Fed could take the end of QT one step further, not only reinvesting runoff proceeds in current coupon MBS but actively selling an additional $20 billion to $30 billion of existing discounted portfolio holdings and reinvesting those proceeds in current coupon MBS, which they dubbed “Operation Mortgage Twist.” The authors estimate that the “twist” could both lower primary mortgage rates by 40 bp to 50 bp while also reducing the duration of the Fed’s MBS holdings. The rub, the Fed does not hedge their portfolio, meaning selling discount MBS could crystalize as much as a 20-point loss on deeply discounted MBS held at book value. And while these assets are currently negative carry on the Fed’s balance sheet given the current level of Interest on Reserve Balances (IORB), that negative carry would be reduced fairly materially if the Fed were to embark on a more aggressive reduction in the policy rate. So, while novel and potentially effective in reducing mortgage rates, it seems unlikely that the Fed will actively sell discount coupon MBS out of the portfolio.
In contrast, the idea that Fannie Mae and Freddie Mac could ‘turn those machines back on’ and begin growing their investment portfolios seems more plausible, particularly if and when they offer new common shares in a move away from conservatorship. In their current form, the Preferred Stock Purchase Agreements allow each of the Enterprises to grow their investment portfolios to $225 billion. And at the end of the second quarter, both Fannie Mae and Freddie Mac’s portfolios were well below their caps, holding $81 billion and $65 billion respectively giving them significant runway to grow the portfolios. Our previous pro-forma balance sheet analysis projected that, under a 4.0% leverage ratio, that the GSE may have to collectively grow their portfolios by upwards of $230 billion to generate a mid-teens return on equity assuming no increases to the base guarantee fee or expansion of the footprint of loans they currently guarantee. The estimate likely implies the high end of the range for potential portfolio growth, but based on current revenues it appears the enterprises will need to bolster net income to some degree in any move towards privatization. The portfolios feel like the obvious place to do so given both the institutional expertise in managing mortgage risk and lack of operational frictions to increasing their presence in the MBS market.
This material is intended only for institutional investors and does not carry all of the independence and disclosure standards of retail debt research reports. In the preparation of this material, the author may have consulted or otherwise discussed the matters referenced herein with one or more of SCM’s trading desks, any of which may have accumulated or otherwise taken a position, long or short, in any of the financial instruments discussed in or related to this material. Further, SCM may act as a market maker or principal dealer and may have proprietary interests that differ or conflict with the recipient hereof, in connection with any financial instrument discussed in or related to this material.
This message, including any attachments or links contained herein, is subject to important disclaimers, conditions, and disclosures regarding Electronic Communications, which you can find at https://portfolio-strategy.apsec.com/sancap-disclaimers-and-disclosures.
Important Disclaimers
Copyright © 2026 Santander US Capital Markets LLC and its affiliates (“SCM”). All rights reserved. SCM is a member of FINRA and SIPC. This material is intended for limited distribution to institutions only and is not publicly available. Any unauthorized use or disclosure is prohibited.
In making this material available, SCM (i) is not providing any advice to the recipient, including, without limitation, any advice as to investment, legal, accounting, tax and financial matters, (ii) is not acting as an advisor or fiduciary in respect of the recipient, (iii) is not making any predictions or projections and (iv) intends that any recipient to which SCM has provided this material is an “institutional investor” (as defined under applicable law and regulation, including FINRA Rule 4512 and that this material will not be disseminated, in whole or part, to any third party by the recipient.
The author of this material is an economist, desk strategist or trader. In the preparation of this material, the author may have consulted or otherwise discussed the matters referenced herein with one or more of SCM’s trading desks, any of which may have accumulated or otherwise taken a position, long or short, in any of the financial instruments discussed in or related to this material. Further, SCM or any of its affiliates may act as a market maker or principal dealer and may have proprietary interests that differ or conflict with the recipient hereof, in connection with any financial instrument discussed in or related to this material.
This material (i) has been prepared for information purposes only and does not constitute a solicitation or an offer to buy or sell any securities, related investments or other financial instruments, (ii) is neither research, a “research report” as commonly understood under the securities laws and regulations promulgated thereunder nor the product of a research department, (iii) or parts thereof may have been obtained from various sources, the reliability of which has not been verified and cannot be guaranteed by SCM, (iv) should not be reproduced or disclosed to any other person, without SCM’s prior consent and (v) is not intended for distribution in any jurisdiction in which its distribution would be prohibited.
In connection with this material, SCM (i) makes no representation or warranties as to the appropriateness or reliance for use in any transaction or as to the permissibility or legality of any financial instrument in any jurisdiction, (ii) believes the information in this material to be reliable, has not independently verified such information and makes no representation, express or implied, with regard to the accuracy or completeness of such information, (iii) accepts no responsibility or liability as to any reliance placed, or investment decision made, on the basis of such information by the recipient and (iv) does not undertake, and disclaims any duty to undertake, to update or to revise the information contained in this material.
Unless otherwise stated, the views, opinions, forecasts, valuations, or estimates contained in this material are those solely of the author, as of the date of publication of this material, and are subject to change without notice. The recipient of this material should make an independent evaluation of this information and make such other investigations as the recipient considers necessary (including obtaining independent financial advice), before transacting in any financial market or instrument discussed in or related to this material.
Important disclaimers for clients in the EU and UK
This publication has been prepared by Trading Desk Strategists within the Sales and Trading functions of Santander US Capital Markets LLC (“SanCap”), the US registered broker-dealer of Santander Corporate & Investment Banking. This communication is distributed in the EEA by Banco Santander S.A., a credit institution registered in Spain and authorised and regulated by the Bank of Spain and the CNMV. Any EEA recipient of this communication that would like to affect any transaction in any security or issuer discussed herein should do so with Banco Santander S.A. or any of its affiliates (together “Santander”). This communication has been distributed in the UK by Banco Santander, S.A.’s London branch, authorised by the Bank of Spain and subject to regulatory oversight on certain matters by the Financial Conduct Authority (FCA) and the Prudential Regulation Authority (PRA).
The publication is intended for exclusive use for Professional Clients and Eligible Counterparties as defined by MiFID II and is not intended for use by retail customers or for any persons or entities in any jurisdictions or country where such distribution or use would be contrary to local law or regulation.
This material is not a product of Santander´s Research Team and does not constitute independent investment research. This is a marketing communication and may contain ¨investment recommendations¨ as defined by the Market Abuse Regulation 596/2014 ("MAR"). This publication has not been prepared in accordance with legal requirements designed to promote the independence of research and is not subject to any prohibition on dealing ahead of the dissemination of investment research. The author, date and time of the production of this publication are as indicated herein.
This publication does not constitute investment advice and may not be relied upon to form an investment decision, nor should it be construed as any offer to sell or issue or invitation to purchase, acquire or subscribe for any instruments referred herein. The publication has been prepared in good faith and based on information Santander considers reliable as of the date of publication, but Santander does not guarantee or represent, express or implied, that such information is accurate or complete. All estimates, forecasts and opinions are current as at the date of this publication and are subject to change without notice. Unless otherwise indicated, Santander does not intend to update this publication. The views and commentary in this publication may not be objective or independent of the interests of the Trading and Sales functions of Santander, who may be active participants in the markets, investments or strategies referred to herein and/or may receive compensation from investment banking and non-investment banking services from entities mentioned herein. Santander may trade as principal, make a market or hold positions in instruments (or related derivatives) and/or hold financial interest in entities discussed herein. Santander may provide market commentary or trading strategies to other clients or engage in transactions which may differ from views expressed herein. Santander may have acted upon the contents of this publication prior to you having received it.
This publication is intended for the exclusive use of the recipient and must not be reproduced, redistributed or transmitted, in whole or in part, without Santander’s consent. The recipient agrees to keep confidential at all times information contained herein.


