


The Big Idea
Positioning for stagflation
Steven Abrahams | August 15, 2025
This material is a Marketing Communication and does not constitute Independent Investment Research.
The last few months of inflation and payrolls show the tension that debt investors have to balance these days. Inflation shows signs of persisting above the Fed’s target, and payrolls, especially after the infamous revisions in the July report, show signs of slowing growth. That leaves active portfolios straddling tradeoffs between yield, duration, credit quality and convexity. The best course seems to be to keep duration shorter, credits stronger and avoid the most negatively convex of current or prospective positions. That should give active portfolios the best chance to post both good income and good total return.
It is possibility of stagflation that creates the unusual circumstance. The best yields may stay in the front of the curve for a while as the Fed waits for the next leg down in inflation. The best returns may come from duration as rates drop in anticipation of slower growth. Credit may weaken as growth slows. And negative convexity may kick in as lower rates trigger the first mortgage refinancing wave in years. Active portfolios have to find a way to diversify across these possibilities.
Take income and duration on the shorter end of the curve
Income is almost always a debt portfolios best friend since it is the most predictable component of return. Fortunately, there is a lot of good income around. It is easy to miss that US rates remain at some of the highest levels since the Global Financial Crisis. The entire Treasury curve, for instance, is hundreds of basis points above its median of the last 15 years (Exhibit 1). That makes most US debt curves a good source of income, especially with most recent S&P 500 earnings yields only 41 bp or so above the 10-year Treasury note.
Exhibit 1: US yields remain hundreds of basis points above their 15-year median
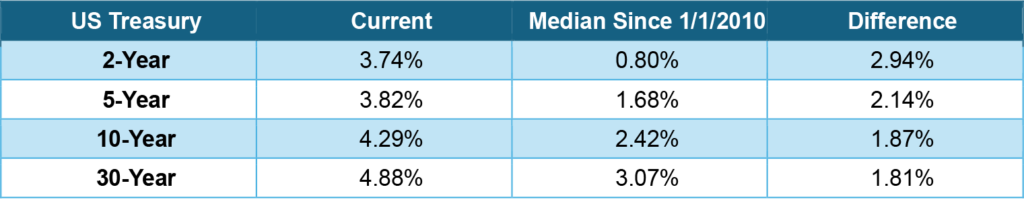
Source: Santander US Capital Markets as of Aug 14, 2025.
The amount of duration or interest rate risk to take for that income is a tougher call, but something inside of five years seems reasonable. Cash is still the highest yielding asset in fixed income with SOFR at 4.33%, but it is hard to know how long that will last. The Fed looks likely to ease at some point this fall. If payrolls continue to come in at levels consistent with the July numbers, cash yields could drop quickly. But duration would add to total return. Because of the current shape of the curve, a barbell using cash or bills and longer notes to hit a duration target would add income and convexity.
Going beyond a 5-year duration starts to run into the risks made clearer by Liberation Day and by the One Big Beautiful Bill Act. Liberation Day triggered some rotation out of US debt and the legislation has put the federal government on a path to materially deeper deficits and more Treasury supply. The Congressional Budget Office projects that debt as a share of GDP will go from around 100% today to 124% over the next decade. Policy volatility and deficits have much bigger impact on the longer end of the curve than on the shorter.
Go up-in-quality in corporate and structured credit
Compensation for all kinds of credit risk is thin these days, and within credit markets investors get paid much less to add marginal risk than at most times in the past 15 years. The spread between ‘AA’ and ‘BBB’ corporate risk, for example, is now 55 bp, more narrow than 98% of the time since the start of 2010 (Exhibit 2). Fundamentals for most big, investment grade companies are admittedly surprisingly strong. But the income lost to go up-in-credit is small, and better credit should also outperform if the economy slows. Alternatively, investors can migrate from smaller to larger issuers within a rating category and often pick up the stronger fundamentals that come with size for minimal or no loss in spread.
Exhibit 2: The spread from ‘BBB’ to ‘AA’ corporate credit has dropped to 55 bp
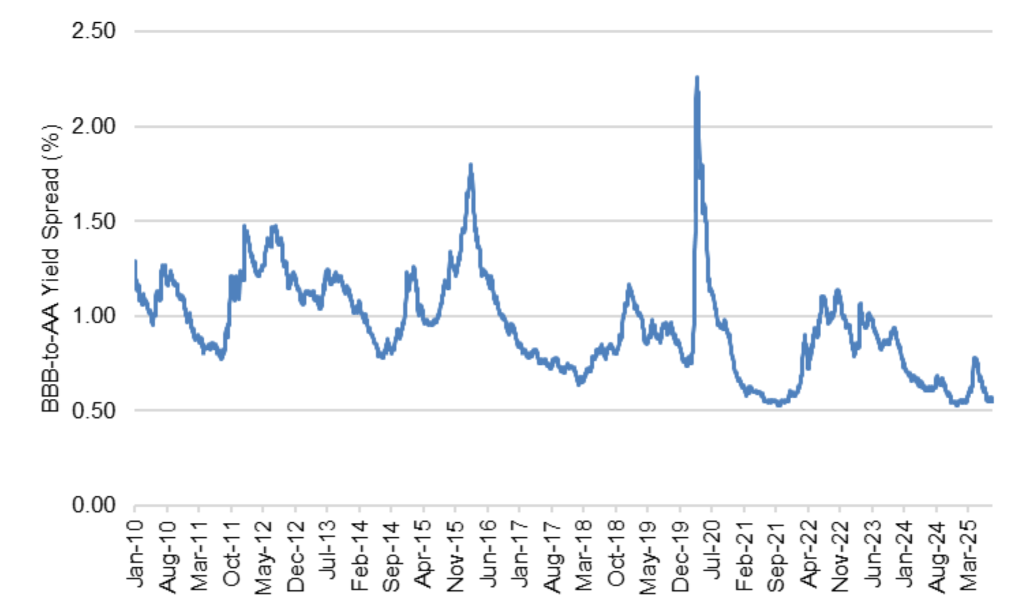
Source: BofAML Corporate Index OAS through FRED, Santander US Capital Markets
Go up in convexity
As for convexity, slowing growth and the eventual Fed cuts that would come along with it should also bring longer rates down and change the dynamic in MBS. A drop in the primary 30-year rate toward 6.0% would expose most conventional 30-year loans originated since 2023 to some of their first refinancing incentives. For Fannie Mae, that includes more than $670 billion in pools. For Freddie Mac, it’s $685 billion. That would trigger the first refinancing wave in years.
Refinancing waves tend to widen MBS spreads as the wave builds because of a mismatch between timing of principal cash flows and the creation of new pools. Principal from refinanced loans usually flows through to investors on the 25th of each month while the new loans created often get pooled the next month. Originators often sell loans forward months before the old loan prepays and the new loan closes, but investors often wait to see their principal cash flow first before reinvesting. That creates selling pressure months before an offsetting bid comes into the market. As refinancing builds, spreads widen.
Any refinancing wave that might come next will probably involve some of the biggest conventional conforming loans ever created. The conventional 1-family limit has nearly doubled since 2017, and bigger loans refinance much faster than smaller (Exhibit 3). That should mean the wave builds quickly, and the pools coming out in new 5.0% and 5.5% pools would likely have some of the largest loan balances ever. The negative convexity of the new pools should be high, eroding the quality of the TBA deliverable in those coupons. If there is a winner in that scenario, it is likely to be current 5.0% and 5.5% specified pools with prepayment protection—namely pools with lower loan balances.
Exhibit 3: The next MBS refi wave should involve some of the largest loans ever
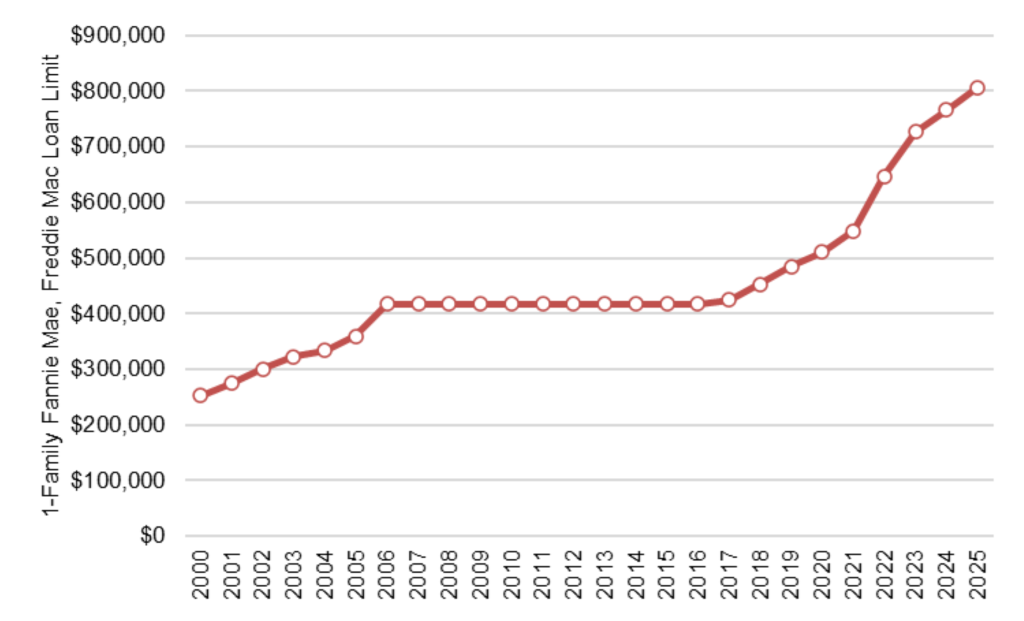
Source: HSH, Santander US Capital Markets
A drop in mortgage rates would obviously affect Ginnie Mae MBS, too, and there the difference between VA and FHA pools should become significant. VA pools should respond to lower rates much faster than FHA. FHA custom pools should outperform Ginnie Mae TBA multi-issuer pools heavily weighted toward VA loans.
So, going up in convexity especially in 30-year 5.5% and 5.0% MBS looks like a good position for stagflation. Specified conventional pools with lower loan balances and custom Ginnie Mae pools backed by FHA and rural housing loans should perform well.
Hedging instead of repositioning
Portfolios without the luxury to significantly reposition can hedge instead. The MOVE index now stands at its lowest level since the start of 2022, making the risk of lower rates and correlated wider spreads in credit and MBS less expensive to hedge. The VIX is also near its lowest level of 2025, reducing the cost to hedge a risk correlated with credit.
Performance through the September Fed
If the Fed surprises and does not cut in September, yields in the front of the curve should rise slightly from here. Positioning along the front of the curve should mean losses in price largely if not fully offset by relatively high income. Credit and MBS should hold their spread or widen slightly on the delay in easing.
If the Fed cuts 25 bp in September, as the market expects, yields along the curve should drop. Positioning along the front of the curve should rally in addition to generating good income. Spreads in credit might tighten slightly on prospects of continued easing. And spreads in MBS might also edge tighter in line with credit.
If the Fed surprises and cuts 50 bp in September, the market would likely read that as a signal of a slowing economy and yields should drop and the curve steepen. Positions on the front of the curve should gain even more, adding to income. Spreads in credit should widen, although less in better credits. And spreads in MBS should widen, too, although less in more convex MBS.
* * *
The view in rates
The fed funds market has bounced around in the last week and ended with fed funds priced at 3.77% for the end of the year. That has changed only a few basis points in the last week. That is roughly 10 bp below the Fed’s June dot for the end of the year. That would require 56 bp of easing from here. As Stephen Stanley points out, a wide range of measures show inflation running above the Fed’s 2% target. At the same time, payrolls point to a weak labor market and a slowing economy. The Fed has tough decisions to make.
Other key market levels:
- Fed RRP balances settled on Friday at $34 billion, nearly the lowest level since April 2021
- Setting on 3-month term SOFR closed Friday at 418 bp, down 5 bp in the last week
- Further out the curve, the 2-year note traded Friday at 3.75%, down 1 bp in the last week. The 10-year note traded at 4.32%, up 4 bp in the last week.
- The Treasury yield curve traded Friday with 2s10s at 56 bp, steeper by 4 bp in the last week. The 5s30s traded Friday at 108 bp, steeper by 6 bp over the same period
- Breakeven 10-year inflation traded Friday at 238 bp, down 2 bp in the last week. The 10-year real rate finished the week at 194 bp, up 6 bp in the last week.
The view in spreads
Spreads look relatively tight against the Treasury curve. That seems to heavily discount the risk of slower growth. Net supply is also light, or in the case of investment grade corporate debt, negative. The Bloomberg US investment grade corporate bond index OAS traded on Friday at 75 bp, tighter by 3 bp in the last week. Nominal par 30-year MBS spreads to the blend of 5- and 10-year Treasury yields traded Friday at 138 bp, tighter by 2 bp in the last week. Par 30-year MBS TOAS closed Friday at 31 bp, tighter by 1 bp in the last week.
The view in credit
The weakest consumers and companies are showing stress. Serious delinquencies in FHA mortgages and in credit cards held by consumers with the lowest credit scores have been accelerating. Consumers in the lowest tier of income look vulnerable, and renewed student payments and cuts to government programs should keep the pressure on. The balance sheets of smaller companies show signs of rising leverage and lower operating margins. Leveraged loans also are showing signs of stress, with the combination of payment defaults and liability management exercises, or LMEs, often pursued instead of bankruptcy, back to 2020 post-Covid peaks. If persistent inflation keeps the Fed at higher rates, fewer leveraged companies will be able to outrun interest rates, and signs of stress should increase. LMEs are very opaque transactions, so a material increase could make important parts of the leveraged loan market hard to evaluate.