


The Big Idea
Rich credit, heavy fund inflows, a leveraged Treasury market
Steven Abrahams | June 27, 2025
This material is a Marketing Communication and does not constitute Independent Investment Research.
The cash market in credit looks rich to a number of benchmarks these days, with the market in credit derivatives suggesting the tight spreads come more from strong investor demand than from strong credit fundamentals. Heavy inflows to bond mutual funds may be adding to the demand. And an increasingly leveraged market in US Treasury debt creates some vulnerability to any episode of rate volatility.
Fundamentally rich credit
Investors with the flexibility to position in credit across either cash or derivatives may have a straightforward way to add income to a diversified portfolio. A combination of Treasury debt and CDS protection looks better than similar risk in the corporate securities market.
Credit securities generally look rich these days, at least based on yield spreads to the Treasury curve. The option-adjusted spread on the average issue in the corporate investment grade index stands near at 86 bp, tighter than 93% of sessions in the last 10 years. And the spread on the average high yield issue is at 294 bp, tighter than 91% of sessions. That richness may be due to investor views of fundamentals or to strong demand or to some combination. The market in credit derivatives, fortunately, has a view.
Credit securities these days also look rich against credit derivatives, suggesting investor demand is an important part of the story in the cash market. The average investment grade corporate security today trades more than 6 bp tighter than the 10-year investment grade CDX, tighter than 93% of sessions in the last 10 years (Exhibit 1A). And the average high yield issue trades 37 bp tighter than the 5-year high yield CDX, tighter than 87% of sessions (Exhibit 1B). That points to demand outstripping fundamentals.
Exhibit 1A: Investment grade cash spreads look rich to CDS
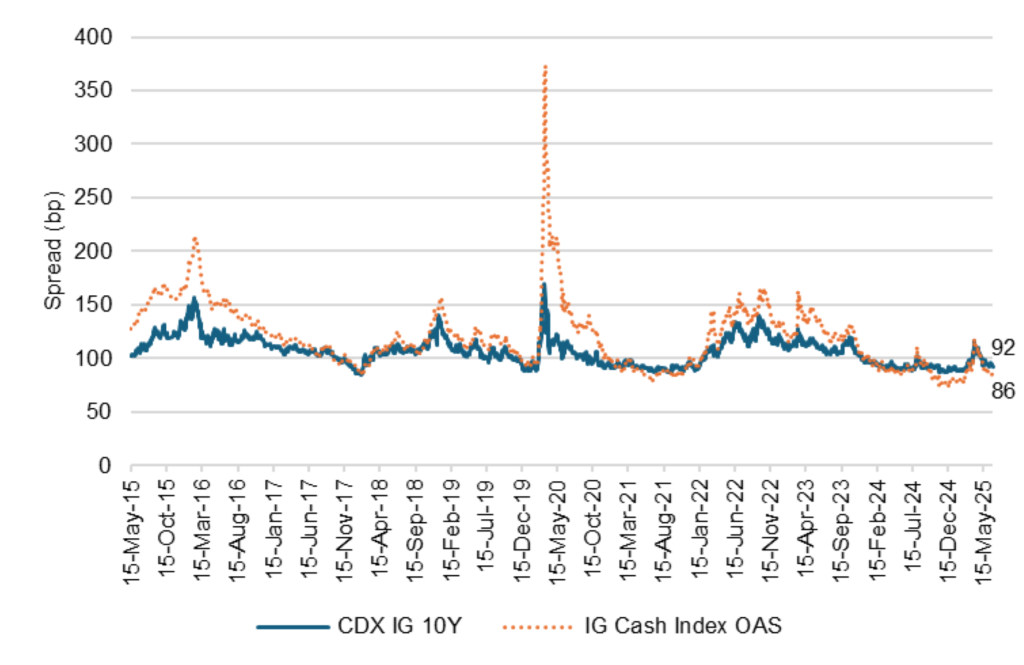
Note: CDX IG 10Y used as a benchmark because its duration is closer to the cash index than the CDX IG 5Y.
Source: Bloomberg, Santander US Capital Markets
Exhibit 1B: High yield cash spreads look rich to CDS
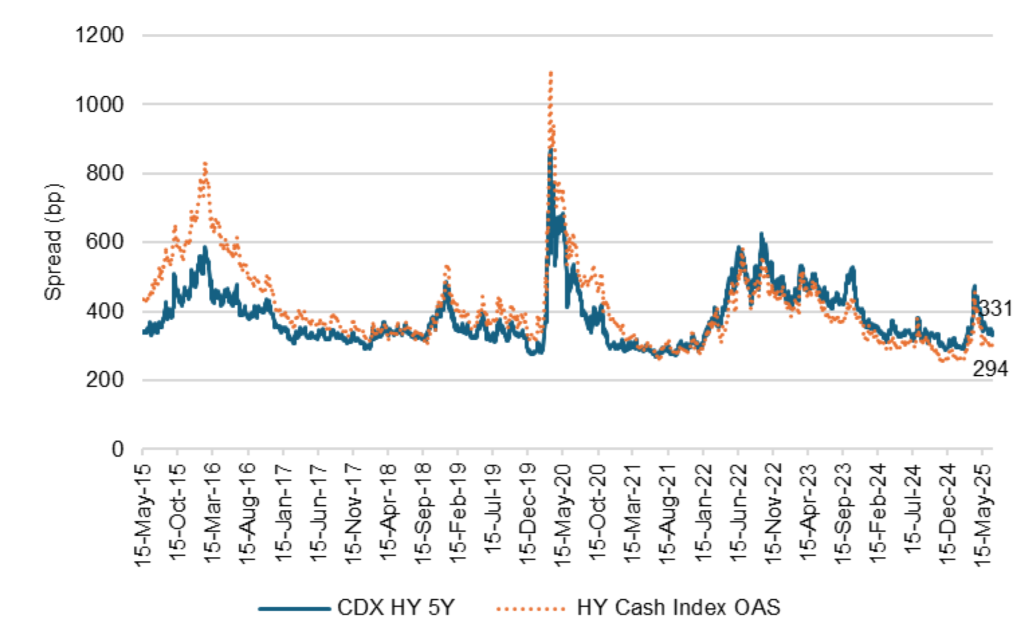
Source: Bloomberg as of 26 Jun 2025, Santander US Capital Markets
The argument for using credit derivatives as a fundamental check on the cash market really centers on the ability to go short in the derivatives market much more easily than in cash. If the demand to buy protection (get long) in the derivatives market drives CDS premiums too high, a new seller of protection (get short) can offer marginal supply. In the cash market, the time, expense and risk of borrowing most issues and selling into an aggressive limits marginal supply. The cash market is more likely to get distorted by swings in demand. Credit derivatives consequently can help benchmark fundamental fair value, and the cash market can help benchmark the changing balance in most markets between issuer supply and investor demand.
That leaves cash credit looking rich to fundamental value in the CDS market these days. Foreign investors, holding 29% of corporate and structured credit, continue to show good appetite. And life insurers, holding 23% of credit, continue to see demand supported by healthy growth in total face value of policies and in annuities. Strong investor demand also shows up in the new issue market, with new issues offering little concession to secondary spreads.
Investors with the flexibility to position in cash securities or derivatives should think about the current picture of relative value. It may be fundamentally better value to buy Treasury debt for duration, buy protection in CDS for spread and get the same rate and credit exposure offered in the cash market but with more spread and carry.
Heavy inflows into fixed income ETFs and funds
Credit and MBS are likely to get a continuing strong bid from indexed money managers, at least based on the latest flows into bond mutual funds and ETFs.
Bond funds and ETFs pulled in a strong $55.7 billion for the four weeks ending June 11, according to the Investment Company Institute, close to their biggest 4-week haul since mid-2021 (Exhibit 2). Part of the flow is almost certainly reinvestment of funds withdrawn in April. This comes as equity funds lost $27 billion over the four weeks ending June 11.
Exhibit 2: Bond funds and ETFs see some of their strongest inflows in years
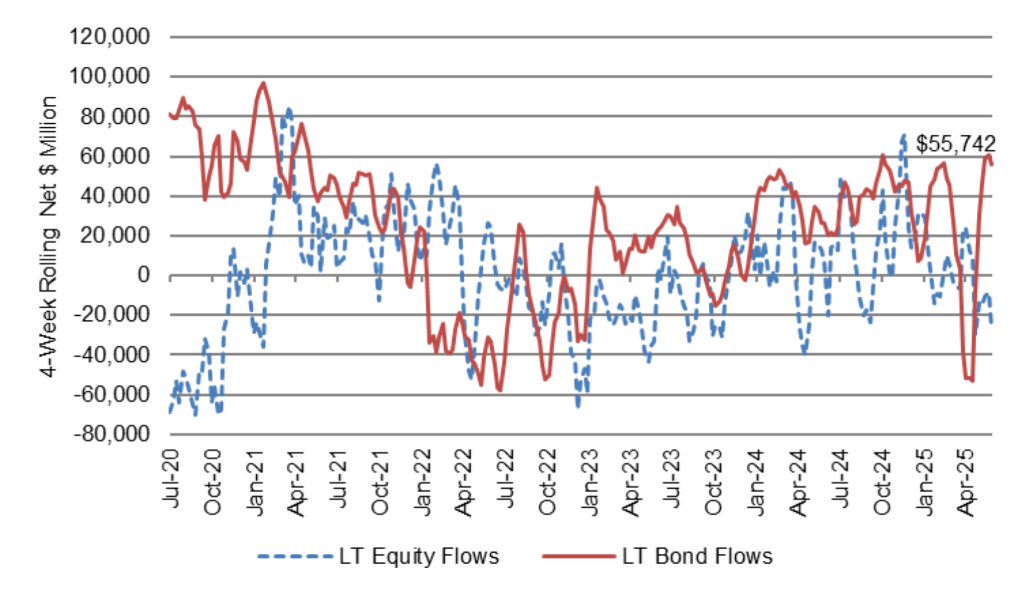
Source: Bloomberg, Santander US Capital Markets
Bond mutual funds are the main beneficiaries of the rebound. Inflows to funds have trailed ETFs significantly this year, continuing a multi-year trend. Mutual funds actually saw small net withdrawals in March and heavy withdrawals in April before the latest rebound through June 11 (Exhibit 3). The rebound nevertheless still leaves mutual funds well behind ETFs so far this year.
Exhibit 3: Mutual fund inflows have rebounded from April but still trail ETFs YTD
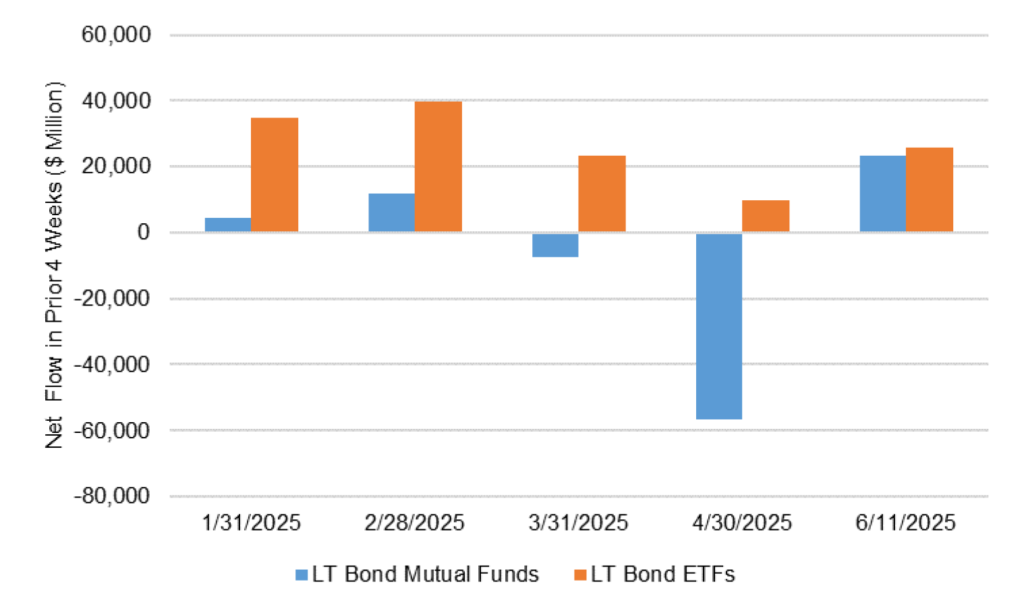
Source: Investment Company Institute, Santander US Capital Markets
The latest flows into mutual funds should get allocated heavily to corporate and structured credit and to agency MBS, where actively managed funds tend to be most overweight. That should help risk spreads narrow a bit to the Treasury curve. Flows into ETFs, on the other hand, are likely to get allocated in aggregate in line with the sector’s weight in the benchmark index with little impact on risk spreads.
A leveraged Treasury market
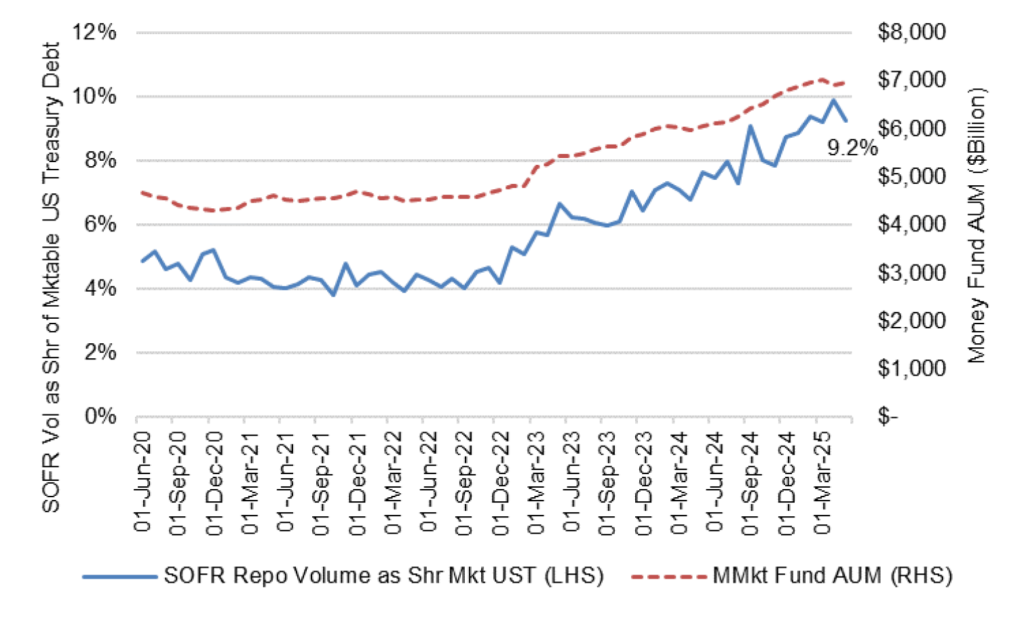
A rising share of marketable US Treasury debt is getting financed, based on transaction volume in the repo market. The volume of trades used to calculate the Secured Overnight Financing Rate has moved up steadily as a share of outstanding marketable Treasury debt. That share has run from around 4% at the end of 2022 to nearly 10% this year (Exhibit 4). It finished May at 9.2%.
Exhibit 4: Repo is financing a rising share of marketable US Treasury debt
Source: Bloomberg, Santander US Capital Markets
The rising share parallels the steady rise in assets under management at US money market funds. Money funds are heavy providers of cash to the repo market and have attracted record inflows as the Fed has raised interest rates.
The additional leverage leaves the Treasury market vulnerable to episodes of rising volatility. Investors holding positions on margin become more likely to close out and sell, magnifying the impact of changing fundamentals. That may be part of the reason that the financed share of the market fell from 9.9% at the end of April to 9.2% to end May.
* * *
The view in rates
The market closed on Friday pricing fed funds at 3.67% to end the year, 20 bp below the Fed’s June dots. The Fed dots in June moved up from their March levels, leaving the market pricing to lower levels. The Fed looks prepared to wait until it has a better view of whether tariffs will bring a 1-time price change or more persistent inflation. The market seems to believe the inflation impact will be muted, and fed funds lower as a result.
The general volatility of US policy, Moody’s downgrade of the US from ‘AAA’ to ‘Aa1’ on May 17 and the prospect of larger federal deficits has almost certainly led more investors to focus on the US fiscal picture. Debt-to-GDP is at 100% and expected to grow over the next decade to 117%. The CBO estimates the budget bill moving through Congress in its current form could add $2.4 trillion to the deficit by 2034. It all promises to add term premium to the yield curve, steepening the curve.
Other key market levels:
- Fed RRP balances rose to $285 billion as of Friday, up $117 billion over the last two weeks. This looks like the beginning of a familiar spike in RRP balances at the end of each quarter as banks reduce balance sheet and push repo volume to the RRP.
- Setting on 3-month term SOFR closed Friday at 430 bp, down 2 bp in the last two weeks.
- Further out the curve, the 2-year note traded Friday at 3.74%, down 21 bp in the last two weeks. The 10-year note traded at 4.28%, down 12 bp in the last two weeks.
- The Treasury yield curve traded Friday with 2s10s at 54 bp, steeper by 9 bp in the last two weeks. The 5s30s traded Friday at 101 bp, steeper by 11 bp over the same period
- Breakeven 10-year inflation traded Friday at 230 bp, up 1 bp in the last two weeks. The 10-year real rate finished the week at 197 bp, down 13 bp in the last two weeks.
The view in spreads
The market has absorbed the Israel-Iran conflict surprisingly well, implying that broad risk to the global economy is limited. Tariffs also continue to roll toward the end of the US 90-day pause, but the US looks likely to avoid any significant re-escalation. There may be isolated threats and even a few tariff penalties imposed, but most counterparties look either likely to come to some temporary broad agreement or extend discussion into another 90-day or longer deferral. That helps risk assets continue to rebound from the initial Liberation Day shock The Bloomberg US investment grade corporate bond index OAS traded on Friday at 86 bp, wider by 2 bp in the last two weeks. Nominal par 30-year MBS spreads to the blend of 5- and 10-year Treasury yields traded Friday at 147 bp, tighter by 5 bp in the last two weeks. Par 30-year MBS TOAS closed Friday at 29 bp, tighter by 6 bp in the last two week.
The view in credit
A wide range of specific industries and individual companies still have exposure to tariff risk, but fundamentals for the average of the distribution continue to look stable. Most investment grade corporate and most consumer balance sheets have fixed-rate funding so falling rates have limited immediate effect. Consumer debt service coverage is roughly at 2019 levels. However, serious delinquencies in FHA mortgages and in credit cards held by consumers with the lowest credit scores have been accelerating. Consumers in the lowest tier of income look vulnerable. The balance sheets of smaller companies show signs of rising leverage and lower operating margins. Leveraged loans also are showing signs of stress, with the combination of payment defaults and liability management exercises, or LMEs, often pursued instead of bankruptcy, back to 2020 post-Covid peaks. If the Fed only eases slowly this year, fewer leveraged companies will be able to outrun interest rates, and signs of stress should increase. LMEs are very opaque transactions, so a material increase could make important parts of the leveraged loan market hard to evaluate.