


The Big Idea
The unmanageable risks of tariffs
Steven Abrahams | March 7, 2025
This material is a Marketing Communication and does not constitute Independent Investment Research.
Investors have suddenly found themselves at a big disadvantage as US trade policy gets formed moment to moment. The administration may know what comes next, but investors would be hard pressed to say the same. And this is at a point where mainly Canada, China and Mexico are involved. In early April, the administration plans to open discussion of reciprocal tariffs with all US trading partners. Based on the information asymmetry in tariffs, most investors should trim any highly sensitive exposures, starting in credit. But since 29% of revenues in the S&P 500 come from overseas, avoiding the risk entirely could be hard.
Trade policy twists and turns so far
Part of the current challenge is the difficulty of predicting the course of trade policy. Since the current administration took office, the Peterson Institute for International Economics lists 21 major trade policy statements, actions or trading partner responses (Exhibit 1). Policy news has come through written briefs, speeches, Q&A with the president and social media. Tariffs have gone into effect and then been suspended within days, or the administration has created exceptions, such as those created within the last week for the auto industry and other goods.
Exhibit 1: Recent US trade policy announcements, actions and responses
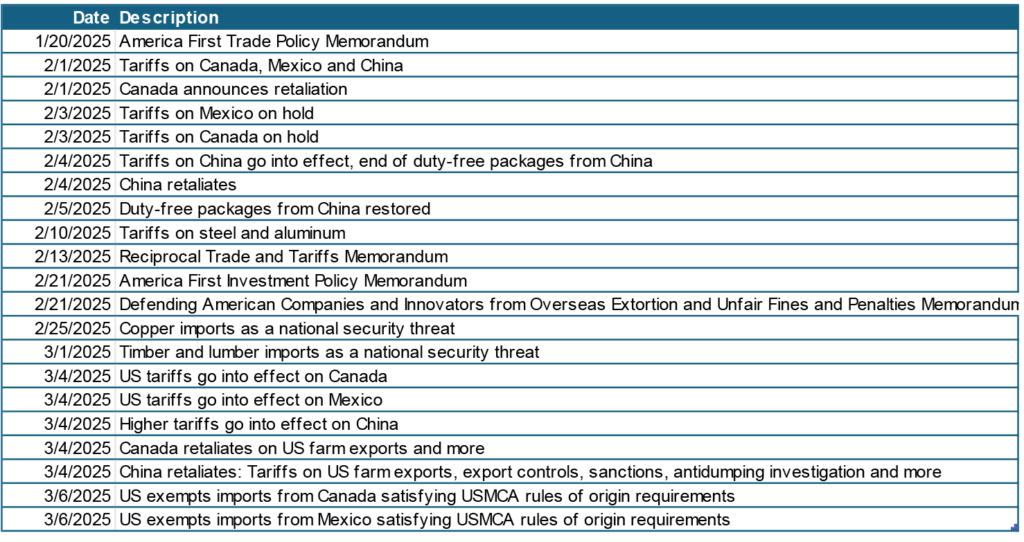
Source: Peterson Institute, Santander US Capital Markets
Signs of significant uncertainty
Polymarket.com, a platform for trading event contracts, currently lists more than two dozen contracts on the target, magnitude and duration of tariffs between the US and its trading partners. For example, contracts on the platform within the last week implied less than a 10% chance of removing US tariffs on China before May, a fairly high level of certainty, but only marginally more than a 50% chance of removing tariffs on Canada and Mexico by then, nearly a maximum level of uncertainty (Exhibit 2).
Exhibit 2: High uncertainty about how long Canada, Mexico tariffs last
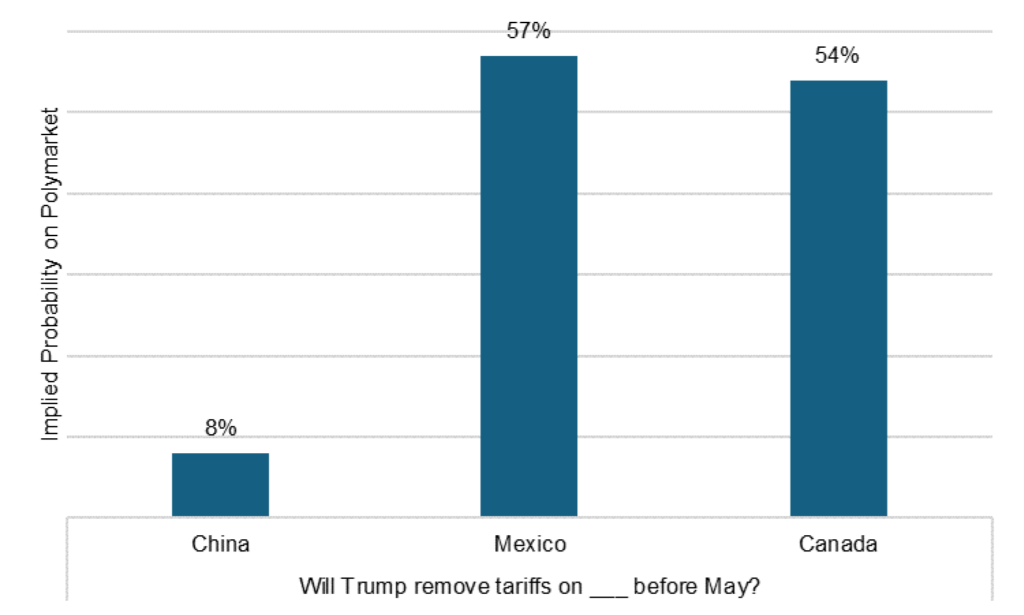
Source: Polymarket as of 3/5/2025, Santander US Capital Markets.
The market has also started looking ahead to reciprocal tariff negotiations. The administration has indicated it will start setting reciprocal tariffs on April 2. The market seems to have reasonable confidence about the targets, except for Brazil. Polymarket contracts currently imply a 79% chance of tariffs on the European Union and chances of tariffs on most other individual countries as less than 20%, fairly high levels of confidence for all (Exhibit 3). But the implied chances for Brazil are 50%, maximum uncertainty.
Exhibit 3: The European Union looks like a tariff target, others ex-Brazil do not
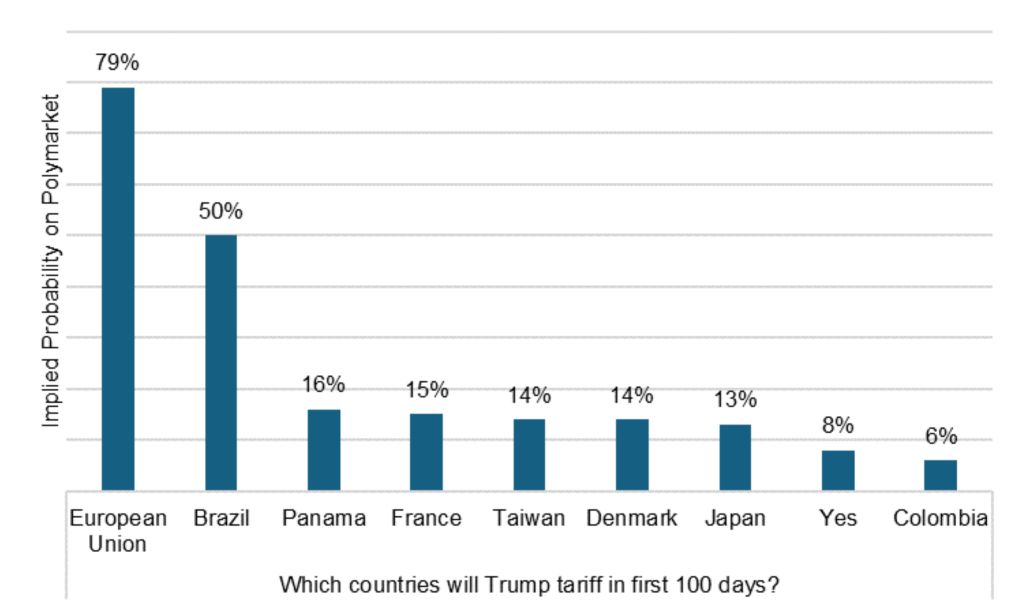
Source: Polymarket as of 3/5/2025, Santander US Capital Markets.
As the threat of tariffs has continued, the markets have become less certain about the direction of rates and equities. The MOVE index of implied interest rate volatility has moved up 14% since the end of January back to levels last seen after the November 5 US elections, and the VIX index of implied equity volatility has moved up 33% since the end of January well above November levels (Exhibit 3). Most of the increase in both indices has come since mid-February.
Exhibit 4: Implied volatility of rates and equities has moved higher
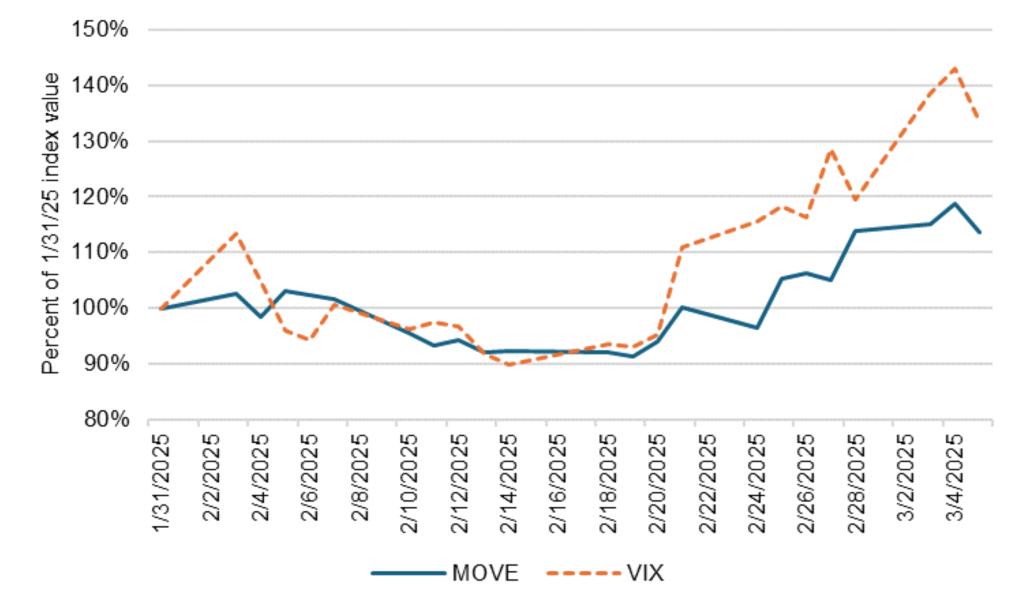
Source: Bloomberg, Santander US Capital Markets.
Direct and indirect winners and losers
Not surprisingly, most credit analysis of tariffs so far has focused on the likely direct winners and losers in Canada, China, Mexico and the US. And those winners and losers span both investment and speculative grade bonds and loans.
S&P has highlighted a few likely US winners:
- Chemicals producers, from higher prices on competing products
- Metals and mining producers, from more volume and higher prices
The rating agency has also highlighted likely US losers:
- Health care and pharmaceuticals, from loss of global generics
- Technology, from high cost to relocate production
- Utilities and renewables, from high cost to relocate production
- Auto manufacturers, lower volume, supply shortages, volatility
- Consumer product companies and retail, from price sensitivity
Other companies likely have secondary exposure if a company directly affected by tariffs is a big supplier or customer. And US companies also could have secondary exposure if a significant share of revenues come from countries affected by US tariffs. According to S&P as of mid-2024, 28.9% of revenues for S&P 500 companies come from overseas. There is only slightly less exposure for smaller companies. According to FTSE Russell as of late September 2023, 19.8% of revenues for the Russell 2000 come from outside the US.
Only take risk you can understand and manage
One core principle of good investing has generally been to only take risks that you can understand and manage. In the case of US trade policy, it seems hard to detect a pattern so far. And the potential impact on investment results is broad and systemic. The recent rise in implied volatility on rates and equities—and, by implication, on credit—almost surely reflect investors trying to hedge the direct and indirect effects of trade policy risk. The other obvious possibility is to allocate to safe assets and cash. Although credit has been a winning allocation through most markets since mid-2020, this looks like a time to reduce exposure.
* * *
The view in rates
The market continues to price in three cuts this year, one more than the Fed’s dots. But the significant jump in consumer inflation expectations in January should give the Fed pause. Consumer expectations for price increases in the next five to 10 years hit 3.5% in January, the highest since April 1995. The Fed likes to keep inflation expectations anchored around 2%, and, although only one report, the January numbers may ring alarms.
Beyond 2025, the market still lines up with the dots at the end of 2026 and 54 bp above the dots at the end of 2027. The futures market that far out is admittedly less liquid, but still a signal of skepticism about the Fed’s ability to keep rates down.
Rate volatility jumped higher a week ago and remains elevated. Equity volatility continued to move higher in the last week.
Other key market levels:
- Fed RRP balances closed at $136 billion as of Friday, down $98 billion in the last week. Limits on repo balance sheets at banks likely pushed a lot of the repo market toward the RRP at the end of March. But with RRP at 4.25%, Treasury repo at 4.37% and MBS repo at 4.39%, cash has better alternatives than RRP. RRP balances should decline.
- Setting on 3-month term SOFR closed Friday at 429 bp, down 4 bp on the week.
- Further out the curve, the 2-year note traded Friday at 4.00%, up 1 bp in the last week. The 10-year note traded at 4.30%, up 9 bp in the last week.
- The Treasury yield curve traded Friday with 2s10s at 30 bp, steeper by 8 bp in the last week. The 5s30s traded Friday at 51 bp, steeper by 4 bp over the same period
- Breakeven 10-year inflation traded Friday at 236 bp, down 1 bp in the last 1week. The 10-year real rate finished the week at 196 bp, up 12 bp in the last week.
The view in spreads
Bearish on credit spreads with US trade policy in flux. The Bloomberg US investment grade corporate bond index OAS traded on Friday at 87 bp, wider by 3 bp in the last week. Nominal par 30-year MBS spreads to the blend of 5- and 10-year Treasury yields traded Friday at 135 bp, wider by 3 bp in the last week. Par 30-year MBS TOAS closed Friday at 34 bp, wider by 5 bp in the last week.
The view in credit
We are starting to see cracks in credit quality at the weaker end of the distribution. Fundamentals for the average consumer and most corporate credits continue to look stable. Most investment grade corporate and most consumer balance sheets have fixed-rate funding so falling rates have limited immediate effect. Consumer debt service coverage is roughly at 2019 levels. However, serious delinquencies in FHA mortgages and in credit cards held by consumers with the lowest credit scores have been accelerating. Consumers in the lowest tier of income look vulnerable. The balance sheets of smaller companies show signs of rising leverage and lower operating margins. Leveraged loans also are showing signs of stress, with the combination of payment defaults and liability management exercises, or LMEs, often pursued instead of bankruptcy, back to 2020 post-Covid peaks. If the Fed only eases slowly this year, fewer leveraged companies will be able to outrun interest rates, and signs of stress should increase. LMEs are very opaque transactions, so a material increase could make important parts of the leveraged loan market hard to evaluate.