By the Numbers
Low beta wins again in CLO loan portfolio returns
This material is a Marketing Communication and does not constitute Independent Investment Research.
Returns in the average CLO manager’s loan portfolio continue to trail the broad market after adjusting for risk. But managers that build portfolios with stable or low beta returns continue to beat both the passive benchmark and their peers. Once again in performance through March, the pattern shows up again. It could come from the systematic undervaluation of safer, low-beta loans and the overvaluation or riskier, high-beta loans. Or it could come from holding illiquid loans. The safe-versus-risky theory looks more likely, lifting the quality of returns on CLO debt and equity.
Managers trailed the market index by 3 bp through January
After accounting for CLO reporting dates, the Morningstar/LSTA leveraged loan index returned 3.26% for the three months through March. The average loan portfolio for managers with five or more actively tracked deals had a beta—or sensitivity to the loan index—of 1.021. With that beta, the average loan portfolio should have returned 3.33%. But managers weighted by assets under management instead delivered a return of 3.30%, trailing the index (Exhibit 1).
Exhibit 1: Average CLO managers’ performance trailed the broad market by 3 bp
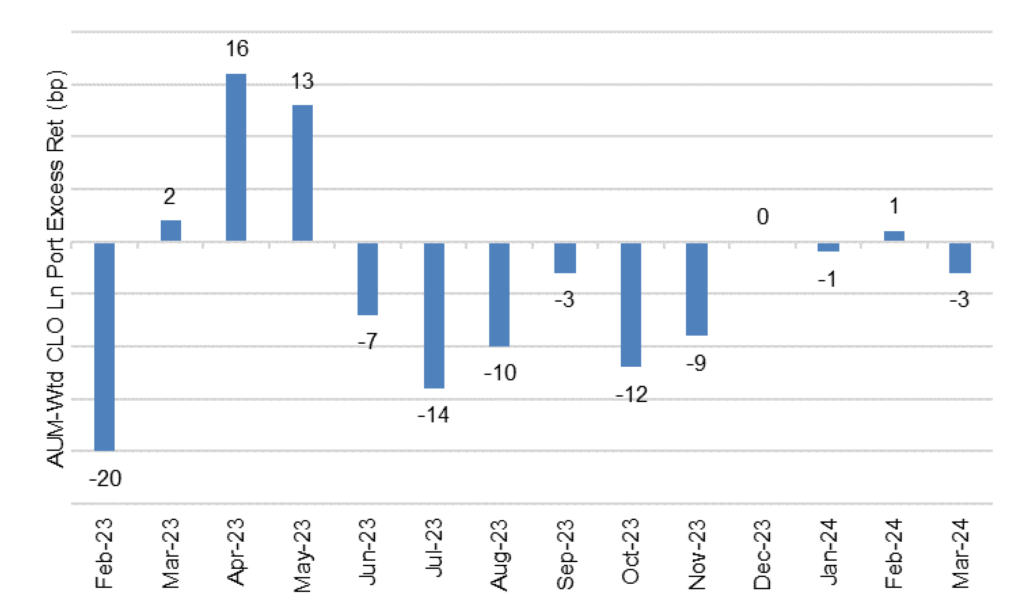
Note: (1) Each reporting period includes the most recent three months. For example, the reporting period ending in Mar 2024 includes the average manager performance in the past three months ending on or before Mar 20, 2024. (2) The March reporting period data shows the average excess return relative to the Morningstar/LSTA total return index for 76 managers with five or more active deals.
Source: INTEX, Markit, Santander US Capital Markets LLC.
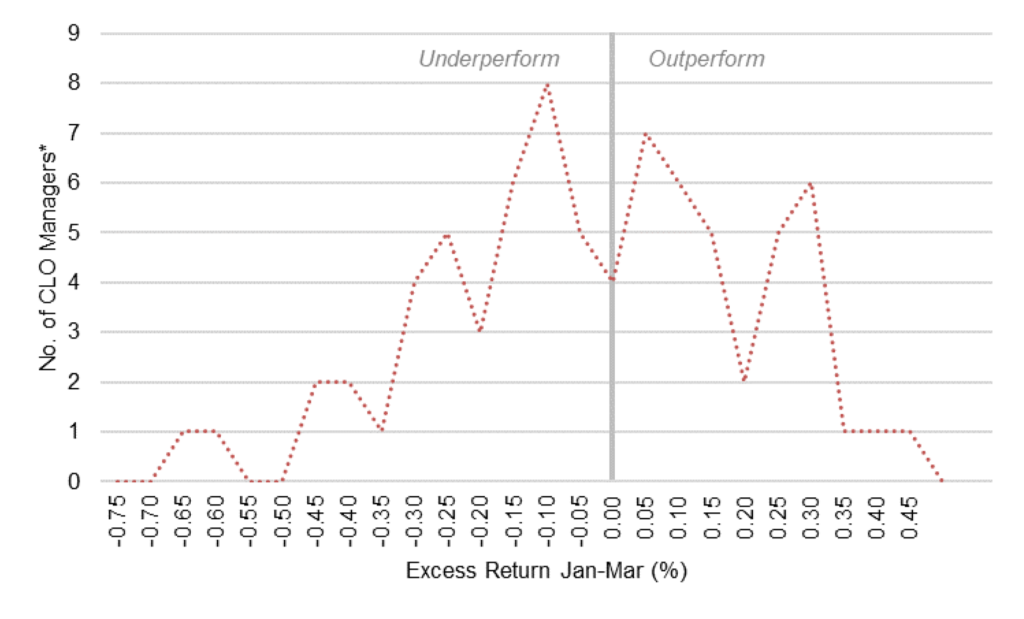
Of the 76 managers tracked, 34 outperformed the leveraged loan index and 42 underperformed. Individual managers’ excess returns to the index through March ranged from a high of 42 bp to a low of -66 bp (Exhibit 2).
Exhibit 2: CLO manager loan portfolio performance through March varied widely
Source: INTEX, Markit, Santander US Capital Markets LLC
Low-beta managers continue to outperform the index and their peers
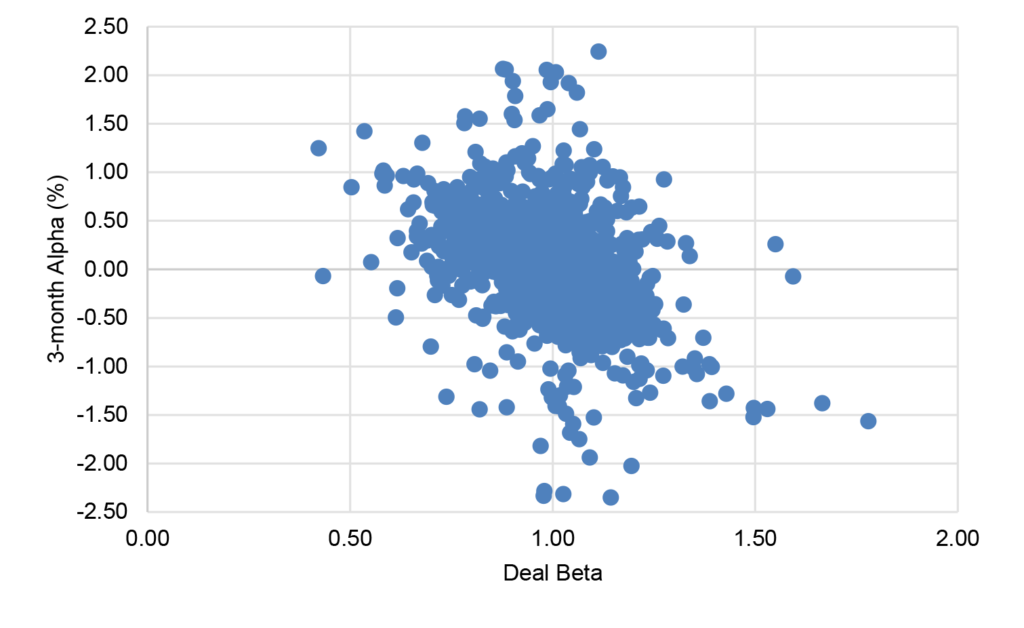
One of the most reliable results from tracking manager loan portfolio performance has been the link between portfolio risk and portfolio excess return. Each manager shows risk as a beta or multiple of the broad market index. A beta less than 1.0 indicates less risk than the market average and a beta greater than 1.0 indicates more risk. Managers with a beta less than 1.0 routinely outperform the market while managers with a beta greater than 1.0 routinely underperform. That was true again for the three months ending in March either using the average beta for the 76 managers tracked or using the beta of the more than 2,200 deals tracked (Exhibits 3A, 3B). Lower manager beta tends to come with positive excess return, higher manager beta comes with negative excess return. The same trend is even more pronounced for individual deals
Exhibit 3A: Managers with low beta generally outperformed through March
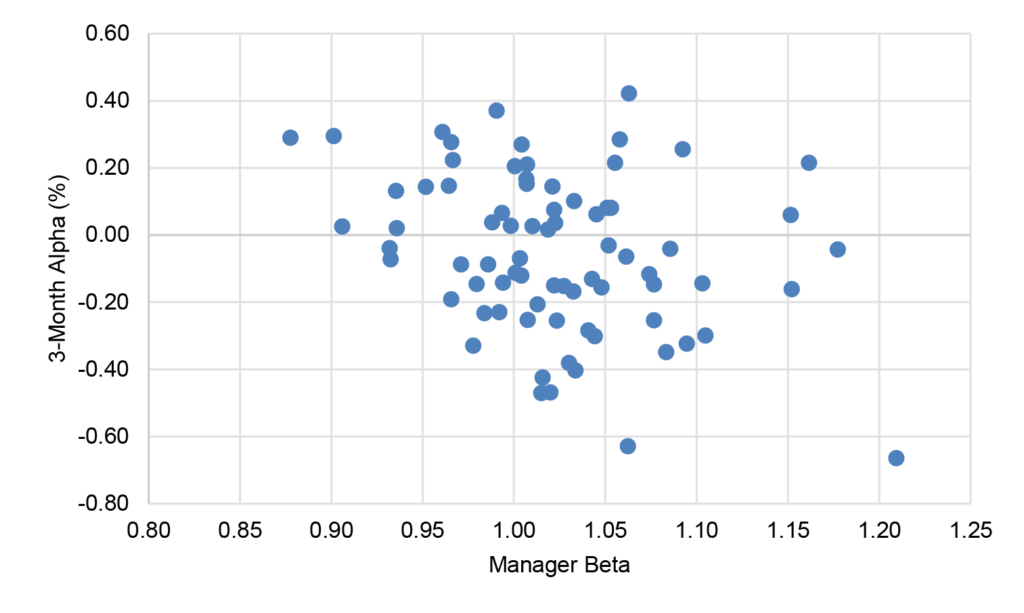
Exhibit 3B: Underlying deals with low beta generally outperformed through March
Source: INTEX, Markit, Santander US Capital Markets LLC.
At least two broad possibilities could explain the tendency for excess return to fall as beta increases:
- Risky loans trade rich, safer loans trade cheap. This would happen if managers competing to deliver returns to CLO equity crowd into riskier loans that drive up portfolio beta and drive down the potential for excess return. Crowding into risk arguably leaves safer loans with lower beta trading at much better valuations. A wide range of research often tagged as betting against beta finds this pattern in US equities, 20 international equity markets, Treasury and corporate bonds and futures. If betting against beta is driving CLO loan portfolio beta and alpha, then equity and debt investors are getting a genuinely better investment performance.
- Illiquid loans show low beta, high alpha. Illiquid loans with stale prices show low beta to market indices and high alpha, at least when loan returns are positive. There’s no magic to this. It’s purely from the low correlation between any asset with stale pricing and any more liquid mark-to-market index. If illiquidity is driving CLO loan portfolio beta and alpha, then the better investment performance is more optics than reality.
Both explanations likely contribute to this consistent result in CLO loan portfolios, but I would lean toward betting against beta as the bigger effect. Low beta portfolios should deliver better ultimate loan returns or more stable returns or both. Those higher-quality returns should accrue to the benefit of CLO equity and debt.
The rankings are in
For the three months ending in March, Bardin Hill, Anchorage, Invesco, Guggenheim and Elmwood make up the Top 5 in excess return with KKR, ICG, Octagon, MJX and American Money rounding out the Top 10 (Exhibit 4).
Exhibit 4: CLO managers ranked by excess loan portfolio return through March
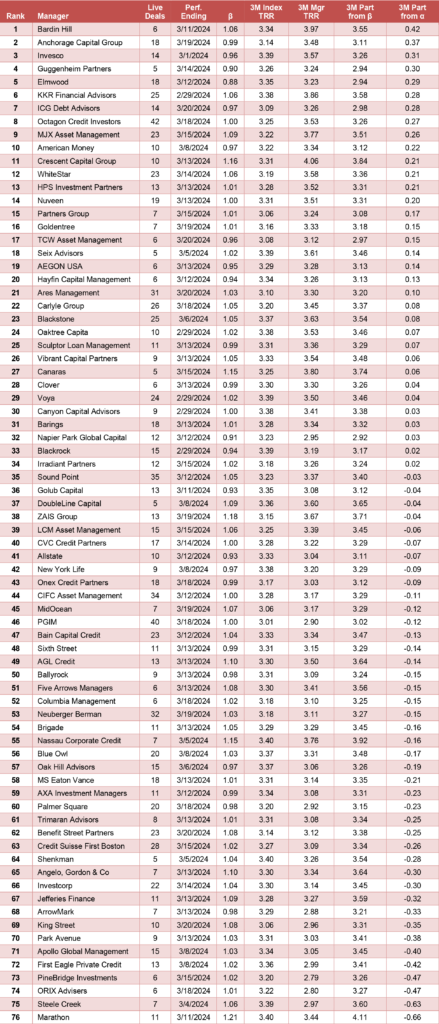
Note: Performance for managers with five or more deals issued since January 1, 2011, and tracked by SanCap. Performance attribution starts with calculated total return on the leveraged loan portfolio held in each CLO for the 3-month reporting period ending on the indicated date. CLOs, even with a single manager platform, may vary in reporting period. The analysis matches performance in each period to performance over the identical period in the Morningstar/LSTA Leveraged Loan Index. Where a deal has at least 18 months of performance history since pricing and no apparent errors in cash flow data, the analysis calculates a deal beta. The deal beta is multiplied by the index return to predict deal return attributable to broad market performance. Where no beta can be calculated, the analysis uses the average beta across manager deals weighted by the average deal principal balance over time. Any difference between performance attributes to beta and actual performance is attributed to manager alpha.
Source: INTEX, Markit, Santander US Capital Markets LLC
A link to SanCap’s latest CLO manager bubble chart (Exhibit 7) and to data on more than 138 managers and more than 2,200 active and expired deals is here.
Exhibit 5: SanCap CLO manager bubble chart
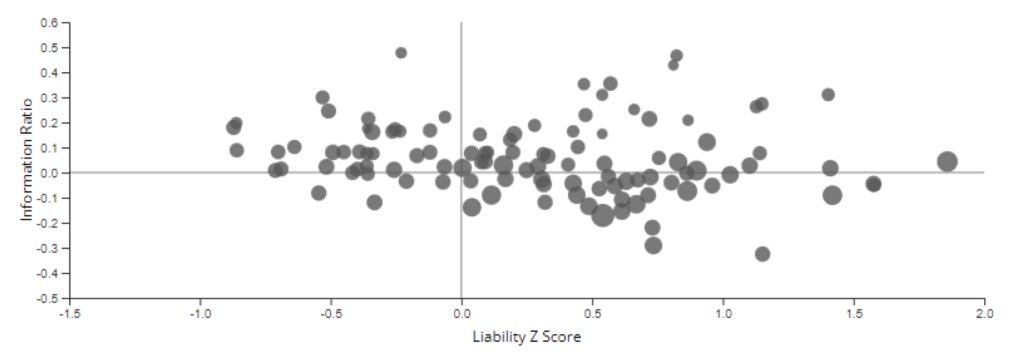
Note: The size of each bubble reflects manager long-term beta.
Source: INTEX, Markit, Santander US Capital Markets LLC
This material is intended only for institutional investors and does not carry all of the independence and disclosure standards of retail debt research reports. In the preparation of this material, the author may have consulted or otherwise discussed the matters referenced herein with one or more of SCM’s trading desks, any of which may have accumulated or otherwise taken a position, long or short, in any of the financial instruments discussed in or related to this material. Further, SCM may act as a market maker or principal dealer and may have proprietary interests that differ or conflict with the recipient hereof, in connection with any financial instrument discussed in or related to this material.
This message, including any attachments or links contained herein, is subject to important disclaimers, conditions, and disclosures regarding Electronic Communications, which you can find at https://portfolio-strategy.apsec.com/sancap-disclaimers-and-disclosures.
Important Disclaimers
Copyright © 2026 Santander US Capital Markets LLC and its affiliates (“SCM”). All rights reserved. SCM is a member of FINRA and SIPC. This material is intended for limited distribution to institutions only and is not publicly available. Any unauthorized use or disclosure is prohibited.
In making this material available, SCM (i) is not providing any advice to the recipient, including, without limitation, any advice as to investment, legal, accounting, tax and financial matters, (ii) is not acting as an advisor or fiduciary in respect of the recipient, (iii) is not making any predictions or projections and (iv) intends that any recipient to which SCM has provided this material is an “institutional investor” (as defined under applicable law and regulation, including FINRA Rule 4512 and that this material will not be disseminated, in whole or part, to any third party by the recipient.
The author of this material is an economist, desk strategist or trader. In the preparation of this material, the author may have consulted or otherwise discussed the matters referenced herein with one or more of SCM’s trading desks, any of which may have accumulated or otherwise taken a position, long or short, in any of the financial instruments discussed in or related to this material. Further, SCM or any of its affiliates may act as a market maker or principal dealer and may have proprietary interests that differ or conflict with the recipient hereof, in connection with any financial instrument discussed in or related to this material.
This material (i) has been prepared for information purposes only and does not constitute a solicitation or an offer to buy or sell any securities, related investments or other financial instruments, (ii) is neither research, a “research report” as commonly understood under the securities laws and regulations promulgated thereunder nor the product of a research department, (iii) or parts thereof may have been obtained from various sources, the reliability of which has not been verified and cannot be guaranteed by SCM, (iv) should not be reproduced or disclosed to any other person, without SCM’s prior consent and (v) is not intended for distribution in any jurisdiction in which its distribution would be prohibited.
In connection with this material, SCM (i) makes no representation or warranties as to the appropriateness or reliance for use in any transaction or as to the permissibility or legality of any financial instrument in any jurisdiction, (ii) believes the information in this material to be reliable, has not independently verified such information and makes no representation, express or implied, with regard to the accuracy or completeness of such information, (iii) accepts no responsibility or liability as to any reliance placed, or investment decision made, on the basis of such information by the recipient and (iv) does not undertake, and disclaims any duty to undertake, to update or to revise the information contained in this material.
Unless otherwise stated, the views, opinions, forecasts, valuations, or estimates contained in this material are those solely of the author, as of the date of publication of this material, and are subject to change without notice. The recipient of this material should make an independent evaluation of this information and make such other investigations as the recipient considers necessary (including obtaining independent financial advice), before transacting in any financial market or instrument discussed in or related to this material.
Important disclaimers for clients in the EU and UK
This publication has been prepared by Trading Desk Strategists within the Sales and Trading functions of Santander US Capital Markets LLC (“SanCap”), the US registered broker-dealer of Santander Corporate & Investment Banking. This communication is distributed in the EEA by Banco Santander S.A., a credit institution registered in Spain and authorised and regulated by the Bank of Spain and the CNMV. Any EEA recipient of this communication that would like to affect any transaction in any security or issuer discussed herein should do so with Banco Santander S.A. or any of its affiliates (together “Santander”). This communication has been distributed in the UK by Banco Santander, S.A.’s London branch, authorised by the Bank of Spain and subject to regulatory oversight on certain matters by the Financial Conduct Authority (FCA) and the Prudential Regulation Authority (PRA).
The publication is intended for exclusive use for Professional Clients and Eligible Counterparties as defined by MiFID II and is not intended for use by retail customers or for any persons or entities in any jurisdictions or country where such distribution or use would be contrary to local law or regulation.
This material is not a product of Santander´s Research Team and does not constitute independent investment research. This is a marketing communication and may contain ¨investment recommendations¨ as defined by the Market Abuse Regulation 596/2014 ("MAR"). This publication has not been prepared in accordance with legal requirements designed to promote the independence of research and is not subject to any prohibition on dealing ahead of the dissemination of investment research. The author, date and time of the production of this publication are as indicated herein.
This publication does not constitute investment advice and may not be relied upon to form an investment decision, nor should it be construed as any offer to sell or issue or invitation to purchase, acquire or subscribe for any instruments referred herein. The publication has been prepared in good faith and based on information Santander considers reliable as of the date of publication, but Santander does not guarantee or represent, express or implied, that such information is accurate or complete. All estimates, forecasts and opinions are current as at the date of this publication and are subject to change without notice. Unless otherwise indicated, Santander does not intend to update this publication. The views and commentary in this publication may not be objective or independent of the interests of the Trading and Sales functions of Santander, who may be active participants in the markets, investments or strategies referred to herein and/or may receive compensation from investment banking and non-investment banking services from entities mentioned herein. Santander may trade as principal, make a market or hold positions in instruments (or related derivatives) and/or hold financial interest in entities discussed herein. Santander may provide market commentary or trading strategies to other clients or engage in transactions which may differ from views expressed herein. Santander may have acted upon the contents of this publication prior to you having received it.
This publication is intended for the exclusive use of the recipient and must not be reproduced, redistributed or transmitted, in whole or in part, without Santander’s consent. The recipient agrees to keep confidential at all times information contained herein.